Joy Y Kiddie MSc., RD - I'm a Registered Dietitian in private practice in British Columbia, Canada that provides low carb and ketogenic services in-person in my Coquitlam office, as well as by Distance Consultation (using Skype / telephone).
I made this low carb Chocolate Hazelnut Olive Oil Cake on a creative whim this past February, just before one of my son’s weddings, and it was quickly dubbed the “Nutella®” Cake.”
This gluten-free, dairy-free cake is rich and moist, with a texture similar to a brownie — but better.
With only 11 net grams of carbohydrate per slice, this grain-free, gluten-free, dairy-free cake would be lovely to serve during the upcoming Passover, and would make a delicious dessert for those who celebrate Easter.
While unsuitable for those with hazelnut, tree-nut, or egg allergies, as a Registered Dietitian, I believe that this cake can (and should) be enjoyed for special occasions. This is a wonderful “sometimes food” (in contrast to an “everyday food.”)
250 g (8 oz net weight) hazelnut meal*
10 g (2 tbsp.) natural cocoa powder 2.5 g (1/2tsp._ baking soda Pinch of salt 147 ml (10 tbsp. / 1/2 cup + 1.5 tbsp.) extra-virgin unfiltered olive oil
112 g / 4 oz granulated erythritol and monk fruit sweetener
3 large eggs, room temperature
10 ml (2 tsp.) real vanilla extract
Optional decoration
1/4 cup roasted hazelnuts, rubbed and crushed
*in this recipe, it is essential that the nuts are weighed rather than measured, as the volume varies with the freshness of the nuts.
Instructions
Line a 22 cm (8.5 inch) springform pan with parchment paper, then grease the paper and sides of the springform pan with some of the same olive oil as used in the recipe.
If hazelnut meal is not available, grind the raw hazelnuts in a food processor until the texture of almond flour. Place in a small bowl.
Add the cocoa powder, baking soda and salt to the bowl with the hazelnut meal.
In a larger bowl, beat the eggs well. To the beaten eggs, gradually add the extra virgin olive oil, and keep beating the mixture until it becomes pale and thick like coffee cream.
Preheat the oven to 340°F (170°C) — which is 315°F (150°C) on a convection oven
Add the real vanilla extract to the egg and olive oil mixture, and beat until well blended.
Into the bowl with the egg and olive oil mixture, gradually add the dry ingredient mixture, stirring gently with a rubber spatula.
Pour the batter into the prepared springform pan, and bake for 45 minutes (until a toothpick inserted into the center comes out clean). Note: the cake will rise slightly more in the center while baking and will fall as it cools. This is expected for this type of cake, so don’t worry!)
Remove the cake from the oven, sprinkle with roasted hazelnuts if using, and allow the cake to fully cool in the springform pan before releasing it.
Macros (from Cronometer®)
Macros for Low Carb Chocolate Hazelnut Olive Oil Cake
Learn More
If you want to know about types of services I provide as The Low Carb Healthy Fat Dietitian, click here to learn more.
LEGAL NOTICE: The contents of this blog, including text, images and cited statistics as well as all other material contained here (the ”content”) are for information purposes only. The content is not intended to be a substitute for professional advice, medical diagnosis and/or treatment and is not suitable for self-administration without the knowledge of your physician and regular monitoring by your physician. Do not disregard medical advice and always consult your physician with any questions you may have regarding a medical condition or before implementing anything you have read or heard in our content.
Last Monday, I went to the lab for updated blood work, including a thyroid hormone panel, additional thyroid antibody tests, and an iron panel. I have moved past the frustration of there being no pricelist available for consumers who are self-paying for lab tests, and am now focusing on the lab test results, and the dietary changes that I need to make in light of those, as I am recovering from hypothyroidism.
DISCLAIMER: This article is a personal account posted under A Dietitian’s Journey. The information in this post should in no way be taken as a recommendation to self-diagnose, self-interpret diagnostic tests, or self-treat any suspected disorder. It is essential that people who suspect they may have symptoms of any condition consult with their doctor, as only a medical doctor can diagnose and treat.
The results came back late Monday afternoon and I met with my doctor to discuss them on Thursday, The good news is that based on calculation estimates converting the bovine Natural Desiccated Thyroid (NDT) medication that I had been taking, to a mixture of Synthroid® (a synthetic T4 medication) and Cytomel® (a synthetic T3 medication), my free T4 and free T3 are almost perfect. As my doctor said when we met, “between your research and my experience, we got this“.
This is a beautiful picture.
TSH, fT4 and fT3 levels on T4/T3 thyroid hormone replacement medication
It shows, as my doctor and I had hoped, that my free T3 (the active thyroid hormone) is in the higher part of the reference range (65.5%); a level considered optimal by endocrinologists and thyroidologists who are well-versed in the use of the combination T4/T3 medications that I have been prescribed.
While my free T4 could be in the higher part of the range on the type of medication that I am taking, it may slightly lower because of the feedback from having sufficient free T3. That’s okay! I am feeling so much better, although it will take another year or more until I am really well again.
As expected, my TSH (Thyroid Stimulating Hormone, the pituitary hormone that tells the body how much thyroid hormone to make) is low because the amount of free T3 is optimal. This is a classic feedback loop where free T3 provides feedback on the pituitary gland, indicating that there isn’t a need to make more thyroid hormone. Think of it like a thermostat. When the room gets warm enough, there is feedback on the thermostat that no additional heat is required, and it turns it off until the room gets cold again.
Of importance, my TSH is not considered “suppressed” (TSH ≤0.03 mU/L) but “low” (TSH = 0.04-0.4 mU/liter) [1], so there is no increased risk of cardiovascular disease or bone fractures. Those with a “high” TSH (>4.0 mU/liter) — which was the level that I was at before being treated, and those with a “suppressed” TSH (≤0.03 mU/L) both have an increased risk of cardiovascular disease, abnormal heart rhythms and bone fractures. Those with “low” TSH (0.04-0.4 mU/liter) like I have, do not [1,2]. So more good news.
I have been diagnosed with Hashimoto’s disease (also known as Hashimoto’s thyroiditis) which is an autoimmune disease and diagnosis is based both on symptoms of hypothyroidism, along with the presence of thyroperoxidase antibodies (TPO-ab) and thyroglobulin antibodies (TG-ab) in the blood [3].
In many cases of hypothyroidism, it is these antibodies that contribute to the gradual disappearance of thyroid cells and the development of hypothyroidism. In my case, it was the trauma to the thyroid that resulted from surgery that I had 30 years ago to remove a benign tumour that was the major contributor to the eventual decrease in thyroid function.
Prior to being diagnosed, as you can read about here, I had all the classic symptoms of hypothyroidism, including body aches, joint pain, fatigue, feeling chilled, constipation, dry skin, hair loss, being forgetful, and even feeling depressed.
By the point I realized that these symptoms were not consistent with long-Covid (which is what I initially suspected) or aging (which my sons assumed), I had developed some of the symptoms of severe hypothyroidism [3], including difficulty with speech, significant water retention, and peripheral edema (swelling) of the ankles and face [3]. There are more photos of what I looked like when I was very sick here as well as photos from the beginning part of my recovery.
To hell and back – 5 months of recovery from hypothyroidism
The photo on the left, above is what I looked like on June 3, 2022, at my youngest son’s wedding. I was so sick. I needed help walking on the beach for family photos, getting out of a chair or a car, I ached all over my body and I was beyond exhausted. I knew I was ill and had plans to see my doctor when he returned from vacation but in the meantime, I attended my son’s wedding, without talking about how I felt. No one really knew how sick I felt until afterwards and I didn’t know how seriously ill I really was until August.
The middle picture, above was taken on September 3, 2022 after losing half my hair as a result of several nutrient deficiencies related to hypothyroidism that I have been correcting through adding specific foods high in these nutrients into my diet, as well as highly bioavailable supplements. At the time the middle picture was taken, I had been on Natural Desiccated Thyroid hormones (natural T4/T3 medication) for 6 weeks. While my doctor wanted me to continue on them because I was doing so much better, I wanted to go on synthetic T4 and T3 thyroid replacement hormones as it would be easier to travel across borders with these recognized medications.
The picture on the right, is me today. I feel as though I have been to “hell and back“. Last week, my doctor said that it will take another year until I feel really well again, and probably another 6 months on top of that until my hair grows back, but I am so thankful for the difference in how I feel the last 5 months. I get tired easily. Hiking is out, and so are evening activities, but as my nutrient status continues to improve and the thyroid hormones permeate all my body’s tissues, I will gradually feel better and better.
The blood tests confirm that I have both thyroperoxidase antibodies (TPO-Ab) and thyroglobulin antibodies (TG-Ab), which along with my symptoms, confirms my diagnosis of Hashimoto’s disease, but thankfully my blood test results indicate that neither are elevated.
Thyroperoxidase-Ab= 9 (<35 IU/mL)
Thyroglobulin Ab= 14 (<40 IU/mL)
While they are not elevated, they are present.
Gliadin and Transglutaminase
For many years I avoided gluten containing products because I thought I was gluten intolerant, although not celiac.
A year ago that I stumbled across some novel ingredients and had an idea to create low carb breads to provide dietary options for those with diabetes. My goal was to enable people who would not otherwise consider a low carbohydrate diet to be able to adopt one, for health reasons. I was mainly thinking of those from bread-centric cultures such as South East Asians (Indian) and Hispanics but in time, I developed many more types of low carb bread.
I was aware of the connection between high gluten consumption and leaky gut syndrome, but against that I weighed the serious morbidity and mortality linked to uncontrolled diabetes. I had come across many people who would rather stay diabetic, and potentially lose their toes or vision than give up bread and developing these breads seemed like the lesser of two evils.
Since being diagnosed with hypothyroidism that I had been developing over the previous 9 years (more about that here), I learned that the gliadin fraction of gluten structurally resembles transglutaminase. Transglutaminase is an enzyme that makes chemical bonds in the body, and while present in many organs, there are higher concentrations of transglutaminase in the thyroid.
In leaky gut syndrome, gliadin (and other substances) result in the gaps in between the cells of the intestinal wall to widen. This results in the immune system of the body reacting to food particles that are inside the intestine, that it normally would not see. It is thought that the immune system reacts to gliadin and creates antibodies to it, seeing it as a foreign invader. Since gliadin and transglutaminase have very similar structural properties, it is thought that in those with leaky gut syndrome, the immune system begins to attack the transglutaminase in the thyroid, and other tissues, contributing to the development of auto-immune conditions, including hypothyroidism.
A-1 Beta Casein and Gluten
A few years ago, I had leaky gut syndrome but it resolved with dietary changes, including avoiding gluten and A-1 beta casein dairy (you can read about what A-1 beta casein dairy is here). Naturally, as I had been working on recipe development for the low carb bread book, I had been eating gluten as I tested them. I also became more liberal in including dairy products from A1-beta casein cows, when I hadn’t used it in years. That started when there was severe flooding last year in Chilliwack last year due to heavy rains after the summer, and that was where my goat milk came from. Even once the roads were open again and the highways rebuilt, I never really went back to using goat milk, which is naturally A-2 beta casein. In the interest of an abundance of caution, I will go back to using dairy products from A-2 beta casein cows, or from goat or sheep milk (that are naturally A-2). Humans produce A-2 beta casein protein, and using milk from A-2 beta casein animals does not result in an immune response. It is not seen as “foreign.”
From what I’ve read and in discussing it with my doctor, it is likely that my hypothyroidism has been developing over the last 30 years, related to the surgery I had to remove a benign tumour. Further supporting that me becoming hypothyroid has been a long time in the making, I have had high-normal levels of TSH over the last 9 years — which happens to be a time period over which I was avoiding both gluten and A-1 dairy. Given that, I think it’s logical to conclude that my hypothyroidism is primarily related to the destruction of thyroid tissue in the invasive surgery connected to removal of the tumour. Further supporting this hypothesis, I currently have fairly low levels of TPO and TG antibodies, so I suspect they have begun developing fairly recently. Since a 2018 study reported that both TPO-antibodies and TG antibodies are decreased in hypothyroid patients following a gluten-free diet [4], it seems wise for me to go back to avoiding gluten, with the goal of lowering my TPO-antibodies and TG-antibodies down to as close to zero, as possible.
Cruciferous Vegetables
Cruciferous vegetables such as Brussels sprouts, broccoli, bok choy, cauliflower, cabbage, kale are known goitrogens. Goitrogens are naturally occurring substances that are thought to inhibit thyroid hormone production. The hydrolysis of a substance known as pro-goitrin that is found in cruciferous vegetables produces a substance known as goitrin, that is thought to interfere with thyroid hormone synthesis [5]. Since cooking cruciferous vegetables limits the effect on the thyroid function, and eating cruciferous vegetables have many health benefits, I will usually eat them cooked, but not in huge quantities. There are studies that found a worsening of hypothyroidism when people ate very large quantities of these (e.g. 1 – 1 ½ kg / day) so it is recommended that intake of these vegetables be kept relatively constant day to day, and limited to no more than 1-2 cup / day. I’ve decided that when I do eat them, to keep intake to the lower end of that range, and eat more non-cruciferous vegetables instead.
Iron Deficiency and Low Stomach Acid (hypochlorhydria)
I now know why I am still so tired. I asked my doctor to run an iron panel and the results show I have low iron. Previous results indicate my vitamin B12 are fine and I continue to supplement methylated folate and B12, so I know those are not a problem.
While my iron stores (ferritin) are okay, they are not optimal i.e., ferritin = 93 (15-247 ug/L) instead of >100ug/L.
My serum iron and iron saturation are very low i.e., serum iron = 11.9 (10.6-33.8 umol/L), iron saturation = 0.15 (0.13-0.50)
Low iron status is common with hypothyroidism, but it was surprising to me because I eat beef liver, or chicken livers every week, and also take a heme polysaccharide supplement (like Feramax®), so it may be due to an absorption problem.
Low stomach acid (hypochlorhydria) is common in hypothyroidism, and since low pH is needed for iron absorption, I have made dietary changes to improve that.
Final Thoughts…
I am very grateful that my doctor recognizes my knowledge as a clinician and is receptive to me advocating for my health. I am incredibly fortunate that he involves me in decisions regarding blood tests, as well as discussing medication types and dosages. As for the dietary changes and supplementation, he is content to let me handle that!
I hope that out of my experience that I have called “to hell and back” that I am able to help others better understand hypothyroid symptoms, diagnosis and treatment options so that they can discuss them with their doctor.
van Vliet NA, Noordam R, van Klinken JB, et al. Thyroid Stimulating Hormone and Bone Mineral Density: Evidence From a Two-Sample Mendelian Randomization Study and a Candidate Gene Association Study. J Bone Miner Res. 2018;33(7):1318-1325. doi:10.1002/jbmr.3426
Flynn RW, Bonellie SR, Jung RT, MacDonald TM, Morris AD, Leese GP. Serum thyroid-stimulating hormone concentration and morbidity from cardiovascular disease and fractures in patients on long-term thyroxine therapy. J Clin Endocrinol Metab. 2010;95(1):186-193. doi:10.1210/jc.2009-1625
Puszkarz, Irena, Guty, Edyta, Stefaniak, Iwona, & Bonarek, Aleksandra. (2018). Role of food and nutrition in pathogenesis and prevention of Hashimoto’s thyroiditis. https://doi.org/10.5281/zenodo.1320419
Krysiak, R.; Szkróbka, W.; Okopień, B. The Effect of Gluten-Free Diet on Thyroid Autoimmunity in Drug-Naïve Women with Hashimoto’s Thyroiditis: A Pilot Study. Exp. Clin. Endocrinol. Diabetes 2018, 127, 417–422.
Felker P, Bunch R, Leung AM. Concentrations of thiocyanate and goitrin in human plasma, their precursor concentrations in brassica vegetables, and associated potential risk for hypothyroidism. Nutr Rev. 2016;74(4):248-258.
LEGAL NOTICE: The contents of this blog, including text, images and cited statistics as well as all other material contained here (the ”content”) are for information purposes only. The content is not intended to be a substitute for professional advice, medical diagnosis and/or treatment and is not suitable for self-administration without the knowledge of your physician and regular monitoring by your physician. Do not disregard medical advice and always consult your physician with any questions you may have regarding a medical condition or before implementing anything you have read or heard in our content.
NOTICE: This my personal experience as a private consumer of lab services, and is not related to my profession as a Dietitian. This article is posted in a separate section of the web page titled “A Dietitian’s Journey” which is about my personal health journeys.
“A Dietitian’s Journey – Part I” was about my two year journey recovering from obesity, and poor metabolic health and “A Dietitian’s Journey-Part II” is my current personal journey recovering from hypothyroidism.
This article is written as a private consumer, which is why it is categorized as a personal account, and an editorial.
This past Monday, I went to the lab to have blood tests to measure my thyroid hormones, anti-thyroid antibodies, and an iron panel. When I had met with my doctor last week, I learned that I would need to pay for the free T3 test because the British Columbia guidelines and protocols for ordering thyroid tests state that a free T3 test is only covered to rule out suspected cases of hyperthyroidism [1]. As I wrote last Thursday, I was “more than willing to pay for a $9.35 test to have all the data.”
I think most people are aware that the healthcare system is economically stretched, and I certainly understand and accept the need to reduce costs. One way to do that is to restrict the ordering of laboratory tests to only medically justifiable circumstances, which makes good sense.
While I recognize that I am not objective in this situation, it would seem to me that when someone is on thyroid hormone replacement medication that includes bothsynthetic T4 and T3 hormones, that the expense of both a free T4 test and free T3 test should be covered by the provincial healthcare system as the cost is justifiable because the prescribing doctor needs to determine if the dosage of both synthetic hormones is adequate, but not too high.
As I said above, I knew last week that I would be paying for the free T3 test and was fine with that, but what I wasn’t prepared for was that I would be expected to pay three times the cost the government pays for the same test, and that there would no patient-price list available.
When I arrived at the lab on Monday, I was told that the free T3 test would cost $32.00. I replied that there must be a mistake, because the cost of the test is $9.35. I was informed that the government pays $9.35 for the free T3 test, but the patient-pay cost for the same test is $32.00. I explained to the person at the desk that I could understand the test costing more if there was a set-up fee for a stand-alone test, or for a separate blood draw, but this test was going to be run with others using the same blood draw. I was informed that $32.00 is the patient-pay cost of the free T3 test regardless of whether it is done with other tests, or by itself.
I asked if I could please see the price list with the patient-pay costs, and was told that there isn’t one. I was asked if I wanted to have the free T3 test period formed, and if I did that I would need to pay $32.00. What choice did I have? It was not as though I could go to one of the lab’s competitors, as this private lab company is the only one providing laboratory services in this city.
[NOTE (October 28, 2022: I have spoken to people in other provinces, and it appears from what people have said that the practice of diagnostic laboratories not disclosing patient-pay prices occurs in Manitoba, Ontario, and British Columbia. This practice may also occur in others provinces as well, but I don’t know. This article written as private consumer is about the practice of diagnostic labs not disclosing patient-pay prices to consumers, irrespective of which province the practice occurs in, or by what company.]
I paid the $32.00 for the test because I needed this information to know the effect of the medication on my thyroid hormones, and for my doctor to know whether a medication adjustment was needed. I had the disposable income to pay for it, but what about consumers who need a laboratory test to make health decisions or for their doctor to be able to, and who cannot afford that?
… and why are patient-pay clients charged 3 times as much as the government pays for the same test? Even if a private consumer was only requesting a stand-alone test and had to pay the ~$15 blood draw fee, this test would only cost $25, not $32.
After my appointment, I wrote the regional office of the lab company and asked “to have the patient-pay lab prices for British Columbia.” I heard back from a Client Service Advisor who told me that “We do not provide a list of what we charge to patients“.
I was flabbergasted.
I’ve always made the assumption that private businesses are required to post their prices, or at least make them available when asked.
As an individual consumer, what happened at the lab would be like going to the grocery store to buy food, but none of the items for sale have marked prices. You are required to pick out the things you need, but only find out at the cash register what the price is.
When you get to the cash, you ask the cashier about the prices, and she tells you there’s no price list, but she can give you the total cost at the end, and you can either pay, or put the items back. Needing the items, you pay what you are told, and take your receipt.
When you get home, you decide to write the head office and ask if they can send you a price list, and are told there IS one, but that they can’t give it to you.
[UPDATE October 29, 2022: The way things are currently set up, one has to make an appointment with the lab, go there, line up and give the person at the desk their requisition, and only then can find out how much the patient-pay part will cost.
After investing so much time, consumers are put in a position of having to make a decision on the spot — pay whatever is being asked, or leave without the test.
Consumers should be able to access the prices online and make a decision at their leisure, before investing so much time.]
I don’t know whether private businesses in Canada required to post their prices, or make them available when asked. I’ve always assumed they were, but I could be wrong. If there is a requirement to do so, do diagnostic labs have an exemption that enables them not to make their prices available to members of the public?
UPDATEOctober 28, 2022: I have since found out the same company provides a price list to allied health professionals so that they can provide laboratory assessment services to their clients, and if they choose they can mark up the cost in their own billing.
There are 2 versions of this test list available. They are identical except the one for British Columbia does not have the prices indicated, whereas the Ontario one does (see below).
I have also since found out that the company DOES have patient-pay price list that is titled “British Columbia Private Price List for Commonly Ordered Lab Tests” and is dated April 2021. It is marked “confidential” and as a result cannot be publicly shared. See #3, below.
The allied healthcare price list available in Ontario, dated November 2018 has the prices marked. I have removed the company’s identifying colours, logo, and information and posted their allied health professional test list here.
The allied healthcare price list available in British Columbia, dated June 2020 does not have the prices marked. I have likewise removed the company’s identifying colours, logo and information and have posted their allied health professional test list here.
Above is the allied health professional cost (November 2018) for an entire thyroid panel of 6 thyroid-related lab tests, including;
TSH
free T4
free T3
reverse T3
thyroperoxidase antibody (TPO)
anti-thyroglobin antibody (TG-ab)
Compared to what the BC government pays for the same tests (minus the reverhttp://from http://www.bccss.org/bcaplm-site/Documents/Programs/laboratory_services_schedule_of_fees.pdfse T3 which isn’t paid for by MSP) the above panel costs $80. Presumably naturopaths are charged prices similar to what MSP pays.
3. I have since found out that there IS a patient-pay price list and it is titled “British Columbia Private Price List for Commonly Ordered Lab Tests” and is dated April 2021.
The prices cannot be posted because the notice at the top of the price list reads;
“This is a confidential document. Please do not disclose our prices publicly except in conversations with your patients.”
Why is the private-pay price of lab tests a confidential document, and why can’t the prices of lab tests be disclosed to the public?
Are business in British Columbia required to disclosed their prices and if so, are diagnostic labs exempt from making their private-pay prices available to consumers?
I don’t know.
How many people would be willing to order dinner at a restaurant that did not post the price of its menu items until after they ordered?
My Thoughts on Patient-Pay Prices
I believe that as consumers, private-pay individuals have a right to have access to the prices for laboratory tests in advance, so that they can consider their decision to purchase, or not purchase these services. Consumers expect grocery stores and department stores to post their prices, and it is my personal opinion that privately owned laboratories from whom private consumers purchase services should be no different.
I also think private-pay individuals have a right to know why they are required to pay a premium price for the same services that the government gets for a third the cost, and allied healthcare professionals obtain for approximately half the cost.
This differential pricing for allied health professionals is a little like retailers selling supplements to practitioners at wholesale prices, while expecting the consumer to pay full price. Even car dealerships have “employee pricing” events so that the average consumer can take advantage of the same discounts provided to their employees, but at these diagnostic labs, consumers are unable to know in advance how much they will be paying for services before they arrive at the cash.
I believe that as private businesses, diagnostic laboratories are free to set their prices as they see fit but it would seem that (1) consumers should be able to know what those prices are in advance, and (2) that consumers should also know that they are paying a premium price for the same services, compared to what the government and allied health professionals are paying.
I am very grateful to live in a country where publicly funded medical care is available. I am thankful to have access to excellent diagnostic lab tests, and don’t even mind paying the same cost the government pays for tests that I want to have done. But as a private consumer, I believe the cost of services need to be available and that there needs to be transparency with regards to pricing discounts provided to others.
LEGAL NOTICE: The contents of this blog, including text, images and cited statistics as well as all other material contained here (the ”content”) are for information purposes only. The content is not intended to be a substitute for professional advice, medical diagnosis and/or treatment and is not suitable for self-administration without the knowledge of your physician and regular monitoring by your physician. Do not disregard medical advice and always consult your physician with any questions you may have regarding a medical condition or before implementing anything you have read or heard in our content.
Yesterday (October 22, 2022), I was the Dietitian representing low carb and keto diets in the management of type 2 diabetes at the Diabetes Canada Let’s End Diabetes Virtual Conference. I co-presented with two other Dietitians; Jenna Walsh, RD, CDE who represented intermittent fasting, and Alka Chopra, RD, CDE who represented a plant-based approach.
I had hoped to be able to be able to post a link to the talk so that people could watch it, but that wasn’t possible. It also could not be downloaded and posted, so I made it as easy as possible for those who want to watch the talk to be able to do so.
Anyone can register for FREE on the Diabetes Canada website and watch any of the sessions (including the one I was in), but since some people had difficulty navigating the site yesterday, I am posting step-by-step directions here, including
(1) registering for the Diabetes Canada “Let’s End Diabetes” Conference for free
(2) finding to the “auditorium”
(3) entering the auditorium, and
(4) selecting the session you would like to watch (with the one I was in, as an example).
How to Register and Watch Diabetes Canada’s “Let’s End Diabetes” Sessions
(1) to register for the Diabetes Canada “Let’s End Diabetes” Conference for FREE, click here and select “register”.
(2) once you have completed your registration, find the “auditorium” (see Step 2, below) and click on it (you will be brought here).
(3) Once you click on the link, you will be brought into the “auditorium”. On the screen, you will see “click here to view sessions“ (where circled in red, below).
(4) You will be broughthereand see a list of all the sessions available. To watch “Ask the Dietitian; Demystifying Popular Eating Patterns“, scroll down to the last session and click “play”.
More Info about Me
If you would like more information about how I can support you following a low carbohydrate of very low carbohydrate diet, please have a look under the Services tab, or send me a note through the Contact Me form.
LEGAL NOTICE: The contents of this blog, including text, images and cited statistics as well as all other material contained here (the ”content”) are for information purposes only. The content is not intended to be a substitute for professional advice, medical diagnosis and/or treatment and is not suitable for self-administration without the knowledge of your physician and regular monitoring by your physician. Do not disregard medical advice and always consult your physician with any questions you may have regarding a medical condition or before implementing anything you have read or heard in our content.
This morning I met with my doctor for my 6-week follow-up appointment to review my ongoing hypothyroid symptoms, current T4 & T3 medication dosages, and to discuss additional blood work to see how my body is responding to medication, as well as nutrient supplementation. I continue to be in awe of how cooperative my doctor is being! I am very well aware how many people with hypothyroidism do NOT get this kind of support from their doctors! I am very thankful.
My doctor agreed to my request for a thyroid panel [TSH, free T4, and free T3] even though I may have to pay for FT3 because of the provincial guidelines.
In British Columbia, free T3 testing is only available for those with suspected hyperthyroidism, not to assess levels of T3 as a result of thyroid hormone replacement medication. I am more than willing to pay for a $9.35 test [1] to have all the data.
I will also be having a full iron panel to see how my body is responding to nutrient supplementation , as iron status tends to be low in those with hypothyroidism. I have already had blood tests for other nutrients of concern in hypothyroidism, as well as for those I have been supplementing.
My doctor even ordered a thyroglobulin antibody (TG-ab) test, even though TPO antibodies for Hashimoto’s were negative. Interestingly, he thinks as do I that it is prudent to assume a Hashimoto’s diagnosis even in the absence of antibodies and act accordingly when it comes to diet and increased risk of other auto-immune disorders.
This coming Monday, I am going for my blood tests and should have the results back in 24-48 hours and am meeting with my doctor again next Thursday to go over the results, and consider medication dosage adjustment.
I am very grateful to be able to work with my doctor to advocate for my health, to be involved in the decision regarding blood tests, as well as discussing together medication adjustment.
I hope that out of my experience navigating my own care related to hypothyroidism, to better be able to help others advocate for themselves in this area.
LEGAL NOTICE: The contents of this blog, including text, images and cited statistics as well as all other material contained here (the ”content”) are for information purposes only. The content is not intended to be a substitute for professional advice, medical diagnosis and/or treatment and is not suitable for self-administration without the knowledge of your physician and regular monitoring by your physician. Do not disregard medical advice and always consult your physician with any questions you may have regarding a medical condition or before implementing anything you have read or heard in our content.
This article is the fourth entry in A Dietitian’s Journey Part II, which began with my recent diagnosis of hypothyroidism. This post is about how I will measure success as I recover from hypothyroidism.
NOTE: Articles posted under A Dietitian’s Journey are separate from referenced clinical articles (categorized as Science Made Simple articles) because these are about what happened to me (i.e., anecdotal) and based on my personal observation.
A Dietitian’s Journey – Part I
What “success” looked like after the first A Dietitian’s Journey
“A Dietitian’s Journey” (Part I) was my personal weight-loss and health-recovery journey that began on March 5, 2017 when I decided to make dietary and lifestyle changes so that I could reclaim my health. At that time, I was obese, had type 2 diabetes for the previous 8 years, and extremely high blood pressure.
Two years later, on March 5, 2019, I accomplished all but one of my goals, and the last one I achieved three months later. In all, I lost 55 pounds and more than a foot off my waist, and met the criteria for partial remission of type 2 diabetes, and remission of hypertension (high blood pressure).
To get an idea of what I looked like at the beginning and the end of that journey, there are two short videos on my Two Year Anniversary post that tell the story well. The first video was taken when I started and it is very apparent how obese I was, and how difficult it was for me to walk and talk at the same time. The second clip was taken when I completed my journey, and the difference is unmistakable.
A Dietitian’s Journey – Part II
Without much difficulty I maintained my health and my weight-loss from March 2019 until August 2020 but then I came down with Covid. This was at the very beginning of the pandemic and no one really knew what to expect in terms of symptoms. As you can read about in the first post in what has become A Dietitian’s Journey Part II, (When a New Diagnosis is a Long Time Coming ) I had symptoms that both my doctor and I assumed were related to the virus, including muscle aches and joint pain, being exhausted, having ‘brain fog,’ headaches, and having the shivers.
Afterwards, I had to work very hard to regain my mobility. No one knew this wasn’t ‘normal.’
At first, I could barely walk up a flight of stairs. At the time, “success” was being able to walk around the block. Then I began taking several dietary supplements to help strengthen my immune system and in retrospect, the reason I felt better was likely due to the fact that these were all supplements involved in thyroid support. Success at the time was being able to walk around the man-made lake at the local park, but over the weeks and months of supplementing my diet and walking every weekend, success was being able to complete several medium difficulty hikes in the local mountains.
Unfortunately, in March of 2022, I came down with what my doctor assumed was Covid again. At first the symptoms were similar to what I experienced in August 2020, including muscle aches, joint pain, being exhausted, feeling cold all the time, with the only difference being that I didn’t have headaches. The symptoms persisted for several months and I was beginning to think that I had “long-Covid.” As most people did over the pandemic, I put on 20 pounds, but from March to May, I began to look as though I was putting on significant weight, but every time I got on the scale it indicated only a few pounds of difference. I had no idea what was going on.
The next symptom that I became aware of was swelling in my ankles. It wasn’t just a little bit of swelling, but significant enough that I needed to wear compression stockings all day.
At my youngest son’s wedding at the beginning of June, I looked like I did when I was 55 pounds heavier, but I wasn’t.
LEFT: March 5, 2017, RIGHT: June 3, 2022
About three weeks after the wedding, I was diagnosed with hypothyroidism, and started taking desiccated thyroid. At first, I felt significantly better, and within several weeks, the edema in my legs began to subside.
There is still a fair amount of mucin accumulation in my legs, but as of this weekend, I can begin to grab a very small amount of flesh between my fingers. From what I have read it will take at least 6 months for this to resolve. You can read a referenced article about the skin symptoms associated with hypothyroidismhere.
It is easy to see from the above photo that in less than 3 months on thyroid medication treatment, my face has lost its puffy, “inflated” look yet amidst the positive improvements of decreased edema and looking more like myself in some respects is the reality that I have lost ~1/2 of my hair due to telogen effluvium that often occurs with sustained hypothyroidism. You can read more different causes for hair loss here.
Loss of half my hair in 3 months due to telogen effluvium.
Even though I have already been on thyroid replacement hormones for several months, it usually takes ~3-6 months for hair loss to stop and another3-6 months for regrowth to be seen and 12-18 months to complete regrowth [3]. For someone like my who has lost half their hair, six months to a year to begin to see hair growth can seem like an eternity.
I recently changed medication forms fromdesiccated thyroid to a mixture of T4 medication (Synthroid®) and T3 medication (Cytomel®).The overall distribution of T4:T3 is about the same, but it is hoped that this mixture will result in more stable thyroid hormones day-to-day.
In six weeks I will have new blood tests to re-evaluate whether my levels have improved. At last check, my TSH was still high-normal (3.47 mU/L) when in most patients on thyroid hormone replacement thegoal TSH level is between 0.5 to 2.5 mU/L [7]. My Free T4 = 14.0 pmol/L which is still in the lower end of the range (10.6-19.7 pmol/L) when it is considered optimal to be in the higher end of the range.
Metabolic Changes due to Hypothyroidism
It’s well known that people with hypothyroidism experience several clinical changes including different type of anemia, changes in how their heart functions, changes in blood pressure, blood sugar and cholesterol and weight gain due to a slower metabolism. My recent medical work up indicates that I was no different in this regard.
Different Types of Anemia
People with hypothyroidism have a decrease in red blood cells and experience different types of anemia, including the anemia of chronic disease. In addition, 10% of people with hypothyroidism develop pernicious anemia, which is associated with vitamin B12 and folate (folic acid). Iron deficient anemia is also common due to decreased stomach acid that results in decreased absorption of iron.
I was supplementing with B12 and folate and as a result have no signs of pernicious anemia, however my hematology panel indicates that I may have iron deficient anemia. An iron panel would be able to quantify this, however I am already taking heme iron supplements, along with vitamin C to support absorption.
Heart Changes
The slowing of metabolism associated with hypothyroidism also results in a decrease in cardiac (heart) output, which results in both slower heart rate and less ability for the heart to pump blood. This is what results in the unbearable fatigue.
High Blood Pressure
The decreased ability of the heart to pump leads to increased resistance in the blood vessels, which results in increased blood pressure (hypertension).
In those who had normal blood pressure previous to developing hypothyroidism, blood pressure can rise as high as 150/100 mmHg. Hypothyroidism may increase it further for those previously diagnosed with high blood pressure. While my blood pressure had been normal for more than a year, it gradually started increasing the last year, which in retrospect is the period of time over which I was exhibiting more and more symptoms of hypothyroidism. I have since been put back on medication for hypertension to protect my kidneys, which I hope to be able to get off of again within the next six month to a year, as my thyroid hormones normalize.
Weight Gain
Thyroid hormones act on every organ system in the body, but the thyroid is well-known for its role in energy metabolism. When someone has overt hypothyroidism, there is a slowing of metabolic processes, which results in symptoms such as fatigue, cold intolerance, constipation, and weight gain.
Weight gain is not only about diet or how much someone eats versus how much they burn off. It is also about the person’s metabolic rate, which can be impacted by several things, including decreased thyroid hormones. I gained 20 pounds over the pandemic (much of which overlaps with the period of time over which I was exhibiting more and more symptoms of hypothyroidism. I also gained 10 pounds from March to June which is mostly water weight, due to the mucin accumulation.
High Cholesterol
It has long been known that those with hypothyroidism have high total cholesterol, high low-density lipoproteins (LDL) [4], and high triglycerides (TG) [5], which results from a decrease in the rate of cholesterol metabolism. My doctor deliberately did not want to check these last time, because he knew they would be abnormal only as a result of the hypothyroidism. He plans to evaluate them once I have been stable on hormone replacement for several months.
So, What Does Success Look Like Now?
Just as I had a clear idea of what success looked like in my first A Dietitian’s Journey, I have a clear idea of what I would like success to look like this time, as I recover from my hypothyroid diagnosis.
Over the next year, this is what I want to accomplish;
weight same as March 5, 2019 (end of A Dietitian’s Journey, part I)
waist circumference same as March 5, 2019 (end of A Dietitian’s Journey, part I)
regrowth of my hair to same thickness as before clinical symptoms of hypothyroidism
restoration of iron deficient anemia: (a) normal ferritin 11-307 ug/L (b) iron 10.6-33.8 umol/L (c) TIBC 45–81 µmol/L (d) transferrin 2.00-4.00 g/L
Blood pressure ≤ 130/80 mmHg
Blood sugar:
(a) non-diabetic range fasting blood glucose ≤ 5.5 mmol/L
(b) non-diabetic range HbA1C ≤ 5.9 %
While I don’t know if it will be possible to achieve all of these within the time frame or within adjustments to medication that my doctor will be willing to make, these are my goals. I believe that most of these are possible, and as far as they are within my control, this is what I would like to accomplish.
I have achieved a lot the last 3 months, but I am not “done.” I want the rest of my life back!
I want to be able to do the things that I enjoy, and to have the freedom to make plans in the evening knowing I will have the energy to follow through.
I think this is reasonable to ask and I will do everything I can to make this a reality.
Rotondi M et al. Serum negative autoimmune thyroiditis displays a milder clinical picture compared with classic Hashimoto’s thyroiditis. Eur J Endocrinol 2014;171:31-6. Epub April 17 2014
Croce, L., De Martinis, L., Pinto, S. et al. Compared with classic Hashimoto’s thyroiditis, chronic autoimmune serum-negative thyroiditis requires a lower substitution dose of L-thyroxine to correct hypothyroidism. J Endocrinol Invest 43, 1631–1636 (2020). https://doi.org/10.1007/s40618-020-01249-x
Malkud S. Telogen Effluvium: A Review. J Clin Diagn Res. 2015;9(9):WE01-WE3. doi:10.7860/JCDR/2015/15219.6492
Lithell, H., Boberg, J., Hellsing, K., Ljunghall, S., Lundqvist, G., Vessby, B., & Wide, L. (1981). Serum lipoprotein and apolipoprotein concentrations and tissue lipoprotein-lipase activity in overt and subclinical hypothyroidism: the effect of substitution therapy. European journal of clinical investigation, 11(1), 3–10. https://doi.org/10.1111/j.1365-2362.1981.tb01758.x
Nikkila E, Kekki M, Plasma triglyceride metabolism in thyroid disease, J Clin Invest. 1973;51:203.
Iron Disorders Institute, Iron Deficiency, Understanding Iron Deficiency Anemia, http://irondisorders.org/iron-deficiency-anemia/
American Thyroid Association, Is the TSH (thyroid stimulating hormone) a good way to titrate my thyroid hormone therapy? https://www.thyroid.org/patient-thyroid-information/what-are-thyroid-problems/q-and-a-tsh-thyroid-stimulating-hormone/
DISCLAIMER: The information in this post should not be taken as a recommendation to self-diagnose, self-interpret diagnostic tests, or self-treat any suspected disorder. It is essential that people who suspect they may have symptoms of any condition consult with their doctor, as only a medical doctor can diagnose and treat.
LEGAL NOTICE: The contents of this blog, including text, images and cited statistics as well as all other material contained here (the ”content”) are for information purposes only. The content is not intended to be a substitute for professional advice, medical diagnosis and/or treatment and is not suitable for self-administration without the knowledge of your physician and regular monitoring by your physician. Do not disregard medical advice and always consult your physician with any questions you may have regarding a medical condition or before implementing anything you have read or heard in our content.
We form an opinion about someone’s appearance when we haven’t seen them in a while, or meet them for the first time. We do so unintentionally, but we judge by appearance. Sometimes the appearance of weight gain is not about diet but a diagnosis.
DISCLAIMER: (August 28, 2022): This article a personal account posted under A Dietitian’s Journey. The information in this post should in no way be taken as a recommendation to self-diagnose, self-interpret diagnostic tests, or self-treat any suspected disorder. It is essential that people who suspect they may have symptoms of any condition consult with their doctor, as only a medical doctor can diagnose and treat.
The photos below are both of me. On the left is what I looked like when I began my personal weight-loss and health-recovery journey on March 5, 2017. Over the following two years, I lost 55 pounds and 12 ½ inches off my waist following a low carb, and then a ketogenic diet. The process was slow — agonizingly slow and in retrospect, I now know why. The photo on the right is what I looked like two years later, maintaining my weight loss.
LEFT: March 5, 2017 RIGHT: December 2021 – after two years weight maintenance
Almost imperceptibly, my appearance began to change. I didn’t “see it” at the time, but I was aware that my waist circumference was different and that my clothes felt tighter. What I couldn’t understand was that I had only “gained” approximately five pounds.
The two photos below clearly show the subtle difference.
LEFT: Hiking March 5, 2021, RIGHT: Hiking March 5, 2022
The photo on the left was taken on the two-year anniversary of completion of my weight loss journey which lasted from March 5, 2017-March 5, 2019 (documented under A Dietitian’s Journey). This entry in that journal which is titled From the Mountains Through the Valleys was written for my fifth anniversary, the day before the photo on the right.
The photo on the right was taken this past year in March, exactly one year after the photo on the left. The comparison is easy because I was wearing the same clothes. While my weight was only approximately five pounds greater than on the left, it is clear to see that my face was puffier, as were my legs. I remember getting dressed that morning and wondering why all my hiking clothes felt so tight. I also vividly remember how difficult the hike was that day — and it was a simple one with very little elevation. My legs felt heavy, and it was hard to walk up even the gentlest of inclines.
Despite having both vaccines in April 2021 and July 2021, a few days later I came down with what my doctor and I presumed was my second case of Covid-19.
I had Covid the first time in August 2020 and wrote about it in the journey entry titled, To Covid and Back). In retrospect, I think the ‘post-viral arthritis’ I experienced afterwards may have been linked to my thyroid’s response to the virus (documented in the literature). In that post, I wrote about recovering from Covid the first time;
“By the end of August (after Covid) it was difficult for me to even walk up (or down!) a flight of stairs. This both shocked and scared me.
I began to go for walks — even though it was very hard. At first they were literally just around the block, but I kept at it. One of my young adult sons who lives with me kept encouraging me to walk, and would sometimes go with me. As my legs became stronger, walks turned into short inadvertent hikes’ and I discovered I really liked being out in the woods, even though it remained very hard to step up onto rocks, or step down from them. I dug out the wood hiking staff that I brought with me when I moved from California and put it into service., invested in some hiking boots and other essentials’. As I said in the previous article, my hiking stick — along with my fuchsia rain gear has become somewhat of an identifier— but the truth is, without the hiking stick, I could not have possibly begun to hike.
My first breakthrough was in late November, when I did my 4th real hike which was 12 km around Buntzen Lake — which in terms of a few elevation gains was really beyond my capabilities. With frequent stops and lots of encouragement from my son, I did it. I had to. He couldn’t exactly carry me back to the car! That day I felt as though I had beaten the post Covid muscle weakness and was on my way back to health.”
When I got Covid again this past March, the symptoms were pretty much the same as in August 2020, muscle aches and joint pain, being exhausted, feeling cold all the time and my lips were frequently blue. The only difference was this time I did not have headaches. I was loaned an oximeter by a family member who is a nurse and I found it quite strange that my body temperature was always two degrees below normal even though I had fever-like symptoms of being cold and shivering. The muscle aches were significant, as was the fatigue, but since these are also symptoms of Covid, I didn’t think much of it. It was only when I began to develop symptoms that were not associated with Covid that I began to become concerned.
Me at my youngest son’s wedding, June 3, 2022
Fast forward to the beginning of June which was my youngest son’s wedding. I was so very unwell, but avoided talking about it as I did not want to detract from the very special occasion.
I was experiencing joint pain and muscle aches, and chills that would come and go. I would frequently get bluish lips, and continued to have significant non-pitting edema in my legs and ankles, and was wearing compression stockings all the time — even at the wedding. Most pronounced was the debilitating fatigue.
The skin on my cheeks had become flaky and dry and despite trying multiple types of intense moisturizers, nothing helped. My mouth symptoms had progressed to the point that I found it difficult to say certain words when speaking because my tongue seemed too large for my mouth, and the salivary glands underneath my tongue were swollen.
The muscle weakness had progressed to the point where it was difficult for me to get up from a chair, or to get out of my car without pushing myself up with my hands. My eldest son was helping me get to and from the beach for the photos, and out of the car. He thought it was me aging, and when I recently asked my other two sons, they assumed the same thing. I was wondering if I had some form of “long-Covid,” but what got me starting to think that my symptoms had something to do with my thyroid was the very noticeable swelling in my face.
At my son’s wedding I looked like I did when I was 55 pounds heavier!
LEFT: March 5, 2017, RIGHT: June 3, 2022 at my youngest son’s wedding.
The photo on the left, above is what I looked like when I began my weight-lost journey on March 5, 2017. The photo on the right is what I looked like June 3, 2022, at my youngest son’s wedding. I look more or less the same in both pictures, but with a fifty pound difference in weight.
I found out a few weeks later, I had hypothyroidism and was displaying many of the symptoms of myxedema. [I have written an article from a clinical perspective about the symptoms of hypothyroidism, which is posted here.]
While we do it unintentionally, we all judge by appearance, and “weight gain” is no different. If we see someone at one point in time, we form an opinion based on what we see. If anyone would have bumped into me three months ago, it would have been reasonable for them to assume that I had gained back all the weight I had lost, and then some. But that wasn’t the case.
But what causes the appearance of “weight gain,” without gaining significant amounts of weight?
As I explain in this recent clinical post about hypothyroidism, the “puffiness” is due to the accumulation of mucin under the skin. Mucin is a glycoprotein (a protein with a side chain of carbohydrate known as hyaluronic acid) that is naturally produced in the skin. Under normal circumstances, hyaluronic acid binds water to collagen and traps the water under the skin, keeping it looking moist and plump, In fact, hyaluronic acid is injected into the skin by dermatologists to make aging skin appear younger. The problem in hypothyroidism is that an excess of mucin accumulates under the skin, giving it a “tight, waxy” swollen texture. (I would describe it as feeling like an over-inflated balloon).
Below is a photo showing the change in appearance in my left leg from November 3, 2021 (left), to July 16, 2022 (middle), to August 26, 2022 (right).
The photo on the left was taken by me last November while I was doing some stretches. It was still on my phone in mid-July when I took a picture of the swelling in my lower legs and ankles caused by mucin accumulating in the skin. The photo on the right was taken this morning, and while much of the swelling has been reduced, I am still unable to pinch any skin on my legs due to the remaining mucin. I have read that it can take 6 – 8 months for this to resolve.
I want people to understand that the appearance of “weight gain” and “weight loss” in hypothyroidism is different than weight gain and weight loss due to dietary changes. The difference, however can be very subtle.
In my case, the appearance of “weight gain” occurred very slowly.
My appearance between March 5, 2021 and exactly a year later are almost indistinguishable. It is only in retrospect, that I can see the puffiness in my face and legs. At the time, I was puzzled why my clothes fit tighter when there was only a 5 pound difference in my weight, but beyond that I didn’t give it any thought.
Below is a composite photo to help illustrate how slowly my appearance changed at first, and how quickly it progressed as my thyroid disorder progressed.Look how rapidly my appearance changed in only three months, between March 5, 2022, and my son’s wedding on June 3, 2022!
[NOTE: As I’ve mentioned in all of my previous articles and posts about hypothyroidism, each person will present with different symptoms, and even those with the same symptoms may have very different appearance because of differences in their thyroid dysfunction. Keep in mind, these photos describe only my own experience.]
Below is a composite photo to illustrate how quickly the appearance on my my face has resolved after only two months of thyroid treatment.
[NOTE: Again, this is my experience and each person’s will be different, depending on the nature of their thyroid dysfunction, as well as the type, timing and dosage of treatment their doctor prescribes.]
Last two photos are only 2 months after beginning thyroid treatmentI understand “regular” weight gain and the “weight gain” that often goes with hypothyroidism from both sides of the clinical desk.
An Expanded Perspective
My clinical practice changed 5 years ago when I came to understand what hyperinsulinemia was, and how early clinical signs of developing type 2 diabetes are evident as long as 20 years before diagnosis. In a similar way, my clinical practice is changing again now as the result of what I am learning about hypothyroidism.
Understanding the wide range of clinical and subclinical symptoms that people may have leads me to ask additional questions, to look at lab test results differently, and to ask for additional ones if it seems clinical warranted. While it is beyond the scope of practice of a Dietitian to diagnose any disease or to treat hypothyroidism, I am more aware of what to look and this helps me to refer people back to their doctor if I feel there may be a clinical concern.
Final Thoughts…
We form an opinion about someone’s appearance when we haven’t seen them in a while or when we meet them for the first time. While we do so unintentionally, in developing that opinion, we judge by appearance but sometimes the appearance of “weight gain” is not about diet, but about a diagnosis.
If anyone had seen me three months ago after not seeing me in a while, they might have assumed that I had gained back all the weight I had lost.
When we encounter someone who is overweight, we ought to bear in mind that don’t know where they are on their journey. We don’t know if they have metabolic issues related to glucose and insulin metabolism, are struggling with food addiction, or have an endocrine dysfunction, like hypothyroidism, or something else.
photos taken less than 3 months apart
People seeing me now have no idea that less than three months ago I looked as I did on the left, and was very ill.
As much as it is natural for all of us to form an opinion, let’s try not to let that opinion become a judgement. Listening is a great way to find out more.
LEGAL NOTICE: The contents of this blog, including text, images and cited statistics as well as all other material contained here (the ”content”) are for information purposes only. The content is not intended to be a substitute for professional advice, medical diagnosis and/or treatment and is not suitable for self-administration without the knowledge of your physician and regular monitoring by your physician. Do not disregard medical advice and always consult your physician with any questions you may have regarding a medical condition or before implementing anything you have read or heard in our content.
This article is the second entry in A Dietitian’s Journey Part II, which began with my recent diagnosis of hypothyroidism. The first entry in Part II was written last Friday, and you can find it here. This article is about how the factors by which I measure health have changed due to my diagnosis.
NOTE: Articles posted under A Dietitian’s Journey are separate from referenced clinical articles (categorized as Science Made Simple articles) because these are about what happened to me (i.e., anecdotal) and based on my personal observation.
DISCLAIMER: The information in this post should not be taken as a recommendation to self-diagnose, self-interpret diagnostic tests, or self-treat any suspected disorder. It is essential that people who suspect they may have symptoms of any condition consult with their doctor, as only a medical doctor can diagnose and treat.
A Dietitian’s Journey – Part I
“A Dietitian’s Journey” was my personal weight-loss and health-recovery journey that began on March 5, 2017 when I decided to make dietary and lifestyle changes so that I could reclaim my health. At that time, I was obese, had type 2 diabetes for the previous 8 years, and extremely high blood pressure. I achieved my goal two years later, on March 5, 2019. In retrospect, I realize why it took a year longer than I anticipated. It is because I had high TSH levels, almost out of range. I had borderline subclinical hypothyroidism.
I believe that you can’t achieve a goal you don’t set“. In other words, I accomplished my health goals the last time, because I set them. As the popular expression goes, “A goal without a plan is a wish.”
I also believe that success needs to measurable — that is the “m” in SMART goals (specific, measurable, achievable, relevant /realistic and timely.) Before I began of Part I of A Dietitian’s Journey, I not only set my goals, I asked myself “what will success look like” which helped me define how I would measure success.
I wanted to achieve a normal body weight, be in remission of both type 2 diabetes and hypertension (high blood pressure).
Two years later, on March 5, 2019, I accomplished all but one of my goals, and the last one I achieve 3 months later. I lost:
55 pounds
12- 1/2 inches off my waist
3 -1/2 inches off my chest
6 -1/2 inches off my neck
4 inches off each arm
2- 1/2 inches off each thigh
I met the criteria for partial remission of type 2 diabetes 3 months earlier
my blood pressure still ranged between normal and pre-hypertension
If you want to get an idea of what I actually looked like at the beginning and at the end, there are two short videos on my Two Year Anniversary post that tell the story well. The first video was taken when I started my journey, and it is very apparent how obese I was, and how difficult it was for me to walk and talk at the same time. The second clip was taken when I completed my journey and the difference is unmistakable.
After recovering from Covid, I began hiking, and posted this encouraging “mountain top experience” post as my 5-year update. That was the pinnacle of recovering my heath.
Except for the 19 pounds (my “Covid-19”) that I gained over the past 2 years, my weight has been stable. I continued to remain in partial remission of type 2 diabetes, and my blood pressure was normal until this past December. In retrospect, that is when my health began to change.
A Dietitian’s Journey – Part II
As told in last week’s post which was the first entry in Part II of A Dietitian’s Journey), things didn’t go as planned. Here is an excerpt from that post;
“Despite having had both vaccines (April 2021, July 2021), in March of 2022, I came down with what my doctor assumed was Covid again. At first, the symptoms were pretty much the same as in August 2020, muscle aches and joint pain, being exhausted, feeling cold all the time and my lips were frequently blue, but I did not have a headache. I was loaned an oximeter by a family member who is a nurse and I found it quite strange that my body temperature was always two degrees below normal even though I had fever-like symptoms of being cold and shivering. The muscle aches were significant, as was the fatigue, but since these are also symptoms of Covid, I didn’t think much of it. It was only when I began to develop symptoms that were not associated with Covid that I began to become concerned.”
When I saw my doctor last Friday, he thought that it was very likely I had hypothyroidism, but wanted to run some lab tests to rule out any other possibilities. I went to the lab last Monday morning, and my results came back late in the day. The ones I was waiting for showed exactly what both my doctor and I expected they would based on the supplements I had been taking prior to seeing him. What I didn’t expect was that my blood sugar would indicate that I was no longer in partial remission of type 2 diabetes. My blood pressure was higher than it had been in many years in his office, so I began taking it several times a day to see if it was “white coat syndrome” or genuinely high. Unfortunately, it was the latter. I knew what I had to do. I sent him a fax, reported my blood pressure readings, and asked if he thought it was warranted, that he call in a prescription for the same medication I was on 4 years ago.
Last week I did quite a bit of research in the literature to better understand how low thyroid hormones could contribute to my high blood sugar and high blood pressure — despite me continuing to eat a low carb diet. I wrote this referenced article on the blog of my long standing clinical practice about the metabolic changes that occur due to hypothyroidism. It is about how thyroid hormones act on every organ system in the body, and as a result when someone has hypothyroidism, there is a slowing of metabolism, which results in weight gain, high cholesterol, high blood sugar and high blood pressure. Now it was making sense.
I now understood how over a period of three months (March 5, 2022 – June 3,2022) I went from looking as I have the last 5 years to looking as I did 55 pounds heavier.
TOP: 8 photos showing weight loss over 2 YEARS (March 5, 2017- March 5, 2019) BOTTOM: Changes in my appearance over 5 MONTHS (March 5, 2022- Aug 8, 2022)
I knew one of the symptoms of hypothyroidism was “weight gain,” but I had no idea that it could occur over such a short time frame!
Two months ago at my youngest son’s wedding, I looked like I did when I was 55 pounds heavier!
As described in last week’s post, I was very sick but it was devastating to look like I did!
Today my appearance is almost back to normal. [August 24, 2022: see updated picture below]
Sometimes we have to look beyond what something looks like to the timeframe over which it occurred.
Following Up With my Doctor
Today I had my follow-up appointment with my doctor where we reviewed my lab test results from last week, and discussed next steps. My doctor requisitioned a free T4 test to see how my body is responding to the thyroid hormone treatment that he is overseeing. He also gave me a requisition for a Thyroid Peroxidase antibody (TPO) test to find out if I have Hashimoto’s disease or if my hypothyroidism is due to my past thyroid surgery for a benign tumour. This article from my long-standing dietetic practice explains what these are.
Since Hashimoto’s is an autoimmune disease, how I would choose to approach my diet if the results of that test are positive would be different than if it comes back negative.
I should have the results back tomorrow or Monday, but in the meantime, I am thinking about what I will do to recover my health once again, and how I will measure my success.
Once again, I am asking myself “what does success look like,” but this time it is in the context of this new diagnosis.
From what I have read, it is possible for my blood sugar and blood pressure to return to normal once the doctor adjusts my thyroid hormone replacement to its optimal dose, however for this goal to be “measurable” I need to have a better idea of how long this could take.
UPDATE (August 19, 2022)– terrific news! I do not have TPO antibodies AND my fT4 is almost half way through the normal range. According to an April 25, 2021 webinar given by Endocrinologist Dr. Theodore Freidman, MD, PhD titled “Updates on Treating Hypothyroidism”, it is normal and expected for fT4 to be slightly lower given the type of thyroid hormone replacement that my doctor is overseeing.
[Put in plain English, this means I am the best kind of sick and the amount of medication I am currently taking is pretty close to optimal.]
I would have thought that not having antibodies meant that I didn’t have Hashimoto’s, but rather another type of primary hypothyroidism due to my past thyroid surgery (which is still a possibility). I was wrong. Not all people with Hashimoto’s have measurable TPO antibodies!
It was previously thought that 5% of people diagnosed with Hashimoto’s thyroiditis have serum-negative thyroiditis, which is where they do not have measurable TPO antibodies (TPO-ab) and ~50% don’t have positive thyroglobulin (Tg-ab) antibodies, either [1]. People with serum-negative thyroiditis are diagnosed with Hashimoto’s based on clinical presentation, or by ultrasound appearance.
An updated study from 2020 indicates that the percentage of people Hashimoto’s with serum-negative thyroiditis is 20.8%, not 5% as previously thought. It is very encouraging that in subsequent follow-up only ~16% of those with SN-CAT eventually developed positive antibody tests for TPO-Ab and/or Tg-Ab [2].
In my opinion, in terms of a diagnosis of hypothyroidism, this is the best I could have hoped for. It is does not appear to be the autoimmune type (although Tg-ab antibodies weren’t tested, they are only positive in half of those with Hashimoto’s).
Based on this new study, there is a low likelihood of me going on to develop thyroid antibodies especially since I have no family history of autoimmune disorders!
I will take my time and read through the literature and then in light of these results determine what dietary changes I will make. Now that I know my fT4 is just about optimal, I will determine how I will measure success in terms of my restored health in the day’s ahead.
To your (and my!) good health!
Joy
References
Rotondi M et al. Serum negative autoimmune thyroiditis displays a milder clinical picture compared with classic Hashimoto’s thyroiditis. Eur J Endocrinol 2014;171:31-6. Epub April 17 2014
Croce, L., De Martinis, L., Pinto, S. et al. Compared with classic Hashimoto’s thyroiditis, chronic autoimmune serum-negative thyroiditis requires a lower substitution dose of L-thyroxine to correct hypothyroidism. J Endocrinol Invest 43, 1631–1636 (2020). https://doi.org/10.1007/s40618-020-01249-x
UPDATE (August 24, 2022) – It has been exactly 2 ½ months since my son’s wedding and 2 months since I began thyroid replacement medication and I am feeling quite a bit better about the image I see in the mirror. The change is more subtle this week, but I see less swelling in the cheeks. It will take a few more months for the less seen parts of my body to recover, but I am feeling hopeful.
LEGAL NOTICE: The contents of this blog, including text, images and cited statistics as well as all other material contained here (the ”content”) are for information purposes only. The content is not intended to be a substitute for professional advice, medical diagnosis and/or treatment and is not suitable for self-administration without the knowledge of your physician and regular monitoring by your physician. Do not disregard medical advice and always consult your physician with any questions you may have regarding a medical condition or before implementing anything you have read or heard in our content.
Three weeks ago, I wrote an article for my long-standing dietetic practice (BetterByDesign Nutrition Ltd.) about how a diagnosis of hypothyroidism is made and why it takes until someone has been unwell for quite a while before they are finally diagnosed. In one sense, that article laid the foundation for this one, and in another sense this article is the most recent update of my personal weight and health-recovery story (A Dietitian’s Journey).
DISCLAIMER: (August 14, 2022): This article a personal account posted under A Dietitian’s Journey. The information in this post should in no way be taken as a recommendation to self-diagnose, self-interpret diagnostic tests, or self-treat any suspected disorder. It is essential that people who suspect they may have symptoms of any condition consult with their doctor, as only a medical doctor can diagnose and treat.
Two years ago, in the summer of 2019, I was feeling fantastic and was in remission of type 2 diabetes and hypertension and was celebrating my “little black dress moment.”
In August 2020, I had what my doctor assumed was Covid (back pain, non-stop headache, and couldn’t stop shivering) and since at that point the line up for a nasal swab was 6 hours long due to one of the testing sites closing, my doctor recommended that I simply assume I was positive, and self-isolate for two weeks, which I did.
For many weeks afterwards, I had overall muscle pain and weakness, as well as tingling and numbness in my fingertips, what is referred to as “brain fog”, and unbelievable fatigue. I went from being reasonably active and fit in the spring, to finding it difficult to even walk up or down a flight of stairs by August. Covid was new at that point, so none of us knew what to expect, but it took months until I began to feel reasonably normal. I learned to live with the muscle aches, joint pain, ‘brain fog’, and fatigue. The joint pain persisted for a long time, and was assumed to be post-viral arthritis as I had this once before when I had rubella as an adult.
Despite having had both vaccines (April 2021, July 2021), in March of 2022, I came down with what my doctor assumed was Covid again. At first, the symptoms were pretty much the same as in August 2020, muscle aches and joint pain, being exhausted, feeling cold all the time and my lips were frequently blue, but I did not have a headache. I was loaned an oximeter by a family member who is a nurse and I found it quite strange that my body temperature was always two degrees below normal even though I had fever-like symptoms of being cold and shivering. The muscle aches were significant, as was the fatigue, but since these are also symptoms of Covid, I didn’t think much of it. It was only when I began to develop symptoms that were not associated with Covid that I began to become concerned. One of those symptoms was non-pitting edema in my lower legs and feet, and I don’t mean just a little bit of swelling. Below is a picture of before, and during;
I ordered compression stockings on-line and wore them daily to help keep the swelling down, but carried on working and writing the book, even though I was very tired all the time. I also began to have a very weird sensation in my mouth – my tongue became enlarged, and the salivary glands under my tongue were swollen. Since both of these affected my sense of taste, I thought this may be related to Covid, but then it progressed to the point where I found it difficult to talk properly because my tongue seemed too big for my mouth. I also began losing hair, but this had occurred several years ago, too. At the time, my TSH was “in the normal range”, so no further testing was done (see this article to know why TSH alone is not good indicator of hypothyroidism, especially when it is at the high end of the normal range, which mine was). In retrospect, the subclinical problem with my thyroid has been going on quite a while. Sometimes it would be worse than others, which is not unusual.
Fast forward to two months ago (beginning of June), which was my youngest son’s wedding. I was still experiencing fatigue and muscle aches, chills that would come and go, would get bluish lips, and continued to have significant (non-pitting) edema in my legs and ankles, and was wearing compression stockings all the time — even at the wedding. The skin on my cheeks had become flaky and dry and despite trying multiple types of intense moisturizers, nothing helped. My mouth symptoms had progressed to the point that I found it difficult to say certain words when speaking with my clients because my tongue seemed too large for my mouth, and the salivary glands underneath my tongue were swollen. I continued to have overall muscle aches and weakness, but it had slowly progressed to the point where it was difficult for me to get up from a chair, or to get out of my car without pushing myself up with my hands. I was wondering if I had some form of “long-Covid,” but what got me starting to think that my symptoms had something to do with my thyroid was the very noticeable swelling in my face. At my son’s wedding I looked like I did when I was 55 pounds heavier, but without significant weight gain.
After doing some reading in the scientific literature, as well as chatting with a couple of functional medicine doctors, I began to think that my symptoms were consistent with hypothyroidism. In addition, I knew that when I was in my early 20s I had a benign tumour removed from the isthmus of my thyroid and as part of the pre-surgery work up, I had an x-ray that required me to drink radioactive iodine. It wasn’t known at the time but it is known now that both the surgery on the thyroid (even though it remains largely intact), as well as the exposure to high doses of radioactive iodine can initiate a process that can lead to hypothyroidism years later.
It is also apparently possible that having had Covid back in 2020 may have initiated it and/or it may have been initiated as a response to the having the vaccines. I am not blaming either the virus or the vaccines because my thyroid surgery and exposure to high doses of radioactive iodine predated this by decades, but they may have been the precipitating event to symptoms. It is also possible that symptoms would have started on their own simply as a result of age.
I knew I was unwell and needed to see my doctor in person. After my son’s wedding, I called his office and wanted to go in and have him assess me for hypothyroidism, but he was out of town. Instead of meeting with the locum, I decided to wait until he was back. In the meantime I began using some supplements that are involved in thyroid metabolism, such as kept (for iodine), selenium and some other nutrients and while they helped a little bit, it was not significant. After doing a great deal of reading in the literature and listening to several medical presentations by a well-known endocrinologist and professor of medicine from the US, I decided while waiting to see my doctor that I would try using a very small amounts of another type of supplement to see if it made any difference in my symptoms. I introduced it at half the rate and half of the dose usually used because (1) I had not yet seen my doctor (was not under medical supervision yet) and (2) I was aware that use of this supplement was not something to be taken lightly as it can cause problems for older individuals, or those with heart disease (which I don’t have).
This morning I saw my doctor for the first time since Covid began. I had sent him a fax last week outlining the ways I had improved because I knew it was too much information for a 10 minute visit. I explained that I was feeling significantly better. My face swelling had gone down a great deal, the edema in my legs had almost disappeared – to the point that I could walk around bare-legged in the excessive heat we had last week with NO swelling what-so-ever. The skin on my legs is still very tight and shiny, but no edema. I lost 5-6 pounds of water-weight (face, legs and abdomen) and most noticeable, the muscle weakness is gone! I could walk up and downstairs, carry heavy parcels, and can get up from a chair or out of my car with ease. I also explained in the fax that I rarely feel cold, but still have occasional blue lips and chills late in the afternoon, but that from what I’ve read in the literature, many people do better on the same amount split over 3 doses, rather than two.
When my doctor entered the examining room, he said he had just re-read the fax and based on what I wrote, he thinks it is very likely that I have hypothyroidism, but he wants to rule out other things that could look like it and aren’t, or that mimic it. He wasn’t in a rush, like he usually is. He looked at the pictures I had on my phone —ones I had taken of my legs, my tongue, my face. When he saw the picture of me two months ago at my youngest son’s wedding, he simply said “oh my.” He then gave me a very thorough examination. He palpitated my thyroid and listened for a long time to my heart and lungs. After examining me, he pointed out several other physical symptoms that I have that are quite consistent with hypothyroidism, and said “Joy, I think your conclusion is right on.” I was somewhere between shocked and elated.
My doctor then brought up my past lab work on his screen and remarked that my TSH has been “high normal” since 2013 (see below), and that I often had low ferritin with no explanation, as well as past “unexplained” issues with hair loss. I had nine years with subclinical symptoms but no testing could be done because as indicated on the lab test results below “The free T4 was cancelled. The protocol recommends no further testing.“
TSH – 2013 – “in normal range”TSG – 2015 – “in normal range”
I mentioned to him that I wondered what the results would have shown if my T3 or T4 were tested in 2013, or 2015, when my TSH was high-normal. He replied “unfortunately, unless someone has clear symptoms that are consistent with hypothyroidism there is nothing we can do, but your symptoms are very consistent now, but I think this diagnosis was a long time coming.” Surprisingly, we saw eye to eye.
I think my doctor realized that the guidelines being as they are means that people like me have to get quite unwell before they are finally diagnosed and treated. I realized that his hands were effectively tied by a system that will not enable him to test T3 or T4 even with high-normal TSH, without overt symptoms. He could do nothing until I got much sicker.
I was delighted by his response. He has been my doctor for 20 years and was not receptive to my use of a low carb and then a ketogenic diet to put my type 2 diabetes into remission, and previously refused twice to test my fasting insulin, along with my fasting blood glucose. Today he was very different.
When I asked if he was going to refer me back to the endocrinologist I used to see when I was diabetic and have her manage my thyroid replacement medication and he said “No. I don’t believe in changing something that is clearly working. I want you to keep taking what you’re taking in the same amount you are now, and I am going to run some lab work to see if you have gotten the amount right. We may need to increase it a little or change the timing to address the late afternoon chills, but no, I’m not going to “fix” something that is no longer broken.” He even agreed to add a fasting insulin test, without any protest!
I don’t know what happened to make my doctor change his mind and how he approaches these types of matters, but today I said to him that it has been a long time since I was this delighted with his approach, and that I am very thankful that he is my doctor because he practices good medicine. I offered him my hand and he shook it warmly and thanked me.
I guess if I can change how I practice dietetics based on new evidence, so can my doctor — or your doctor. Don’t give up, or be hesitant to have those difficult conversations with your primary care physician. We need them to oversee our care, and maybe just maybe in the process of interacting with some patients, they learn something they didn’t before, or change because of things they see in their practice. The bottom line was that I needed my doctor to know what I was doing and to examine me and make sure I was not doing something that could cause me harm. He not only rose to the occasion with grace, but responded in a manner I could have only dreamt of before.
I do not believe that self-treating is ever advisable, and certainly if it were not for Covid and my doctor not having in-person office hours unless it was an emergency, I would have gone to see him months ago. I am glad I saw him today and am very thankful that he is being so supportive.
I know once we get the levels of thyroid hormones right, that losing the 20 pounds I gained over the pandemic will be possible, but in the meantime, it is no small matter that I got my life back!!
A Dietitian’s Journey continues…
To your good health,
Joy
I don’t post the comparison picture below easily. It is very hard for me to see how bad I looked, but it is important to see just like the leg pictures, above. The photo on the right was taken at my youngest son’s wedding, June 3, 2022 (exactly 2 months ago) at the height of my hypothyroid symptoms. The photo on the left is a selfie I took today, August 5, 2022, almost exactly two months later. There is still swelling in my face and legs to come down, but any adjustment in thyroid meds only be done after the upcoming lab work.
LEFT: August 5, 2022, RIGHT: July 3, 2022 (2 months apart)
NOTE (August 15, 2022): It is important to keep in mind that too little, or too much thyroid hormone can have serious consequences.
Untreated or under-treated hypothyroidism can be serious and is when the body gets too little thyroid hormone. This can lead to a myxedema crisis (covered in this article).
Thyrotoxicosis can also be serious and is when the body gets too much thyroid hormone. This can occur in untreated hyperthyroidism, or by self-treating hypothyroidism (covered in this article).
If you suspect you may have hypothyroidism (or any other clinical condition), consult with your doctor, and “don’t try this at home.”
LEGAL NOTICE: The contents of this blog, including text, images and cited statistics as well as all other material contained here (the ”content”) are for information purposes only. The content is not intended to be a substitute for professional advice, medical diagnosis and/or treatment and is not suitable for self-administration without the knowledge of your physician and regular monitoring by your physician. Do not disregard medical advice and always consult your physician with any questions you may have regarding a medical condition or before implementing anything you have read or heard in our content.
Finally, there are low-carb breads made without nut flour, cheese, or beaten egg whites, and that contains no psyllium, chia seed, xanthan gum, guar gum, or inulin which cause many people digestive issues. These are “real breads that happen to be low carb.”
Click on the green button below to get a FREE 27-page booklet that explains the essentials about this new category of homemade low-carb breads and includes the “game changer” that led to the development of the others.
FREE 27-PAGE DOWNLOAD
This 27-page FREE DOWNLOAD includes the
“game changer” recipe
that led to the development
of all the other recipes.
Click on the free download button to get yours.
Looking for something shorter that you can print out?
FREE 1-PAGE DOWNLOAD
Click on the purple button below to get a FREE 1-page printable download about this new category of low carb breads that are made with NO nut flours, psyllium, chia seed, xanthan or guar gum, or inulin.
I never planned to write a low carb bread book, but it came about due to both interest and need. Beginning in September 2021, I began to experiment with low carb breads that were not made from nut flour. By mid-December I was finally successful and posted the recipe for Low Carb High Protein Yeast Bread, and this bread turned out to be a “game changer”. It was what I called “real bread that happens to be low carb.” But, most impressive were the macros! Each slice of Low Carb High Protein Yeast Bread had only 1.6g net carbs and 11.4 g protein. I knew I was onto something.
The ingredient that made this first ‘real bread’ possible was vital wheat gluten, which is not wheat flour but one of several types of wheat protein isolate. Wheat protein isolate is to wheat, what whey protein isolate is to dairy, and both are proteins that have been used in food production and as a protein supplement. This ingredient gives bread its distinct “pully” texture and makes bread different from cake or pastry. Discovering this and other low-carb ingredients resulted in me re-visiting my old hobby of bread baking – something I did over the previous 35 years before adopting a low carb diet in March 2017.
After posting the recipe for Low Carb High Protein Yeast Bread in mid-December 2021, I began to have people contact me on social media to request that I bake the breads and ship them to them. One person wanted me to courier them several loaves, and I had to explain that I am a Dietitian in full-time private practice and had no time to bake bread as a sideline. A few people tried to convince me to open a low-carb bakery (which I also had no interest in), and then some said I should write a cookbook featuring recipes for these low-carb bread. I mentioned this to one of my young adult sons, who thought I should consider the idea. Without really thinking it through, I created a Twitter poll asking who would be interested in such a book and then asked the same question on Facebook and Instagram. The responses were overwhelmingly in favor, so the following morning, I looked at my young adult son and said, “it looks like I am writing a low-carb bread book.”
And so, it began…
The recipes in this book form a completely different category of low-carb bread. They contain no nut or seed flour, and while cheese and egg may be included as ingredients in a recipe, they do not form the basis of the bread. In addition, these bread contain no psyllium, chia seed, xanthan gum, guar gum, or inulin, as these ingredients often cause digestive issues. As a result, Low Carb Breads of the World may remove unnecessary barriers that people currently have to adopt a low-carb lifestyle. This book makes culturally appropriate and ingredient-appropriate bread available to people from bread-centric cultures with high rates of type 2 diabetes, including Southeast Asian and Hispanic.
Low Carb Breads of the World is more than a cookbook or a collection of recipes. It introduces novel ingredients for baking low-carb bread and explains how to use them successfully in different types of recipes. The recipes provide an opportunity to utilize the ingredients and the methods to produce a variety of breads of the world. These recipes are not perfect replicas of the high-carb originals but are as close as I was able to get them using readily available low-carb ingredients with minimal allergens or ingredients that cause digestive issues.
I hope that people from a wide range of backgrounds will apply the information in my book to create low-carb versions of bread central to their cultures, thereby making a low-carb diet accessible to those who would not have otherwise considered it.
While I never set out to write a low-carb bread book, I realize that this book will do what I do in my private practice: help people pursue a healthier lifestyle.
You can click on the “free download” button below to get a FREE 27-page booklet that explains the essentials about this new category of homemade low-carb breads and includes the “game changer” that led to the development of the others.
To your good health!
Joy Y. Kiddie MSc, RD
FREE DOWNLOAD
Includes the “game changer” recipe that led to the development of all the others.
Click on the free download button below to get your FREE 27-page booklet with recipe.
I have been supporting people in following a low‐carb and keto lifestyle for the past five years, but until recently, I was not in favor of low‐carb bread. The reason was that there were only a few low‐carb or keto bread options, and each had its drawbacks.
Most low‐carb bread is made from nut flours such as almond flour and coconut
flour, with or without adding different types of cheese (such as so‐called
“fathead” pizza).
While these breads work well for some people, the extra energy intake provided by the nuts and cheese often made weight loss more difficult, especially for peri and post‐menopausal women.
While bread made from whipped egg white provides a high protein, low‐fat, low carb bread option, the texture of this protein‐sparing bread is often disliked.
The lack of acceptable low‐carb bread options posed a problem for me as a Dietitian. While some people are fine using lettuce to wrap a burger in, lettuce wraps do not address the needs of people from bread‐centric cultures. People of South Asian (Indian) descent have approximately 6x higher rates of type 2 diabetes than the general population and I came to realize that it was essential
for them to have culturally appropriate low‐carb bread such as chapati/roti,
paratha, and naan.
With rates of type 2 diabetes being almost double in the Hispanic population, low‐carb corn‐style and flour‐style tortillas were also important. While these could be made using nut flours and gums such as xanthan gum, guar gum, or psyllium to make them flexible, these ingredients often cause digestive issues.
In addition to people’s cultural needs, there was also the fact that many people have nut allergies which makes most low‐carb bread options made with almond flour unavailable. A similar issue exists for those allergic to eggs ‐‐ making egg white‐based bread such as ‘cloud bread’ or protein‐sparing bread unavailable as low‐carb options.
In late October 2021, I saw a protein bread imported from Germany that was like the classic Vollkornbrot bread but made from some unique ingredients.
This bread had more than three times the protein of this company’s whole‐meal rye bread and more than 80% fewer carbohydrates, so I bought it to try. It was heavy and dense and tasted good, but at almost 50 cents per slice, I thought, “this can’t be that hard to make.”
I ordered some of the ingredients online and began experimenting with making low carbohydrate, yeast‐risen, high‐protein bread that contained no beaten egg white, no nut flours, and no cheese. It took quite a few attempts until I made a successful bread, but I persisted, and on December 14, 2021, I posted the recipe for Low Carb High Protein Yeast Bread. This bread turned out to be a “gamechanger.” It was “real bread that happened to be low carb.”
Most impressive were the macros! Each slice of Low Carb High Protein Yeast
Bread had only 1.6 g net carbs and 11.4 g protein.
Even with ordering all the ingredients online from Canada, compared to commercial Carbonaught® Multigrain Bread that weighed the same (544 g), it cost 35% less.
Most ingredients are available in regular supermarkets in the US, and no matter where in the world people live, like me, they could order these ingredients online and bake these low‐carb bread themselves. I knew I was onto something.
The ingredient that made this first ‘real bread’ possible was ‘vital wheat gluten,’ which is not wheat flour but one of several types of wheat protein isolate. Wheat protein isolate is to wheat, what whey protein isolate is to dairy, and both are proteins that have been used in food production and as a protein supplement. I later found out that there are several different types of wheat isolates. Vital wheat gluten is a protein isolate of gliadin and glutenin separated from the wheat starch (where all the carbs are) and other grain components. Gliadin and glutenin give bread its distinct “pully” texture and make bread different from cake or pastry. Just as adding vital wheat gluten gives bread its characteristic texture, the inclusion of whey protein gives low carb bread its crisp, brown crust.
Discovering these low‐carb ingredients resulted in me re‐visiting my old hobby of bread baking – something I did over the previous 35 years before adopting a low carb diet in March 2017. Most of my low‐carb breads began as recipes for regular high‐carb bread that are hand‐written on recipe cards and fill one of the multiple recipe boxes.
It was vital wheat gluten that made other breads possible – from crusty sandwich loaves, brioche, buns and rolls to culturally acceptable low‐carb versions of chapati/roti, paratha, naan, and corn‐style and flour‐style tortillas.
As Dietitian it was finally possible to offer those from a South Asian or Hispanic background culturally appropriate low‐carb breads they could make at home, enabling them to adopt a low‐carb diet to help improve their health. In addition, these ingredients meant that those with nut allergies could have low‐carb bread without having to resort to egg‐white bread and since many of these breads do not contain eggs, there are low‐carb bread alternatives for those with egg allergies.
After posting photos of some of these early breads on social media, people kept asking me for the recipes. Some wanted to commission me to make these breads and courier them to them regularly, but I am a Dietitian in full‐time clinical practice with no desire to open a baking business. When someone suggested I write a book, I was initially resistant to the idea; however, it was evident that there was both an interest and a need.
In January 2021, I decided to write Low Carb Breads of the World because it provided a much‐needed dietary option to many people. The breads contain no nut flours. They have no psyllium, xanthan gum, guar gum, or inulin, as these ingredients cause many people digestive issues, and many of the breads in the book are made without eggs or dairy. These breads are not perfect replicas of the original but are as close as possible using low‐carb ingredients that are readily available and with minimal priority allergens. They are real breads that happen to be low carb.
Low Carb Breads of the World is not just a cookbook or a collection of recipes. Instead, it introduces low‐carb ingredients and explains how to use them for baking several different types of low‐carb bread. The recipes in the book provide an opportunity to utilize the ingredients and the methods to produce a variety of breads of the world. By understanding the science behind using these ingredients, people will begin to be able to adapt their traditional bread recipes to be low carb, and that is ultimately the goal of the book.
Like the expression “give a man a fish, you feed him for a day, teach a many to
fish, you feed him for a lifetime,” this book is intended to teach people what is
needed so they can apply that knowledge to make the breads they grew up on
and love, low carb.
For those who can eat and enjoy nut‐flour and egg‐based low carb bread, these are an excellent option, but for those for whom they are not suitable, there is another choice.
To your good health!
Joy
Joy Kiddie is a Registered Dietitian with a master’s degree in human nutrition from the University of British Columbia (Canada). She has been providing low‐carb and keto services since 2015 through her long‐standing dietetic practice BetterByDesign Nutrition (www.bbdnutrition.com) and since 2017 has been supporting people through her dedicated low‐carb division, The Low Carb Healthy Fat Dietitian (www.lchf‐rd.com). Joy helps people reduce their hunger and food cravings to achieve their weight loss goals and improve their metabolic health. She is also the author of the upcoming book, Low Carb Breads of the World.
The American Diabetes Association (ADA) has released a 28-page guide for Health Care providers on implementing low-carbohydrate (LC) and very low-carbohydrate (VLC) eating patterns to improve outcomes in adults with type 2 diabetes. The purpose of the Guide is to assist Health Care Providers, including Physicians, Registered Dietitians, certified diabetes care & education specialists (CDCES), and others, to assess whether these interventions would be appropriate for their patients and if so, how to best implement them.
The Guide is authored by Kelly Siverhus MS, RD, CD, and several advisors. These include three American Diabetes Association Dietitians, five expert advisors including 4 Registered Dietitians and an MD, and a Registered Dietitian primary advisor from Diabetes and Nutrition Consultants. One of the four expert Advisors was Dawn Noe, RD, LD, CDCES, who gave a presentation on Person-Centered Implementation of Low Carbohydrate Eating Plans at the American Association of Diabetes Educators (AADEs) annual conference in Houston, Texas, in August 2019. She graciously shared her slides with me for this article.
This new Guide is the culmination of several American Diabetes Association position statements, a consensus report, and several Standards of Medical Care in Diabetes (2019, 2020) publications which included the use of both a low carbohydrate and very low carbohydrate (ketogenic) diet.
April 2019 Consensus Report on Diabetes and Pre-Diabetes that included both the use of a low carbohydrate eating pattern (26-45% of total daily calories as carbohydrate), as well as the use of a very low carbohydrate (ketogenic) eating pattern (20-50 g carbs per day).
2019 and 2020, the ADA included the use of a low carbohydrate and very low carbohydrate (ketogenic) diet in their Standards of Medical Care in Diabetes.
Low Carbohydrate and Very Low Carbohydrate Eating Patterns in Adults with Diabetes: A Guide for Health Care Providers
This 28-page guide includes information on
Potential Benefits
Indications and Contraindications
Determining and Reassessing a Carbohydrate Goal
Tools and Strategies for Eating Pattern Education, including what to emphasize
A 10-page section (pages 16-26) with Resources for Patient Education, including
Food Lists for Low Carbohydrate Meal Planning
Getting Started
Low Carbohydrate Starch Alternatives
Low Carbohydrate Plate Method
Sample Meal Plans (Structured)
Sample Meal Plans (Build your Own)
References
The Guide is an excellent resource for Health Care Providers to help them assess the appropriateness of a low-carbohydrate (LC) or very-low-carbohydrate (VLC) diet for any given patient and provides good explanations of the different approaches that can be taken. In addition, the 10-page Resources for Patient Education provide strategies and sample meal plans for implementing a low carb or very low carb eating pattern, along with the necessary details to assist a wide range of Health Care Providers in supporting their patients in adopting a low carbohydrate or very low carbohydrate diet.
This Guide can be ordered directly from the ADA online shop for $8.95 USD.
Final Thoughts…
While nothing is “new” in this Guide, it is an excellent synthesis of information already contained in the American Diabetes Association’s 2018 Position Statements, 2019 Consensus Report, and Standards of Medical Care in Diabetes (2019, 2020). The Guide provides a convenient, evidence-based tool for US-based Health Care providers to use with their patients.
It is my sincere hope that Diabetes Canada might make something like this available for use by Canadian-based Health Care providers, including Physicians, Registered Dietitians, and certified diabetes care & education specialists.
More Info?
If you would like more information about how I can support you following a low carbohydrate of very low carbohydrate diet, please have a look under the Services tab, or send me a note through the Contact Me form.
LEGAL NOTICE: The contents of this blog, including text, images and cited statistics as well as all other material contained here (the ”content”) are for information purposes only. The content is not intended to be a substitute for professional advice, medical diagnosis and/or treatment and is not suitable for self-administration without the knowledge of your physician and regular monitoring by your physician. Do not disregard medical advice and always consult your physician with any questions you may have regarding a medical condition or before implementing anything you have read or heard in our content.
Tomorrow is March 5th and it is five years since I began my personal health and weight recovery journey that I’ve dubbed “A Dietitian’s Journey“. While it began in 2017, in a way it still continues today and that is the point behind this post.
March 2017
Five years ago, I was obese, had type 2 diabetes for the previous 8 years, and had developed dangerously high blood pressure.
This picture is what I looked like then. There is no mistaking that I was a very sick woman.
You can hear it in my voice in the video below. It is very apparent that I could barely walk and talk at the same time.
A year after I had adopted a low carbohydrate lifestyle (March 5, 2018), I had lost:
32 pounds
8 inches off my waist
2 inches off my chest
3 inches off my neck
1 inch off my arms
1/2 inch off my thighs
no longer meet the criteria for type 2 diabetes (achieved without the use of medication)
had blood pressure that ranges between normal and pre-hypertension without medication
had ideal triglycerides and excellent cholesterol levels achieved without any medication.
April 2017 – April 2019
Two years after beginning my journey I had lost a total of;
55 pounds
12- 1/2 inches off my waist
3 -1/2 inches off my chest
6 -1/2 inches off my neck
4 inches off each arm
2- 1/2 inches off each thigh
met the criteria for partial remission of type 2 diabetes
blood pressure still ranged between normal and pre-hypertension
had ideal triglycerides and excellent cholesterol levels
March 2020
On the third anniversary of beginning my journey, March 5, 2020, I remained at a normal body weight, had an optimal waist circumference (slightly less than half my height), and was still in remission of type two diabetes and high blood pressure.
I had gone from taking 12 different medications three years earlier, to being on one prescription for something non-metabolically related. I felt so good — so happy in my own skin that decided to stop straightening my hair, and began wearing it the way it grows out of my head.
March 5 2021 was 4 years from when I began my journey. Here is a short clip from a podcast I was on around that time. Listen to how different I sounded from the clip above.
Then I took up hiking!
Four years earlier, I could barely walk and talk at the same time and for six months, I was hiking every week, or two.
This photo was taken last year on March 6, 2021 — the 4th anniversary of beginning my journey.
But like most journeys, this one has had ups and downs. There have been “mountain top experiences,” and “valleys,” and currently I am in a bit of a valley.
About two months ago, I was exposed to the Delta variant of Covid and while I didn’t get more than cold-like symptoms, once again my body responded to the exposure with post viral arthritis that I have had a twice since my late 20s. The first time was after I contracted rubella as a young adult, and the second time was after having what was presumed to be Covid in August 2020 (covered in previous posts). Despite the overall joint pain, I was not going to let it get me down. I kept pushing myself — working on developing recipes for my upcoming book, Low Carb Breads of the World.
The joint pain has eased up quite a bit over the past few weeks, but there remained increasing discomfort at the base of my thumb on my right hand that kept getting worse. Last week it became unbearable. I assumed that I had developed arthritis in the CMC joint of my thumb, but I found out this week that it is DeQuervain’s tenosynovitis that developed from the repetitive motion of kneading bread several times a week for long periods of time. This was an unfortunate by-product of working on recipe development for the low carb bread book.
Out of necessity, many of the things I was actively doing suddenly came to a halt. For the next 4-6 weeks I have to wear a brace 24-hour per daythat splints my thumb and wrist, and enables it to heal. It is discouraging, but there isn’t much I can do about it. I apply ice, do my physio, wear the brace and focus on looking ahead.
In a way, tomorrow being the 5th anniversary of my journey encourages me.
While not the “mountain top experience” of a year ago, even in this temporary “valley”, things are SO much better than they were 5 years ago.
While I haven’t managed to lose all the 20 pounds I had put on during Covid as I had planned to do, I also haven’t regained my weight, either. My blood sugars are still good, and so is my blood pressure and that is something I am very thankful for, and to celebrate.
Despite the ups and downs, I am still moving forward. I continue to eat low carb and have no desire to eat any other way. I am metabolically healthy and that is a lot to be thankful for.
While we all go through ups and downs, it is what we do day-to-day that really counts towards putting diseases like type 2 diabetes and hypertension into remission.
People ask me why I “still” eat this way and the answer is easy. If I go back to eating the way I did before, I will become “fat and sick” like I was before, too! No, thanks.
For me, there is no looking back — only forward. From the mountains to the valleys, I choose to remain low carb for my ongoing health.
LEGAL NOTICE: The contents of this blog, including text, images and cited statistics as well as all other material contained here (the ”content”) are for information purposes only. The content is not intended to be a substitute for professional advice, medical diagnosis and/or treatment and is not suitable for self-administration without the knowledge of your physician and regular monitoring by your physician. Do not disregard medical advice and always consult your physician with any questions you may have regarding a medical condition or before implementing anything you have read or heard in our content.
With the new Covid-19 variant now in circulation, widespread flooding in the Pacific Northwest and out East, and the resulting supply shortages in many areas affecting food prices, many people feel overwhelmed. I find that I do best in these situations when I embrace that which is unchangeable, while focusing on changing the things that I can.
I think that circumstances are more about how we look at them and respond, than about the situations themselves, and our reaction to the weather around us exemplifies this.
Viktor Frankl was an Austrian neurologist, psychiatrist and Holocaust survivor who said that there is a ‘space’ between a stimulus (or an event) and our response, and in that space we have the power to choose our response. This includes our reaction to a new strain of Covid, environmental events such as the weather, and the condition of our own health.
”Between stimulus and response there is a space. In that space is our power to choose our response.” ~Viktor Frankl
When I woke up to the snow this morning, I decided to embrace the unchangeable, and this short video touches on that.
We have the power to choose how we are going to respond in any situation, and this includes everything from the weather, to our own health. We can choose to change the things that we can, while embracing the unchangeable.
When I set out to restore my health four years ago, that’s exactly what I did. Maintaining it simply takes making those same choices, daily. It really does come down to recognizing that there is a space between the circumstances and our response, where we have the power to choose.
LEGAL NOTICE: The contents of this blog, including text, images and cited statistics as well as all other material contained here (the ”content”) are for information purposes only. The content is not intended to be a substitute for professional advice, medical diagnosis and/or treatment and is not suitable for self-administration without the knowledge of your physician and regular monitoring by your physician. Do not disregard medical advice and always consult your physician with any questions you may have regarding a medical condition or before implementing anything you have read or heard in our content.
INTRODUCTION: Not everyone who eats a “low carb” diet can afford to keep buying meat at the today’s current crazy prices. This article looks at options on the basis of protein to energy, in calories (kcals). Yes, it contains some ‘unconventional’ protein sources, but ones that can still fit within a low carb diet. It provides people with options who may not have a choice.
Meat prices have gone crazy and many people are wondering how to eat well on a budget. Steaks and chops are familiar, but they aren’t the only source of protein — or even the best sources.
A rib steak is only 60% protein but skipjack tuna is 92% protein — which is substantially more, and costs a great deal less. Skinless turkey breast is 86% protein and skinless chicken breast is 75% protein— both higher than a rib steak and both considerably less expensive. While medium-lean ground beef (80% lean) is inexpensive it only has 41% protein, and canned pink salmon, beef- or chicken liver, canned mackerel and sardines all have more protein in them than that!
Note: In this article, protein to energy ratio (P:E in kcals) is protein in calories (kcals) compared to the total amount of calories in one ounce (28g) of the food. This is different than the Ted Naiman’s “P:E ratio“, where energy is “non-fiber carbohydrate + fat”. In this calculation the energy provided by protein is not counted, however not all protein is used for muscle accretion, but in a high protein diet, excess protein is burnt for energy, or stored as fat.
Below are some examples of relatively low-cost animal source foods, sorted from the highest amount of protein to the lowest and as animal products, these are all complete proteins — having all 9 essential amino acids.
Highest protein animal source foods, from highest to lowest
But what to make out of canned pink salmon? “Salmon patties” were a staple in my home growing up. They are made from drained canned pink salmon, mixed with a little chopped celery, minced green onion and egg to bind them (my mom would add breadcrumbs but I omit them and they come out fine!). They are formed into patties and either fried in a bit of fat or cooked in a non-stick skillet. They are an excellent source of highly bioavailable protein, a good source of omega 3 fatty acids, and are inexpensive and delicious! They can be served with homemade cabbage salad (Cole slaw), or a side of cooked vegetables…and yes, frozen vegetables are just as nutritious as fresh, and much less expensive.
Canned tuna is delicious mixed up with a bit of mayonnaise, with or without some minced celery and of course is terrific added to casseroles that for those not following a low carb diet, are made with pasta. I find that chunks of lightly cooked cauliflower stands in well for noodles and these casseroles can be a complete meal with the addition of a few handfuls of fresh or frozen vegetables. They are also wonderful with a sprinkle of grated cheese on top. Tuna is a great source of protein as well as omega 3 fat, and is often on sale. Buying a few cans to have on hand makes it easy to reach for at the end of a long day.
Some people don’t like liver because their only experience with it is something akin to shoe leather, but when it is bought fresh and cooked on a barbeque (or broiled in the oven) until “just cooked”, it is delicious. Chicken liver can be cooked that way too, but is also delicious pan fried with onion, mushroom and peppers, or made into a pí¢té.
Spinach soufflé
Eggs can provide the protein in a spinach soufflé which is delicious with or without some grated parmesan or swiss cheese. Adding extra egg white makes it even higher in protein, and makes for an even better soufflé!
shakshuka
Eggs can stand on their own served as shakshuka as the main dish for dinner. A cucumber and tomato salad makes a delicious side dish and all together, this is a very affordable and tasty meal!
What about some non-animal sources ?
Non-Animal Source of Protein
Ma-Po tofu
Tofu is very versatile and to many people’s surprise, contains all 9 essential amino acids. It comes in so many forms — from firm blocks, to silky and custard-like, and can be cooked into so many wonderful dishes. If you haven’t tried Chinese Ma-Po tofu, you are missing something! It has a delicious sauce made from garlic, green onions and brown bean sauce (and for non-vegetarians includes a small amount of ground meat), and is simply just delicious! Serve it with stir fried broccoli or bok choi and garlic.
fish without bones
Firm tofu, cut in small rectangles, dipped in egg and pan fried with some ginger and green onion and finished by steaming with a bit of broth is just delicious! The Chinese fondly refer to tofu as “meat without bones” and I call the egg dipped fried with green onion and ginger, as “fish without bones” (because this is often the way the Cantonese prepare fish).
Highest protein non-animal source foods, from highest to lowest
While many people who eat low carb think that legumes such as lentils and chickpeas are “off limits”, 1/2 cup of legumes contain approximately the same amount of carbs as 1/2 cup of yam or squash, but comes with an added bonus of 7g of protein. For those that are concerned about anti-nutrients in pulses, these are reduced with soaking and cooking, and not using the soaking water for cooking them reduces most of the gas that people think of when they think of pulses.
[Note: November 7, 2021 – Best to not purée cooked legumes, as they will raise blood sugar more than if left intact.]
Animal proteins are complete proteins which means they contain all 9 essential amino acids. While lentils and other pulses have a good protein to energy (kcals) ratio, it is important to note that they are missing amino acids. That is why they are considered “incomplete proteins”. For example, lentils are missing the sulfur-containing amino acids methionine and cysteine, and pinto beans are missing methionine and tryptophan. Since pulses are missing amino acids, it is important for those who are vegetarian to be sure to eat other foods during the day that contain the missing amino acids. It used to be believed they had to be eaten at the same meals, but that is not necessary.
Protein in Some Nuts, Seeds and Grains
Highest protein per kcal foods, from highest to lowest (nuts, seeds and grains)
Nuts and seeds also provide some protein, but are easy to over-eat. Nuts are high in fat and like hard cheese can stall weight loss, if over eaten. Same with nut butters like peanut butter or tahini which is made from ground sesame seeds. It is helpful to think of these as fat sources that have some protein, rather than protein sources. It is best to use them as a decoration to make other foods like salad taste good, rather than as a protein source.
Cottage Cheese – a surprising low carb high protein staple
Have a look at the protein to energy (kcal) ratio of pressed cottage cheese (see photo) in the table, below. Ounce for ounce, pressed cottage cheese provides way more protein than steak, or ground beef, and even more than turkey or chicken breast! Who would have thought? Once the bane of calorie counter’s existence, cottage cheese is an excellent protein source for those following a low carb diet, even high than eggs!
Low carb diets — especially the high fat ones always seem to highlight eggs, but eggs are only 33% protein (see table, above) whereas pressed cottage cheese is 84% protein, Greek yogurt is 74% protein, and creamed cottage cheese is 51% protein!
Highest protein per kcal foods, from highest to lowest (dairy source, with eggs)
Different Types of Cottage Cheese Compared [Added November 8, 2021)
I decided to add this clarification to explain the different types of cottage cheese.
“Pressed cottage cheese” is sometimes called baker’s cottage cheese, or “Farmer’s cheese”.
“Dry cottage cheese” is just the curd that is used for making “creamed cottage cheese”, but without the liquid. In years gone cream was added to the dry curd to make “creamed cottage cheese” hence the name — but now it is a mixture of milk with various gums, such as carrageenan, guar gum and xanthan gum.
As can be seen from the table below, these have very different amounts of protein per ounce.
Difference between dry cottage cheese, pressed cottage cheese and regular (creamed) cottage cheese
But how does one eat pressed cottage cheese? It can be mixed with egg, herbs such as parsley and green onion, formed into patties and fried like the salmon patties mentioned above, or mixed with egg and/or spinach and used as a filling for lasagne or manicotti.
chicken noodle lasagne
Seriously, low carb lasagne is a “thing”! Thin slices of deli chicken make a terrific low-carb substitute for the noodles in lasagne (just choose brands that don’t have added sugar) and the cottage cheese and egg filling can be rolled up in strips of zucchini, like manicotti.
Creamed cottage cheese is an excellent protein source for breakfast or lunch and Greek yogurt is a good source, and delicious with 1/2 cup of berries thrown. Even though Greek yogurt pales in comparison to cottage cheese in terms of its protein to kcal ratio, it still scores higher than steak — and higher than eggs!
low carb manicotti, in process
There are so many good sources of inexpensive protein that can stand on their own, or mixed together to make so many delicious combinations! Looking to other cultures that use these ingredients is a great way to find out what to do with them. Chinese, Korean and Japanese have wonderful easy recipes for tofu. Hispanic cultures including Mexican have so many ways to cook pinto beans, kidney beans, and black beans — both with and without meat and for lentils and chickpeas you need not look far. Middle Eastern recipes abound using these, as do South Asian recipes from India, Pakistan and Sri Lanka. And don’t forget the lowly “offal” meats, like liver and heart! These are inexpensive and good sources of complete protein. Finding out how to cook them properly can make all the difference.
A “low carb” diet need not fit a philosophy, but a definition. What makes a diet low carb is how few carbs it has, not what the source of those carbs are.
Final Thoughts…
Yes, meat prices are crazy these days, but steaks and chops are not the only source of protein and not even the best source! Salmon, tuna, chicken and turkey breast are all excellent sources and one doesn’t need to eat the expensive variety to benefit. Frozen pink salmon or canned tuna are fine! And don’t forget cottage cheese!
More Info?
If you would like more information about how I can help you please send me a note through the Contact Me form.
LEGAL NOTICE: The contents of this blog, including text, images and cited statistics as well as all other material contained here (the ”content”) are for information purposes only. The content is not intended to be a substitute for professional advice, medical diagnosis and/or treatment and is not suitable for self-administration without the knowledge of your physician and regular monitoring by your physician. Do not disregard medical advice and always consult your physician with any questions you may have regarding a medical condition or before implementing anything you have read or heard in our content.
The idea that there is a specific food that acts as the “off switch” for appetite is very compelling. Who hasn’t eaten more food than they planned or wanted? Whether it was too much of the same food or too much of a variety of foods, we often eat until we are stuffed. Wouldn’t it be amazing if we could eat something that could satisfy that drive to eat? According to Dr. Stephen Simpson and Dr. David Raubenheimer, that “something” is protein.
In their 2005 paper published in Obesity Reviews, Simpson and Raubenheimer proposed that obesity isn’t primarily caused by eating too much fat, or eating too many ‘carbs’, but by eating food that has too little protein[1]. They called this the “Protein Leverage Hypothesis”. This states is that humans have a built-in appetite for protein that drives food consumption. When we eat food that contains low amount of protein, we will over-eat until the amount we need is met.
In paleolithic times, the human diet was ~35% animal protein, 33% fat and the remainder plant protein (which was limited in the diet due to antinutrients such as phytates, oxalates, tannins, trypsin-, amylase-, and protease inhibitors, and glycosides) [2]. Humans evolved and thrived eating this way.
In contrast, currently the percentage of protein in diets around the world remains at~16% of daily calories[3] and Simpson and Raubenheimer believe that it is this ‘protein dilution‘ of the diet that results in us overeating food, to try and obtain sufficient amounts.
In their 2005 paper, they wrote;
”The obesity epidemic is among the greatest public health challenges facing the modern world. Regarding dietary causes most emphasis has been on changing patterns of fat and carbohydrate consumption. In contrast the role of protein has largely been ignored because (i) it typically comprises only approximately 15% of dietary energy and (ii) protein intake has remained near constant within and across populations throughout the development of the obesity epidemic. We show that paradoxically these are precisely the two conditions that potentially provide protein with the leverage both to drive the obesity epidemic through its effects on food intake and perhaps to assuage it. [1]“
What this implies is, if we don’t intentionally prioritize protein in the diet, we will overeat fat and carbohydrate to reach the amount we require (or have evolved to eat).
To complicate matters, the food environment is made up of ultra processed foods that are mostly carbohydrate and fat. Snack and convenience foods were only introduced the early 1970s — which, coincidently was when the obesity epidemic began.
We have known since 2018 that foods high in both carbohydrate and fat result in more dopamine being released from the reward-center in striatum of our brain, than foods with carbohydrate alone, or fat alone [4]. This is why will often overeat French fries, but rarely a baked potato. Perhaps, the fact that snack and convenience foods are so low in protein is a contributing factor to us overeating them.
Current statistics indicate that 55% of calories eaten by adults [5] and 67% of calories eaten by children and teenagers [6] come from ultra-processed foods — high in both carbohydrate and fat, and low in protein.
A 2018 follow-up paper by Simpson and Raubenheimer based on the 2009-2010 National Health and Nutrition Examination Survey (NHANES) found higher consumption of ultra-processed foods was associated with lower protein density [7].
“Consistent with the Protein Leverage Hypothesis, increase in the dietary contribution of ultra processed foods was also associated with a rise in total energy intake, while absolute protein intake remained relatively constant [7].
“The protein-diluting effect of ultra processed foods might be one mechanism accounting for their association with excess energy intake [7].”
Rather than going in circles arguing whether eating too much fat or eating too many carbs resulted in obesity, perhaps it is more productive to focus on ensuring sufficient intake of high quality protein.
But how much is best? It depends for whom.
The Recommended Daily Allowance (RDA) for any nutrient is the average daily dietary intake level that is sufficient to meet the needs of 97-98 % of healthy people. The RDA is not the optimal requirement, but the absolute minimum to prevent deficiency.
The RDA – enough protein to prevent deficiency
The RDA for protein for healthy adults is calculated at 0.8 g protein / kg of body weight [8]. A sedentary 70 kg / 154 pound man needs a minimum of 56 g and a sedentary 60 kg / 132 pound woman needs a minimum of 48 g protein per day.
Protein Needs for Active Healthy Adults
For physically active adults, the Academy of Nutrition and Dietetics, Dietitians of Canada, and the American College of Sports Medicine [9] recommend an intake of 1.2—2.0 g protein / kg of lean body mass (LBM) per day to optimize recovery from training, and to promote the growth and maintenance of lean body mass.
Protein Needs for Older Adults
Several position statements by groups working with an aging population indicate that intake between 1.0 and 1.5 g protein / kg of lean body mass (LBM) per day may best meet the needs of adults during aging [10, 11].
For the average, healthy 70 kg / 154 pound sedentary man this would be daily protein intake of 70 -105 g per day and for the average, healthy 60 kg / 132 pound sedentary woman this would be a protein intake of 60-90 g protein per day.
Range of Safe Intake
As written about in an earlier article, according to Dr. Donald Layman, PhD, Professor Emeritus, of Nutrition from the University of Illinois, the highest end of the range of safe intake of protein is 2.5 g protein/ kg of LBM per day.
For the average 70 kg / 154 pound sedentary man this would be a maximum daily protein intake of 175 g per day and for the average 60 kg / 132 pound sedentary woman, this would be a maximum protein intake of 150 g/ day.
Final Thoughts…
We know that the presence of both carbs and fat together in a food has a supra-additive effect on the pleasure center of our brain [4]. This leads to us eating way more of these foods, than foods with just carbs or just fat. Given this, it would make sense to avoid foods that have high amounts of both carbs and fat which include almost all of our favourite snack and convenience foods.
With the exception of nuts, seeds and milkmost real, whole food is high in either carbs or fat, not both. Aim to eat these foods the most, but not together at the same meal.
Based on the Protein Leverage Hypothesis, aim to eat sufficient high protein foods based on your individual needs. Reach for foods such as salmon, tuna, skinless chicken and shrimp the most often. These contain 8 grams of protein per ounce (28 g) and 1.5 grams of fat. Enjoy a good ribeye, some pork or chicken legs that have on average 6.2 grams of protein per ounce (28g), and 6g of fat.
Vegetarian? No problem!
Cottage cheese has 28 g of highly bioavailable protein per cup, and Greek yogurt has 16 grams of protein per cup. Tofu only has ~4.7 grams of protein per ounce (28g), and is a complete protein containing all the essential amino acids.
Think of protein as a control button for appetite and reach for the types of protein that suit your lifestyle best!
More Info?
If you would like more information about how I can help you please send me a note through the Contact Me form.
Simpson SJ, Raubenheimer D. Obesity: the protein leverage hypothesis. Obes Rev. 2005 May;6(2):133-42. doi: 10.1111/j.1467-789X.2005.00178.x. PMID: 15836464.
Ben-Dor M, Gopher A, Hershkovitz I, Barkai R (2011) Man the Fat Hunter: The Demise of Homo erectus and the Emergence of a New Hominin Lineage in the Middle Pleistocene (ca. 400 kyr) Levant. PLoS ONE 6(12): e28689. https://doi.org/10.1371/journal.pone.0028689
Lieberman HR, F.V., Agarwal S, et al. , Protein intake is more stable than carbohydrate or fat intake across various US demographic groups and international populations. The American Journal of Clinical Nutrition, 2020. 112(1): p. 180-186.
DiFeliceantonio AG, Coppin G, Rigoux L, et al., Supra-Additive Effects of Combining Fat and Carbohydrate on Food Reward. Cell Metab. 2018 Jul 3;28(1):33-44.e3. doi: 10.1016/j.cmet.2018.05.018. Epub 2018 Jun 14. PMID: 29909968.
Zefeng Zhang, Sandra L Jackson, Euridice Martinez, Cathleen Gillespie, Quanhe Yang, Association between ultraprocessed food intake and cardiovascular health in US adults: a cross-sectional analysis of the NHANES 2011—2016, The American Journal of Clinical Nutrition, Volume 113, Issue 2, February 2021, Pages 428—436, https://doi.org/10.1093/ajcn/nqaa276
Lu Wang, Euridice Martínez Steele, Mengxi Du, Jennifer L. Pomeranz, Lauren E. O’Connor, Kirsten A. Herrick, Hanqi Luo, Xuehong Zhang, Dariush Mozaffarian, Fang Fang Zhang. Trends in Consumption of Ultraprocessed Foods Among US Youths Aged 2-19 Years, 1999-2018. JAMA, 2021; 326 (6): 519 DOI: 10.1001/jama.2021.10238
Martínez Steele E, Raubenheimer D, Simpson SJ, Baraldi LG, Monteiro CA. Ultra-processed foods, protein leverage and energy intake in the USA. Public Health Nutr. 2018 Jan;21(1):114-124. doi: 10.1017/S1368980017001574. Epub 2017 Oct 16. PMID: 29032787.
National Academies Press, Dietary Reference Intakes for Energy, Carbohydrate, Fiber, Fat, Fatty Acids, Cholesterol, Protein and Amino Acids (2005)
Thomas DT, Erdman KA, Burke LM. American College of Sports Medicine Joint Position Statement. Nutrition and Athletic Performance [published correction appears in Med Sci Sports Exerc. 2017 Jan;49(1):222]. Med Sci Sports Exerc. 2016;48(3):543-568. doi:10.1249/MSS.0000000000000852
Fielding RA, Vellas B, Evans WJ, Bhasin S, et al, Sarcopenia: an undiagnosed condition in older adults. Current consensus definition: prevalence, etiology, and consequences. International working group on sarcopenia. J Am Med Dir Assoc. 2011 May;12(4):249-56
Bauer J1, Biolo G, Cederholm T, Cesari M, et al. Evidence-based recommendations for optimal dietary protein intake in older people: a position paper from the PROT-AGE Study Group. J Am Med Dir Assoc. 2013 Aug;14(8):542-59
LEGAL NOTICE: The contents of this blog, including text, images and cited statistics as well as all other material contained here (the ”content”) are for information purposes only. The content is not intended to be a substitute for professional advice, medical diagnosis and/or treatment and is not suitable for self-administration without the knowledge of your physician and regular monitoring by your physician. Do not disregard medical advice and always consult your physician with any questions you may have regarding a medical condition or before implementing anything you have read or heard in our content.
As a Dietitian who supports people with food addiction, I was recently asked to speak at a food addiction summit. The evening prior to speaking, I was given a list of the questions I would be asked. The first one was “How has food addiction impacted your life? How old were you”? The opening question at the summit was “do you identify as a food addict”?
I had to really think about how to answer this. I knew there were two specific foods over which I had no “off button”. If you’ve listened to some of the podcasts I’ve spoken at, you will know that those two foods are hot Montreal-style bagels that are baked in a wood burning oven, and pizza — but only ones baked in a wood-burning oven (or at a very high heat in a pizza oven). I have NO idea why these are like “kryptonite” to me, and can think of no memory that offers a clue. When I was a kid, there were “Cheezies ®” (a brand of cheese puff snack food from Canada — essentially they are extruded cornmeal covered in powdered cheddar cheese), and as a teenager, there was Nutella®. I would eat Cheezies or Nutella over a period of a few hours, until the container was empty.
To answer the question, ‘how has food addiction impacted my life‘, I first had to define ‘food addiction‘. Since my post-graduate research was in the area of mental health nutrition, I turned to the Diagnostic and Statistical Manual (DSM-5) which is used to classify mental health disorders for diagnoses, treatment, and research. The DSM-5 was published in 1994 and recognizes substance use disorders [1] resulting from the use of 10 separate classes of drugs:
alcohol;
caffeine;
cannabis;
hallucinogens (such as LSD);
inhalants;
opioids;
sedatives, hypnotics or anxiolytics (anti-anxiety medication);
Is food addiction a substance use disorder? I guess it depends who one asks.
On one hand, one’s “kryptonite” foods could fall under “and other or unknown substances,” but as I mentioned in the summit, I don’t think it is the foods themselves that people become addicted to.
I believe that it is the release of dopamine from the pleasure center of the brain that is associated from the release of dopamine from the brain (explained in this article), and supported by endo-cannabinoids and endo-opioids that are also released.
The first question I was asked at the summit was whether I identified as a food addict.
I referred to the list from the DSM-5 which lists the 11 criteria related to substance use disorder.
Food addiction in terms of the definition of “substance use disorder” (DSM-5)
In preparation for the talk, I had marked a red “x” beside the ones that applied to foods that I consider my “kryptonite”.
Taking the substance in larger amounts or for longer than you’re meant to.
Wanting to cut down or stop using the substance but not managing to.
Spending a lot of time getting, using, or recovering from use of the substance.
Cravings and urges to use the substance.
Not managing to do what you should at work, home, or school because of substance use.
Continuing to use, even when it causes problems in relationships.
Giving up important social, occupational, or recreational activities because of substance use.
Using substances again and again, even when it puts you in danger.
Continuing to use, even when you know you have a physical or psychological problem that could have been caused or made worse by the substance.
Needing more of the substance to get the effect you want (tolerance).
Development of withdrawal symptoms, which can be relieved by taking more of the substance.
I could certainly remember eating more hot bagels or pizza than I wanted to, and for longer than I intended, so “yes” to criteria #1.
I certainly wanted to cut down or stop eating hot bagels or pizza, but not managing to, so “yes” to criteria #2.
Criteria #3, was a “no”. I never spent a lot of time getting, using, or recovering from eating those (or any) foods.
There was no question, criteria #4 was a “yes”. I certainly had cravings and urges to eat these foods that only abated when I went low carb and stopped eating them.
Criteria #5, #6, and #7 and #11 were all “no”. Eating these (or any foods) did not interfere with me doing what I needed to at work, home or school, they didn’t cause problems in relationships and I didn’t give up any important social, occupational, or recreational activities because of them. I didn’t experience withdrawal symptoms when I ate those foods.
The reality of answering criteria #8 and #9 was undeniable.
I ate foods such as bagels and pizza (and foods high in both carbs and fat) again and again — even when it put me in danger. I continued to eat these foods, even though I knew (but was in denial!) that I had several physical problems that could have been caused by or made worse by eating these foods.
I was obese, had type 2 diabetes and dangerously high blood pressure — and was a Registered Dietitian with a master’s degree who was in denial as to just how much danger I had put myself in! If you haven’t heard my story, it is under the Food for Thought tab, and titled A Dietitian’s Journey.
Reading Dr. Vera Tarman’s book, Food Junkies made me come face-to-face with criteria #10. I had given up milk chocolate when I adopted a low carb lifestyle, but reading the book made me realize that I needed more dark chocolate to enjoy it. This was classic tolerance.
As I talk about it the food addiction summit, coming to that realization resulted in me giving up all chocolate for a full year. At present, I am finding that I can eat small amounts of >78% cocoa without it being problematic, but am doing so cautiously. I will abstain* completely if I am unable to do that.
I met the criteria for ‘substance use disorder’ when I applied the definition of “substance’ to specific foods.
In colloquial terms, I am a food addict, however I don’t say “I am a type 2 diabetic,” because I am in remission. I don’t say “I have hypertension or obesity”, because I am in remission. So, more accurately, I am a person with food addiction, in remission.
…and like type 2 obesity, hypertension and obesity, I will remain in remission provided I don’t go back and eat how I used to eat before.
Food addiction in terms of substance use disorder
If food addiction would be classified as a ‘substance use disorder’, then meeting 6 of 11 criteria indicates it would be “severe”.
But it’s only hot bagels and pizza! Does that make me a “food addict”?
Here is a rhetorical question that may help answer this.
Does it matter if an alcoholic is powerless over only one type of rum and one type of whiskey?
I don’t think so.
One of the other questions I was asked during the summit was to define “abstinence” and and what an “abstinence food plan” is.
This is how I defined them;
“For me, abstinence is “the practice of restraining oneself from indulging in something”. There is alcohol-addiction, drug-addiction, gambling-addiction, sex-addiction, and food-addiction — but it is not possible to completely abstain from food, as it is necessary for survival. I define abstinence as “restraining from indulging in foods over which one has no control”.
Alcoholics Anonymous uses the term “powerless” to describe addiction, so I define abstinence as “restraining from foods over which one is powerless to stop eating.”
An “abstinent food plan” is one that does not include foods over which a person is powerless to control the amount they eat.”
Final Thoughts…
The DSM-5 does NOT define “food addiction”. It defines “substance use disorder”. That said, I think that looking at whether specific foods or categories of food result in these types of symptoms can be helpful to consider. It can help one decide whether getting support for food addiction may provide a context and structure that they find helpful.
More Info
I design abstinent meal plans for people with food addiction and support the dietary side as people work with either a food addiction- or sugar addiction counsellor, or in a food addiction 12-step program.
If you would like more information please send me a note through the Contact Me form, on the tab above.
Hasin DS, O’Brien CP, Auriacombe M, et al. DSM-5 criteria for substance use disorders: recommendations and rationale. Am J Psychiatry. 2013;170(8):834-851. doi:10.1176/appi.ajp.2013.12060782
LEGAL NOTICE: The contents of this blog, including text, images and cited statistics as well as all other material contained here (the ”content”) are for information purposes only. The content is not intended to be a substitute for professional advice, medical diagnosis and/or treatment and is not suitable for self-administration without the knowledge of your physician and regular monitoring by your physician. Do not disregard medical advice and always consult your physician with any questions you may have regarding a medical condition or before implementing anything you have read or heard in our content.
For as long as I can remember, type 2 diabetes has been called a chronic, progressive diseaseand people diagnosed with type 2 diabetes have been taught that (1) the disease will persist (i.e. is chronic), (2) will only get worse (i.e. is progressive), (3) that medication to manage the disease is inevitable, and (4) that as the disease progresses multiple medications may be required, including insulin.
A newly published consensus report (August 31, 2021) from an expert panel made up of representatives from the American Diabetes Association (ADA), European Association for the Study of Diabetes (EASD) and Diabetes UK states that “diabetes may not always be active and progressive” [1,2,3], and the report highlights that remission is possible, and a person may need ongoing support and regular monitoring to prevent relapse. You can read a summary of the report here.
The website of the American Diabetes Association states [4];
“You might start managing your diabetes with diet and exercise alone, but, over time, will have to progress to medication, and further down the line you might need to take a combination of medications, including insulin.”
While this will be the case if diet and lifestyle are not adequately changed, but it is by no means inevitable!
Diabetes Canada in its patient resources on “the basics” of type 2 diabetes states; ”type 2 diabetes is a progressive, life-long disease” [5].
…and in its March 2020 handout on access to diabetes medication states, Diabetes Canada states that; [6];
Diabetes is a chronic, progressive disease that affects the body’s ability to regulate the amount of glucose (sugar) in the blood. It has no cure, but can be managed through education, support, healthy behaviour interventions, and medications.
…and in its advocacy report on bariatric surgery as a type 2 diabetes intervention strategy [7] states;
Diabetes is a chronic, progressive disease affecting more than 3.6 million Canadians; approximately 90 per cent of whom live with type 2 diabetes. Type 2 diabetes is caused by a combination of genetic, lifestyle and environmental factors. It occurs when the body cannot properly regulate the amount of glucose (sugar) in the blood. Insufficient insulin production, insulin resistance, or both, cause hyperglycemia (high blood sugar) which, over time, can damage blood vessels, nerves and organs, and lead to many debilitating and irreversible complications. Type 2 diabetes can be managed with education and support, behaviour interventions (including healthy eating, regular physical activity and stress reduction) and medication.
Why do diabetes associations not explain that there are three documented ways to put type 2 diabetes into remission, two of which are dietary;
a ketogenic diet [8,9]
a low calorie energy deficit diet [10,11,12]
bariatric surgery (especially use of the roux en Y procedure) [13,14]
Why are people diagnosed with type 2 diabetes still told that type 2 diabetes is a chronic, progressive disease — rather than told about the two evidence-based dietary options to achieve remission?
Final Thoughts…
In light of this new consensus report stating that “diabetes may not always be active and progressive” [1,2,3], it is time to stop referring to diabetes as “a chronic, progressive disease”.
People need to know that remission is possible, as well as information about the evidence-based dietary options that remission can be achieved.
What We’ve Been Taught and What We Need to Know
More Info?
If you would like more information about how I can support you in seeking remission of type 2 diabetes, please have a look under the Services tab, or send me a note through the Contact Me form.
Riddle MC, Cefalu WT, Evans PH. et al. Consensus Report: Definition and Interpretation of Remission in Type 2 Diabetes, The Journal of Clinical Endocrinology & Metabolism, 2021, dgab585, https://doi.org/10.1210/clinem/dgab585
Riddle MC, Cefalu WT, Evans PH. et al. Consensus report: definition and interpretation of remission in type 2 diabetes. Diabetes Care (2021) https://doi.org/10.2337/dci21-0034
Riddle MC, Cefalu WT, Evans PH. et al. Consensus report: definition and interpretation of remission in type 2 diabetes. Diabetologia (2021). https://doi.org/10.1007/s00125-021-05542-z
American Diabetes Association, How Type 2 Diabetes Progresses, https://www.diabetes.org/diabetes/how-type-2-diabetes-progresses
Hallberg, S.J., McKenzie, A.L., Williams, P.T. et al. Effectiveness and Safety of a Novel Care Model for the Management of Type 2 Diabetes at 1 Year: An Open-Label, Non-Randomized, Controlled Study. Diabetes Ther9, 583—612 (2018). https://doi.org/10.1007/s13300-018-0373-9
Athinarayanan SJ, Adams RN, Hallberg SJ, McKenzie AL, Bhanpuri NH, Campbell WW, Volek JS, Phinney SD, McCarter JP. Long-Term Effects of a Novel Continuous Remote Care Intervention Including Nutritional Ketosis for the Management of Type 2 Diabetes: A 2-Year Non-randomized Clinical Trial. Front Endocrinol (Lausanne). 2019 Jun 5;10:348. doi: 10.3389/fendo.2019.00348. PMID: 31231311; PMCID: PMC6561315.
Lim EL, Hollingsworth KG, Aribisala BS, Chen MJ, Mathers JC, Taylor R. Reversal of type 2 diabetes: normalisation of beta cell function in association with decreased pancreas and liver triacylglycerol. Diabetologia2011;54:2506-14. doi:10.1007/s00125-011-2204-7 pmid:21656330
Steven S, Hollingsworth KG, Al-Mrabeh A, et al. Very low-calorie diet and 6 months of weight stability in type 2 diabetes: pathophysiological changes in responders and nonresponders. Diabetes Care2016;39:808-15. doi:10.2337/dc15-1942 pmid:27002059
Lean ME, Leslie WS, Barnes AC, et al. Primary care-led weight management for remission of type 2 diabetes (DiRECT): an open-label, cluster-randomised trial. Lancet2018;391:541-51.
Cummings DE, Rubino F (2018) Metabolic surgery for the treatment of type 2 diabetes in obese individuals. Diabetologia 61(2):257—264.
Madsen, L.R., Baggesen, L.M., Richelsen, B. et al. Effect of Roux-en-Y gastric bypass surgery on diabetes remission and complications in individuals with type 2 diabetes: a Danish population-based matched cohort study, Diabetologia (2019) 62: 611. https://doi.org/10.1007/s00125-019-4816-2
LEGAL NOTICE: The contents of this blog, including text, images and cited statistics as well as all other material contained here (the ”content”) are for information purposes only. The content is not intended to be a substitute for professional advice, medical diagnosis and/or treatment and is not suitable for self-administration without the knowledge of your physician and regular monitoring by your physician. Do not disregard medical advice and always consult your physician with any questions you may have regarding a medical condition or before implementing anything you have read or heard in our content.
A new consensus report from an expert panel made up of representatives from the American Diabetes Association (ADA), European Association for the Study of Diabetes (EASD) and Diabetes UK [1,2,3] have proposes a standard definition for remission of type 2 diabetes. This new article outlines the different factors involved in that definition, as well as the proposed cut-offs.
As outlined in a previous article, in 2009 the American Diabetes Association defined partial remission, complete remission and prolonged remission of type 2 diabetes as follows [4];
Partial remission is having blood sugar that does not meet the classification for Type 2 Diabetes; i.e. either HbA1C < 6.5% and/or fasting blood glucose 5.5 — 6.9 mmol/l (100—125 mg/dl) for at least 1 year while not taking any medications to lower blood glucose.*
Complete remission is a return to normal glucose values i.e. HbA1C <6.0%, and/or fasting blood glucose < 5.6 mmol/L (100 mg/dl) for at least 1 year while not taking any medications to lower blood glucose.
Prolonged remission is a return to normal glucose values (i.e.
HbA1C <6.0%, and/or fasting blood glucose < 5.6 mmol/L (100 mg/dl) for at least 5 years while not taking any medications to lower blood glucose.
In 2019, the Association of British Clinical Diabetologists and the Primary Care Diabetes Society [5] defined remission of type 2 diabetes as follows;
“Remission of type 2 diabetes can be diagnosed when a person with confirmed type 2 diabetes has achieved all three of the following criteria: (1) weight loss; (2) fasting plasma glucose or HbA1c below the WHO diagnostic threshold (<7 mmol/L or <48 mmol/mol, respectively) on two occasions separated by at least 6 months; (3) the attainment of these glycaemic parameters following the complete cessation of all glucose-lowering therapies.”
I am by no means an expert in diabetes, but in clinical practice I’ve defined remission of type 2 diabetes as blood sugar levels “at or below the cut-offs for diagnosis” (HbA1C & FBG) without the use of medication.
Choice of the Term “Remission”
The consensus report’s expert panel outlined that while several terms have been proposed to describe those who have become free of a previously diagnosed disease state, including ‘resolution‘, ‘reversal‘, ‘remission‘, and ‘cure‘, that with respect to type 2 diabetes ‘remission‘ is the most appropriate term [1,2,3]. They chose the term remission as it is used widely used in the field of cancer treatment (oncology) as defined as a decrease in or disappearance of signs and symptoms of cancer [6].
The expert panel believes that the term remission captures that (1) “diabetes may not always be active and progressive“, while also implying that (2) “notable improvement may not be permanent“, and (3) is consistent with the view that a person may need ongoing support and regular monitoring to prevent relapse [1,2,3].
“Remission” Not Equivalent to No Evidence of Disease
The panel highlighted that the tendency to equate remission with “no evidence of disease” is not appropriate with respect to type 2 diabetes because diabetes is defined by hyperglycemia, which exists on a continuum [1,2,3], and noted that any criterion chosen to define remission is somewhat arbitrary, as it represents a point on a continuum of glycemic levels. They also highlighted that remission is not equivalent to “no evidence of disease” because the underlying cause of type 2 diabetes is rarely resolved by dietary or lifestyle changes, or by bariatric surgery — including insufficient release of insulin from βeta-cells and insulin resistance.
Different Levels of Remission
The panel decided against dividing diabetes remission into partialremission and complete remission using different blood glucose thresholds as this could result in challenges with respect to policy decisions related to insurance premiums, and coding for medical visits and that the 5-year threshold previously used by the ADA for defining prolonged remission “did not have an
objective basis”.
Use of Glucose-Lowering Medication in Defining Remission
The issue of whether remission could be diagnosed while a person was receiving ongoing medication support, was also addressed. This is an important consideration, as some studies such as those from Virta Health [7,8] define remission of type 2 diabetes as a HbA1C < 6.5% and fasting blood glucose ≤ 5.5 (100 mg/dl) while taking no other medication except metformin / glucophage.
The panel concluded that since it is not possible to tell if a person has achieved remission due to dietary and lifestyle changes or due to medication that lowers glucose, “a diagnosis of remission can only be made after all glucose-lowering agents have been withheld for an interval that is sufficient both to allow waning of the drug’s effects and to assess the effect of the absence of drugs on HbA1c values“.
The panel concluded the absence of medication includes the use of metformin for weight maintenance, to improve markers of risk for cardiovascular disease or cancer, or prescribed for polycystic ovarian syndrome (PCOS), GLP-1 receptor agonists (such as Ozempic, Victoza / Saxenda and others) which may be used for weight management or to reduce the risk of cardiovascular events, and sodium glucose cotransporter inhibitors (such as Invokana, Jardiance, Synjardy and others) which may be prescribed for heart failure or renal protection.
The panel concludes that if it is not possible to discontinue these drugs for 3 months or longer, then remission cannot be diagnosed even though normal or near normal blood sugar values are maintained — and that without doing so “whether true remission has been attained remains unknown”.
Timeline for Determining Remission
Whether the changes made are dietary, lifestyle or surgical (such as gastric bypass), varying amounts of time are required to determine whether remission has been achieved.
Medication Intervention (Pharmacotherapy)
The expert panel determined that when the intervention has been through medication (pharmacotherapy), there needs to be a period of at least 3 months after the medication has been completely stopped before tests of HbA1C can reliably evaluate whether remission has been achieved.
Surgical Intervention
In the event of surgical intervention, the panel determined that there needs to be a period of at least 3 months after the surgical procedure and3 months after the medication has been completely stoppedbefore tests of HbA1C can reliably evaluate whether remission has been achieved.
Lifestyle Changes
When lifestyle changes, including diet and exercise are made, the panel determined that there needs to be a period of at least 6 months after beginning this interventionand3 months after the medication has been completely stoppedbefore tests of HbA1C can reliably evaluate whether remission has been achieved.
Need for Ongoing Monitoring
As outlined above, since the improvements in blood glucose may not be permanent, a person who has achieved remission from type 2 diabetes as defined above will likely need ongoing support and regular monitoring to prevent relapse as weight gain, stress resulting from other illnesses, and the continued decline of βeta-cell function can all result in recurrence of type 2 diabetes. The panel recommends regular laboratory testing of HbA1c or another measure of blood sugar control should be performed at least once a year.
The panel cautions that since there can still be the “legacy effect” of prior poor blood sugar control in various body tissues that continues after remission of symptoms, there is a need not only for ongoing monitoring of HbA1C, but also regular retinal screening for retinopathy,tests of renal function to rule out nephropathy, foot evaluation to rule out neuropathy, as well as measurement of blood pressure and weight to reduce the risk of cardiovascular disease.
HbA1c as the Defining Measurement of Remission
The expert panel set the cut-off point for defining remission as HbA1c to < 6.5% (<48 mmol/mol) while stating that “the relative effectiveness of using HbA1C of 6.0% (42 mmol/mol), HbA1c of 5.7% (39 mmol/mol), or some other level in predicting risk of relapse or microvascular or cardiovascular complications should be evaluated“. As noted above, the panel believes that any criterion chosen to define remission is somewhat arbitrary, as it represents a point on a continuum of glycemic levels.
Conclusions of the Expert Panel
The expert panel concluded that the term “remission” should be used to describe a sustained metabolic improvement in type 2 diabetes to nearly normal levels defined as a return of HbA1c to < 6.5% (<48 mmol/mol) that occurs spontaneously, or following an intervention and that persists for at least 3 months in the absence of usual glucose-lowering medication (pharmacotherapy).
When HbA1c is determined to be an unreliable marker of chronic glycemic control, the panel concluded that a fasting blood glucose (FBG) / fasting plasma glucose (FPG) <126 mg/dL (<7.0 mmol/L) or eA1C <6.5% calculated from continuous glucose monitoring (CGM) values can be used as an alternative.
Final Thoughts…
In addition to the new proposed cut-offs, there are three very important points made in this new consensus report:
NOTE: Be sure to read the following post about why it is time to stop calling type 2 diabetes ”a chronic, progressive disease”.
More Info?
If you would like more information about how I can support you in seeking remission of type 2 diabetes as defined above, please have a look around my web page, or send me a note through the Contact Me form.
Note: A consensus report is not an American Diabetes Association (ADA) position statement but represents expert opinion of this international expert panel’s collective analysis, evaluation, and opinion.
References
Riddle MC, Cefalu WT, Evans PH. et al. Consensus Report: Definition and Interpretation of Remission in Type 2 Diabetes, The Journal of Clinical Endocrinology & Metabolism, 2021, dgab585, https://doi.org/10.1210/clinem/dgab585
Riddle MC, Cefalu WT, Evans PH. et al. Consensus report: definition and interpretation of remission in type 2 diabetes. Diabetes Care (2021) https://doi.org/10.2337/dci21-0034
Riddle MC, Cefalu WT, Evans PH. et al. Consensus report: definition and interpretation of remission in type 2 diabetes. Diabetologia (2021). https://doi.org/10.1007/s00125-021-05542-z
Buse JB, Caprio S, Cefalu WT, et al. How do we define cure of diabetes? Diabetes Care 2009 Nov; 32(11): 2133-2135.https://doi.org/10.2337/dc09-9036
Nagi D, Hambling C, Taylor R. Remission of type 2 diabetes: a position statement from the Association of British Clinical Diabetologists (ABCD) and the Primary Care Diabetes Society (PCDS). Br J Diabetes 2019, June 2019; 19 (1):73—76. https://doi.org/10.15277/bjd.2019.221
Barnes E. Between remission and cure: patients, practitioners and the transformation of leukaemia in the late twentieth century. Chronic Illness 2008, Jan 2008;3(4):253—264.https://doi.org/10.1177/1742395307085333
McKenzie AL, Hallberg SJ, Creighton BC, Volk BM, Link TM, Abner MK, Glon RM, McCarter JP, Volek JS, Phinney SD, A Novel Intervention Including Individualized Nutritional Recommendations Reduces Hemoglobin A1c Level, Medication Use, and Weight in Type 2 Diabetes, JMIR Diabetes 2017;2(1):e5, URL: http://diabetes.jmir.org/2017/1/e5, DOI: 10.2196/diabetes.6981
Hallberg, S.J., McKenzie, A.L., Williams, P.T. et al. Diabetes Ther (2018). Effectiveness and Safety of a Novel Care Model for the Management of Type 2 Diabetes at 1 Year: An Open-Label, Non-Randomized, Controlled Study. https://doi.org/10.1007/s13300-018-0373-9
LEGAL NOTICE: The contents of this blog, including text, images and cited statistics as well as all other material contained here (the ”content”) are for information purposes only. The content is not intended to be a substitute for professional advice, medical diagnosis and/or treatment and is not suitable for self-administration without the knowledge of your physician and regular monitoring by your physician. Do not disregard medical advice and always consult your physician with any questions you may have regarding a medical condition or before implementing anything you have read or heard in our content.
INTRODUCTION: Green tea which is high in the catechin EGCG (epigallocatechin gallato) has been associated in two meta-analysis with a reduction in body weight and body fat — especially abdominal fat [1,2] and matcha powder is especially high in EGCG.
Catechins make up ~ 30% of green tea’s dry weight and while ordinary brewed green tea contains ~50—100 mg catechins [3], just 1 gram (~1/3 teaspoon) of matcha powder contains 105 mg of catechins of which 61 mg are EGCs.
A 2009 meta-analysis of 11 green tea catechin studies found that subjects consuming between 270 to 1200 mg green tea catechins / day ( 1 — 4 tsp of matcha powder per day) lost an average of 1.31 kg (~ 3 lbs) over 12 weeks [2], but that the effect of green tea catechins on body composition was significant, even when the weight loss between treated and untreated groups is small (~5 lbs in 12 weeks).
Even with as little as a 3 pound weight loss, the total amount of abdominal fat decreased 25 times more with green tea catechin consumption than without it (−7.7 vs. −0.3%) [2] and the total amount of subcutaneous abdominal fat (fat just below the skin on the abdomen) decreased almost 8 times more with green tea catechin consumption than without it (−6.2 vs. 0.8%) [2].
A 2017 meta-analysis found that consuming as little as 100 and 460 mg/day has shown significant effectiveness on body fat and body weight reduction in intervention periods of 12 weeks or more [1].
How do Green Tea Catechins in Matcha Work?
The mechanisms by which green tea catechins reduce body weight and reduce the amount of total body fat and in particular reduce the amount of abdominal fat are still being investigated but it is thought that green tea catechins increase thermogenesis (increased heat production which would result in increased energy expenditure), increase fat oxidation (using body fat as energy), decrease appetite, result in the down-regulation of enzymes involved in liver fat metabolism, and decrease nutrient absorption [2].
Timing of Matcha Catechin Consumption
Green tea catechins such as EGCG found in matcha are absorbed in the intestine and since the presence of food significantly decreases their absorption, green tea catechins are best consumed 1/2 an hour before meals, or 2 hours after meals.
The timing of green tea catechin intake may also affect the absorption and metabolism of glucose. A study by Park et al [4] found that when green tea catechins were given one hour before to a glucose (sugar) load, glucose uptake was inhibited and was also accompanied by an increase in insulin levels.
Effect of Milk Casein on Catechins
It was previously thought that the protein casein found in milk binds green tea catechins, making them unavailable for absorption in the body, however a recent study found that while the antioxidant activity of polyphenols is lowered from 11-27% by the presence of casein, EGCG which is the catechin in matcha is actually increased by the presence of casein [5].
Final Thoughts…
Consuming between 1 — 4 tsp of matcha powder per day (270 to 1200 mg green tea catechins / day) is sufficient to contribute to weight loss of ~ 3 lbs in 12 weeks (with no other dietary or activity changes) and more significantly decrease body fat composition, especially abdominal fat.
Along with a well-designed meal plan, beverages containing matcha powder may be helpful for those who have already lost significant amounts of weight and who would like to lose remaining fat on their abdomen.
WARNING TO PREGNANT WOMEN
While EGCG has also been found to be similar in its effect to etoposide anddoxorubicin, a potent anti-cancer drug used in chemotherapy [6 al], high intake of polyphenolic compounds during pregnancy is suspected to increase risk of neonatal leukemia. Bioflavonoid supplements (including green tea catechins) should not be used by pregnant women [7].
High Protein to Energy Matcha Drink
This drink is great after a workout, or as a quick high protein, low carb meal replacement when time doesn’t allow for real, whole food. It may be helpful for those who have already lost significant amounts of weight, yet are having difficulty losing residual fat around their abdomen.
Since matcha does contain caffeine, I recommend drinking these before 2 PM in the afternoon so that the caffeine does not interfere with sleep.
Ingredients
1 tsp matcha (green tea) powder (1 tsp = 2 gm)
1 scoop unflavoured whey isolate powder (25 g protein per scoop)
12 cubes ice cubes
1 cup (250 ml) fat free Fairlife® milk (low carb, high protein)
Optional: 1.5 tsp monk fruit / erythritol sweetener
Method
Place 1 tsp matcha powder in a small stainless steel sieve and gently press through the sieve into a small bowl with the back of a small spoon
Put the sieved matcha powder into a ceramic or glass bowl (not metal, as the tannins in the tea will react and give the beverage and ”off” metallic taste)
Whisk 3 tbsps. boiled and cooled water into the matcha powder using a bamboo matcha whisk (available at Japanese and Korean grocery stores) until the mixture is smooth and frothy
Add low carb erythritol sweetener, if desired
Add 1 scoop of unflavoured whey isolate powder
Stir in 1 cup Fairlife® (low carb, high protein) milk
Pour mixture over ice cubes
Macros
calculated by Cronometer®
Protein to Energy Ratio = 3.17
protein to energy calculated from ptoe.com
More Info?
I design low carb Meal Plans from a variety of perspectives, including a Low Carb High Protein / P:E perspective.
If you would like more information, please send me a note using the Contact Me form on the tab above.
Vázquez Cisneros LC, López-Uriarte P, López-Espinoza A, et al. Effects of green tea and its epigallocatechin (EGCG) content on body weight and fat mass in humans: a systematic review. Nutr Hosp. 2017 Jun 5;34(3):731-737. Spanish. doi: 10.20960/nh.753. PMID: 28627214.
Hursel R, Viechtbauer W, Westerterp-Plantenga MS. The effects of green tea on weight loss and weight maintenance: a meta-analysis. Int J Obes (Lond). 2009 Sep;33(9):956-61. doi: 10.1038/ijo.2009.135. Epub 2009 Jul 14. PMID: 19597519.
Weiss DJ, Anderton CR, Determination of catechins in matcha green tea by micellar electrokinetic chromatography, Journal of Chromatography A, Vol 1011(1—2):173-180, September 2003
Park JH, Jin JY, Baek WK, Park SH, Sung HY, Kim YK, et al. Ambivalent role of gallated catechins in glucose tolerance in humans: a novel insight into nonabsorbable gallated catechin-derived inhibitors of glucose absorption. J Phyisiol Pharmacol 2009;60:101—9.
Bourassa P, Cote R, Hutchandani S, et al, The effect of milk alpha-casein on the antioxidant activity of tea polyphenols, J Photochem Photobiol 2013;128, 43-49.
Bandele, OJ, Osheroff, N. Epigallocatechin gallate, a major constituent of green tea, poisons human type II topoisomerases”.Chem Res Toxicol 21 (4): 936—43, April 2008.
Paolini, M, Sapone, A, Valgimigli, L, ”Avoidance of bioflavonoid supplements during pregnancy: a pathway to infant leukemia?”. Mutat Res 527 (1—2): 99—101. (Jun 2003)
LEGAL NOTICE: The contents of this blog, including text, images and cited statistics as well as all other material contained here (the ”content”) are for information purposes only. The content is not intended to be a substitute for professional advice, medical diagnosis and/or treatment and is not suitable for self-administration without the knowledge of your physician and regular monitoring by your physician. Do not disregard medical advice and always consult your physician with any questions you may have regarding a medical condition or before implementing anything you have read or heard in our content.
As I was heading out the door early this morning to begin walking again at the local track, I realized it was the same weather as it was more than four years ago, when I made my first video. I decided to wear the same glasses and rain shell that I did in that video and post the side-by-side comparison. This is that video update!
That first video was part of a post called “The Road to Better Health” in what I ended up calling ”A Dietitian’s Journey”, my personal weight-loss and health-recovery story. In the post which accompanies that video, I mentioned how just three weeks earlier I was faced with two choices; (1) go on medication or (2) change my lifestyle — and on March 5, 2017, I chose the latter.
In retrospect, that video really marked the beginning of my journey, and over time hundreds of people ended up following me on social media in order to watch my progress. I never set out to do that, but I think the novelty of someone posting “before” pictures, before there were “after” photos caused people wanted to see if I would actually be successful. I was — and I still am.
Here is that first video, which I posted on YouTube. In it, you can clearly see how I was not only obese, but could barely walk and talk at the same time!
Since the weather was almost the same today, I thought it would be a great time to post an update to encourage those who have followed my journey from the beginning.
While it took me two years to attain my weight loss and put my diabetes and high blood pressure into remission, here it is more than 2 years since then and I have maintained remission of type 2 diabetes and hypertension.
Like most people, I gained almost 20 pounds over the past year due to the Covid pandemic, but I have already lost half of that and anticipate losing the rest by the end of the summer.
Everyone’s weight and health-recovery “journey” will be different. This is mine.
I hope this update encourages you that it is both “doable” and “sustainable”.
More Info?
If you’d like to know more about what I do, and how I may be able to help you achieve your own weight-loss and health recovery, please have a look under the Services tab, above. If you have questions, please send me a note using the Contact Me form and I will reply as soon as I am able.
I’ve recently been asked to explain the difference between a Low Carb High Protein (LCHP) diet and the new P:E Diet, and that is the purpose of this article. While both these diets prioritize protein, the recommended macros are very different. This article outlines these two approaches and highlights the similarities and difference between the macro recommendations of these two diets.
Defining Terms
In order to describe how these two diets are similar and different, it is necessary to define some terms — specifically
(1) “low carb“, “keto” and “moderate carb”
(2) “low fat”
(3) “high protein”
Defining Carbohydrate Intake
Feinman et al [1] define very low carbohydrate (”keto”) diet, low carbohydrate diet and moderate carbohydrate diet as follows:
1. very low carbohydrate (keto) diet: 20—50g carbohydrate /day, < 10% total energy intake
2. low carbohydrate diet: < 130g carbohydrate / day, < 26% of total energy intake
3. moderate carbohydrate diet: 130—225g carbohydrate / day, 26—45% of total energy intake
Since these same cut offs for carbohydrate are used by diabetes associations around the world — including the American Diabetes Association, European Association for the Study of Diabetes (EASD), Diabetes Australia, and Diabetes Canada, I use these established definitions, as well.
Defining “Low Fat”
A low fat diet is defined by the USDA as ”not more than 30% of calories from fat” [2].
Defining “High Protein”
Lower and Higher protein diets were defined in a very recent systematic review and meta-analysis[3] with some overlap;
Lower Protein Diets provide 10-23% of calories from protein
Higher Protein Diets provide 20-45% of calories from protein
The P:E Diet
P:E Diet -the book
I’ve read the P:E Diet book and find that it provides excellent guidance for healthy individuals who are seeking to build muscle, and lose excess fat. For those seeking to accomplish those goals, the P:E diet is excellent as it encourages people to eat the best quality protein for the least amount of energy (as fat + net carbs).
That said, as I have covered in previous articles and will elaborate on below, I am concerned that the total amount of protein generated in the P:E Macro Generator associated with the P:E Diet (located at the bottom of www.p2eq.com) can get close to the maximum rate at which the kidney can get rid of nitrogen waste from protein in the urine.
I also have concerns that the P:E Macro Generator associated with the diet provides a carbohydrate intake of >100 g of carbohydrate per day to up to >160 g carbohydrate per day which is fine for healthy individuals, but may be inappropriate for someone who is metabolically unhealthy, especially having difficulty with higher than normal blood sugar levels. There is a clear disclaimer at the beginning of the book that it is not intended for those with health conditions, but none on the P:E Macro Generator.
Recommended Macros for the P:E Diet
The P:E Diet Macro Calculator associated with the P:E Diet is located at the bottom of www.p2eq.com recommends 40% protein and 30% fat and 30% carbohydratefor males or females of different heights. Recommended weight generated by the Macro Calculator is set to Ideal Body Weight (i.e. a BMI of 22) which is halfway through the normal weight category.
Below are some examples of macros from the P:E Macro Generator for different heights for both genders;
Carbohydrate recommendation for a man who is 5’7″ tall are at the low end of the moderate carbohydrate range — providing 131 g of carbs / 30% of total energy intake — where moderate carbohydrate is defined as 130—225g carbohydrate / day, 26—45% of total energy intake.
Fat recommendation of 30% calories as fat is low fat, i.e. ”not more than 30% of calories from fat”.
Protein recommendation of 40% calories as protein is a High Protein Diet i.e. provides 20-45% of calories from protein.
Macros for a man who is 5’10” tall are in the moderate carbohydrate range — providing 144 g of carbs / 30% of total energy intake — where moderate carbohydrate is defined as 130—225g carbohydrate / day, 26—45% of total energy intake.
Fat recommendation of 30% calories as fat is low fat, i.e. ”not more than 30% of calories from fat”.
Protein recommendation of 40% calories as protein is a High Protein Dieti.e. provides 20-45% of calories from protein.
Macros for a woman who is 5’6″ tall are in the low carbohydrate range — providing 117 g of carbs / 30% of total energy intake — where low carbohydrate is defined as < 130 g carbohydrate / day, < 26% of total energy intake.
Fat recommendation of 30% calories as fat is low fat, i.e. ”not more than 30% of calories from fat”.
Protein recommendation of 40% calories as protein is a High Protein Diet i.e. provides 20-45% of calories from protein.
Macros for a man who is 6’2″ tall are in the middle of the moderate carbohydrate range — providing 162 g of carbs / 30% of total energy intake — where moderate carbohydrate is defined as 130—225g carbohydrate / day, 26—45% of total energy intake.
Fat recommendation of 30% calories as fat is low fat, i.e. ”not more than 30% of calories from fat”.
Protein recommendation of 40% calories as protein is a High Protein Diet i.e. provides 20-45% of calories from protein.
Summary of P:E Macros
For the most part, carbohydrates in the P:E Diet are in the moderate carbohydrate range, although are on occasion they are in the high end of the low carbohydraterange, or at the low end of the moderate carbohydrate range [1].
The P:E Diet is a Low Fat Diet as it provides ”not more than 30% of calories from fat” [2].
The P:E Diet is a High Protein Diet providing 40% of calories from protein which is in the 20-45% of calories from protein range [3].
Recommended Macros for Low Carb High Protein Diet
As outlined in the previous article, the way I have taught a Low Carb High Protein (LCHP) diet the past 3 years is that protein is set at 25-30% protein (to a maximum of 2.5-3.0 g protein per kg ideal body weight), fat at 65-70% fat and carbohydrate at 10% carbs. This is at the high end of the protein range recommended by Phinney and Volek [7] of 20% to up to 30% of daily calories as protein — and fat is the same as they recommend, at 65-70% fat and 10% carbs.
A Low Carb High Protein diet is always low carbor very low carb; low carb when it contains <130g carbohydrate per day, < 26% of total energy intake, and very low carb (‘keto‘) when it contains 20—50g carbohydrate /day, < 10% total energy intake.
A Low Carb High Protein diet is a HighFat Diet as it provides 65-70% fat, which is ”more than 30% of calories from fat” [2]. Unlike the popularized Low Carb High Fat diet, most of the fat in a Low Carb High Protein Diet comes from the fat inherent in the protein eaten — such as the fat in high fat fish like salmon and tuna, fat in Greek yogurt or the fat that comes in ground beef. There is very little added fat, since a Low Carb High Protein Diet is often used for weight loss.
A Low Carb High Protein diet is a High Protein Diet providing 25-30% of calories from protein [3] to a maximum of 2.5-3.0 g protein per kg ideal body weight, and which is in the 20-45% of calories from protein range of a High Protein Diet [3].
Important Differences Between Low Carb High Protein and P:E Diet
From my perspective, there are two significant differences between a Low Carb High Protein diet and the P:E Diet.
The first significant difference is that the P:E Diet may be low carb — but for the most part is a moderate carbohydrate diet. For those who are metabolically healthy, a diet which provides a carbohydrate intake of >100 g of carbohydrate per day to up to >160 g carbohydrate per day as real, whole (cellular) food is fine. My concern is that for those who already have pre-diabetes or type 2 diabetes, a carbohydrate intake of >100 g carbohydrate per day up to >160 g per day is not the best way to improve blood sugar levels.
A Low Carb High Protein diet is, by definition, a low carb diet — so it has demonstrated the most evidence for improving blood sugar.
The second significant difference between a Low Carb High Protein Diet and the P:E Diet is that protein in the P:E Diet is set at 40% of daily calories — and as described in this earlier article, for some heights and weights, the P:E Macro Calculator generates protein at the high end of the maximum protein intake of 3.2 g protein per kg ideal body weight.
When protein is eaten, the body must get rid of the nitrogen by-product and the main way the body gets rid of this nitrogen is by turning it into ammonia, and then excreting it as urea in the urine. Since 84% of the nitrogen waste produced from protein intake is excreted as urea in the urine [5], the safe upper limit of protein intake is based on the maximum rate of urea production which is 3.2 g protein per kg body weight [6], described in more detail in this article.
Protein needs should always be calculated as grams of protein per kilogram of body weight of the person and not as a percentage of daily calories e.g. 40 % of daily energy as protein. This is to ensure adequacy and avoid the excess. An intake of 40% of daily calories as protein for one person may be below the safe upper limit of 3.2 g protein per kg body weight, but for another 40% of calories as protein put them right at the upper limit (more in this article).
By the P:E Diet Macro Generator setting protein intake at 40% of daily calories without limiting a maximum to below the safe upper limit of 3.2 g protein per kg body weight, the protein recommendations generated may sometimes be at the very upper limit.
The Low Carb High Protein Diet, the way I teach it sets protein at 25-30% of daily calories — with a maximum of 2.5 g protein per kg ideal body weight, which is below the safe maximum intake level.
Different Diets for Different Purposes
The P:E Diet is geared towards healthy people seeking to build muscle and lose fat, and as indicated on page 85;
“all bodybuilders are really combining low carb AND low fat AND high protein to the very highest level of success.“
That is what the P:E Diet Macro Calculator located at the bottom of www.p2eq.com is set to do!
It generates macros that are 40% protein, 30% fat and 30% carbohydrate.
A diet that is 30% carbohydrate IS “low carb” when compared with the 45-65% carbohydrate range of the US or Canadian dietary guidelines AND low fat (“”not more than 30% of calories from fat” AND high protein (40% of daily calories as protein) and this is by design.
A Low Carb High Protein Diet, the way I teach it (and as conceptualized by Phinney and Volek in their book) is primarily a therapeutic diet aimed at improving metabolic health including high blood sugar, insulin resistance and for weight loss.
The P:E Diet book is not directed at those who have medical conditions such as pre-diabetes or type 2 diabetes, or for those who have higher than normal blood sugar.
These are very different diets, for very different purposes.
Final Thoughts…
I think the P:E Diet as outlined in the book provides excellent guidance for healthy individuals seeking to build muscle and lose excess fat and P:E ratio as a concept is excellent — encouraging people to eat the best quality protein for the least amount of energy (as fat + net carbs).
I also find that the tool for looking up the P:E ratio of individual foods (at the same link as the Macro Generator, except at the top of the page) is very helpful and saves people from having to do the math to determine Protein / (Fat + Net Carbs).
That said, I am concerned that total amount of protein in the P:E Macro Generator is not limited to a maximum of 3.0 g protein / kg ideal body weight — to ensure it does not exceed the 3.2 g protein / kg ideal body weight (the rate at which the kidney can get rid of nitrogen in the urine). This could easily be done, given that the weight it generates is already set at Ideal Body Weight.
For those who are metabolically healthy, the P:E Macro Generator which provides a carbohydrate intake of >100 g of carbohydrate per day to up to >160 g carbohydrate per day as real, whole (cellular) food is fine, but my concern is that this level of carbohydrate intake may be inappropriate for someone who is already metabolically unhealthy — especially for someone with prediabetes or type 2 diabetes or challenges with higher than normal blood sugar. This could easily be solved by providing a clear disclaimer such as the one that appears in the book.
More Info?
I design low carb Meal Plans from a variety of perspectives, including a Low Carb High Protein and can help individuals decide between different approaches based on their health, goals and nutritional needs.
For those who are metabolically healthy, I also design Meal Plans from a P:E perspective, however I do limit maximum protein intake to a maximum of 2.5 g protein per kg of ideal body weight.
If you would like more information, please send me a note using the Contact Me form on the tab above.
Feinman RD, Pogozelski WK, Astrup A, Bernstein RK, Fine EJ, Westman EC, et al. Dietary Carbohydrate Restriction as the First Approach in Diabetes Management: critical review and evidence base. Nutrition. 2015;31(1):1—13
Institute of Medicine (US) Committee on Examination of Front-of-Package Nutrition Rating Systems and Symbols; Wartella EA, Lichtenstein AH, Boon CS, editors. Front-of-Package Nutrition Rating Systems and Symbols: Phase I Report. Washington (DC): National Academies Press (US); 2010. Appendix B, FDA Regulatory Requirements for Nutrient Content Claims. Available from: https://www.ncbi.nlm.nih.gov/books/NBK209851/
Vogtschmidt YD, Raben A, Faber I et al, Is Protein the Forgotten Ingredient: Effects of higher compared to lower protein diets on cardiometabolic risk factors: a systematic review and meta-analysis of randomised controlled trials, Atherosclerosis, May 25, 2021, DOI:https://doi.org/10.1016/j.atherosclerosis.2021.05.011
TomeÌ D, Bos C, Dietary Protein and Nitrogen Utilization, The Journal of Nutrition, Volume 130, Issue 7, July 2000, Pages 1868S—1873S, https://doi.org/10.1093/jn/130.7.1868S
Rudman D, DiFulco TJ, Galambos JT, Smith RB 3rd, Salam AA, Warren WD. Maximal rates of excretion and synthesis of urea in normal and cirrhotic subjects. J Clin Invest. 1973;52(9):2241-2249. doi:10.1172/JCI107410
Volek JS, Phinney SD, The Art and Science of Low Carbohydrate Living: An Expert Guide, Beyond Obesity, 2011
Naiman T, Shewfelt W, The P:E Diet – Leverage Your Biology to Achieve Optimal Health, June 10, 2020, 330 pages
LEGAL NOTICE: The contents of this blog, including text, images and cited statistics as well as all other material contained here (the ”content”) are for information purposes only. The content is not intended to be a substitute for professional advice, medical diagnosis and/or treatment and is not suitable for self-administration without the knowledge of your physician and regular monitoring by your physician. Do not disregard medical advice and always consult your physician with any questions you may have regarding a medical condition or before implementing anything you have read or heard in our content.
People still think that a “keto diet” is all about eating loads of fat, and while a Low Carb High Fat (LCHF) diet is certainly one way to do ‘keto’, it is by no means the only way — or is it even a single diet. There are therapeutic ketogenic diets for epilepsy and adjunct treatment (along with chemotherapy and radiation) for certain types of cancer, as well as for seeking to improve quality of life outcomes in certain neurological disorders, such as MS. There are also different types of “low carb” and “keto” diets that are used for weight loss and for improving metabolic heath — that range from ones that prioritize fat, to those that prioritize protein. This article outlines some of the key advantages and disadvantages of different types of low carb* and keto** diets that are used for weight loss and normalizing blood sugar.
As outlined here, *low carb is defined as < 130g carbohydrate / day, < 26% of total energy intake and very low carb / **keto diets are defined as 20—50g carbohydrate /day, < 10% total energy intake.
Humans can use protein, fat and carbohydrate for fuel, but our two main energy sources are fat and carbohydrate. While amino acids from the protein we eat can be used to make glucose to maintain blood sugar and to supply red blood cells when there is inadequate food intake, protein’s main role in the diet is NOT as a fuel source, but to provide amino acids (the building blocks of protein) for the body to make its own proteins. Protein is primarily there to provide structure and function, not energy.
Fat and carbohydrate are human’s two primary energy sources — and carbohydrate is entirely optional from a biological perspective.
Even the Dietary Reference Intakes support that carbohydrate in the diet is optional, provided we eat adequate amounts of protein and fat.
Protein and fat are not optional, carbohydrate is.
Page 275 Dietary Reference Intakes for Carbohydrate [1]Page 275 of the Dietary Reference Intakes states that;
”The lower limit of dietary carbohydrate compatible with life apparently is zero, provided that adequate amounts of protein and fat are consumed.”
Our body has an absolute requirement for specific essential nutrients — and these are called “essential nutrients” because we must take them in through our diet because we can’t synthesize them.
As I wrote about back in 2017, there are 9essential amino acids that must be supplied in the different kinds of protein that we eat, and include histidine, isoleucine, leucine, lysine, methionine, phenylalanine, threonine, tryptophan, valine and there are 2 essential fatty acids — linoleic (an omega 6 fat) and alpha-linolenic (an omega 3 fat) that also must be provided in the diet because that can’t be synthesized by the body.
There are also 13 essential vitamins (vitamin A, vitamin B1 (thiamine), B2 (riboflavin), B3 (niacin), B5 (pantothenic acid), B6 (pyrodoxine), B12 (cyanocobalamine), biotin, vitamin C (ascorbic acid), choline, vitamin D (cholecalciferol), vitamin E (tocopherol) and folate), and several essential minerals, including major minerals (calcium, phosphorus, potassium, sodium, chloride and magnesium) and minor minerals (chromium, cobalt, copper, fluorine, iodine, iron, manganese, molybdenum, selenium, silicon, sulfur and zinc).
Of the 3 macronutrients (protein, carbs and fat), protein and fat are not optional because they provide the essential amino acids and essential fats — and with them, many (but not all) of the essential vitamins and essential minerals. The remainder of the essential vitamins and minerals are provided by eating a wide range of vegetables and fruit.
Prioritizing Protein
Whether we eat a Low Carb High Fat (LCHF) diet, or Low Carb High Protein (LCHF) diet, we first need to make sure we are eating adequate amounts of high quality protein for our needs, and with high quality proteins come the essential fats.
Think of protein as the foundation of a balance scale — providing the body with building blocks for structure and function — and the two arms of a balance scale as the two sources of fuel for energy: carbohydrate and fat.
We need to have enough protein for our needs, but not so much as to exceed the body’s ability to get rid of the excess nitrogen in our urine (more about that here).
Basic protein requirements are set in the Recommended Daily Allowance (RDA) for protein, which is the level that is sufficient to meet the needs of 97-98 % of healthy people and to prevent deficiency. The RDA for protein for healthy adults is calculated at 0.8 g protein / kg of reference body weight (i.e. IBM) [1]. Remember, this is the bare minimum to prevent deficiency in most people.
For those who are physically active, the Academy of Nutrition and Dietetics, Dietitians of Canada, and the American College of Sports Medicine[2] recommend a protein intake of 1.2—2.0 g protein / kg IBW per day to optimize recovery from training, and to promote the growth and maintenance of lean body mass.
Older people also need more protein in order to maintain muscle mass, and prevent sarcopenia (muscle loss associate with aging). There have been several position statements issued by those that work with an aging population indicating that protein intake between 1.0 and 1.5 g protein / kg IBW per day may best meet the needs of adults during aging [3,4].
The Need to “Trade Off” Protein for Ketones
If we need to supply our body with lots of ketones for therapeutic reasons — such as the management of seizure disorder, or as an adjunct treatment for certain types of cancer or neurological disorders, then there is the need to “trade off” supplying the body anything more than the bare minimum of protein, in order to provide it with the very high levels of fat needed to make high levels of ketones.
The classic Ketogenic Diet (KD) has a 4:1 ratio i.e. 4 parts of fat for every 1 part protein and carbs and the Modified Ketogenic Diet (MKD) has a 3:1 ratio i.e. 3 parts fat for every 1-part protein, but unless a person has a therapeutic need for high levels of ketones, then why eat super high levels of fat?
Higher Fat than Carbs – two very different approaches
As outlined in the American Diabetes Association’s April 2019 Consensus Report, a low carbdiet has “demonstrated the most evidence for improving glycemia (blood sugar) for individuals with diabetes“[6], so either a Low Carb High Fat diet or a Low Carb High Protein diet are excellent approaches for those with prediabetes or type 2 diabetes seeking to significantly improve their blood sugar, or to put type 2 diabetes into remission.
Popularized “Keto” Diet
When most people think of a Low Carb High Fat (LCHF) diet, they think of the standard “keto diet” of 75% fat, 15% protein and 10% carbs, which is the popularized high fat approach of Dr. Jason Fung and the Diet Doctor website recommend. As will be outlined below, there are other Low Carb High Fat approaches.
If the goal is to lose weight however, it really doesn’t make a lot of sense to eat tons of fat which provides almost twice as much energy, as either protein or carbs — unless also doing regular periods of intermittent and extended fasting. While people do have success with this type of low carb high fat diet when used this way, this approach has drawbacks for some people.
Intermittent fasting for less than 24 hours has many benefits, but the problem with extended fasting for periods longer than 24 hours is there is a loss of lean body mass (muscle) that goes along with it — which is more of a concern for older adults who are already losing lean body mass, than for younger people.
According to a 1979 research article published in the American Journal of Clinical Nutrition [7], protein is lost during extended fasting beginning on day 1 and continues until it reaches at maximum on day 3, then slowly declines. These results are validated in other studies, including one from Owen and Cahill in 1969 [9,10].
from Virta Health: https://www.virtahealth.com/blog/science-of-intermittent-fasting
This graph from Virta Health [10] based on the same research [7] shows the losses in grams of nitrogen per day, where each gram represents the loss of about 1 ounce of lean tissue.
This graph also from Virta Health [9] and based on the same research shows the long-term loss of body nitrogen (protein) as % of pre-fasting value. While loss of protein slows somewhat after day 10, it continues right up to 60 days.
Based on this data, healthy overweight adults who fast for 10 days will lose 5 pounds of lean muscle [9].
According to a 1983 study by by Cahill, normal protein breakdown is ~75 g per day and while protein breakdown will eventually slow by ~25% when people are fasting long term in order to spare muscle, this is only as the ”final stage of adaptation” and only ”once ketoacid levels (ketones) reach a plateau and the brain is preferentially using ketoacids as fuel [10]”.
This time frame is consistent with the research above [9,10] showing that the slowing of muscle loss only occurs after 10 days of fasting, when ketones become the preferred fuel.
It is for this reason that I do not recommend fasting longer than 24 hours for older adults — especially post-menopausal women who are already at risk of sarcopenia (muscle loss), but daily periods of intermittent fasting (from the end of dinner until the first meal of the day, the following day) is recommended to help normalize blood sugar and circulating levels of insulin.
Another shortcoming with the popularized “keto” macros is that 15% protein may be insufficient for an older adult or for someone to sustain regular physical activity (more here).
For younger adults and those who are not trying to build muscle, this approach can be very helpful for losing weight and controlling blood sugar levels.
A “Well-Formulated” Ketogenic Diet
Another approach which falls in the Low Carb High Fat (LCHF) category are the recommendations of Dr. Stephen Phinney and Dr. Jeff Volek from their book The Art and Science of Low Carbohydrate Living — which recommends ~60-70% fat, 20%-up to 30% protein, and 10% carbohydrate [11].
This style of low carb high fat diet provides up to 30% protein, which is almost twice as much protein as the popularized keto’ diet, which is only 15% protein — and as outlined in an earlier article is insufficient for older adults, as well as people sustaining regular physical activity.
Low Carb High Protein
In a sense, a Low Carb High Protein (LCHP) diet which provides ~25-30% protein really falls at the higher end of the range of Dr. Stephen Phinney and Dr. Jeff Volek’s approach of 20% — up to 30% protein and provides a similar fat range of 65-70% fat, and 10% carbs.
As a “low carb diet” it offers all the benefits for lowering blood sugar, and as such is ideal for those seeking to put pre-diabetes or type 2 diabetes into remission.
It is also ideal for those seeking weight loss without periods of extended fating, as it does not have excessive fat, and provides sufficient protein for older adults and those who participate in regular physical activity.
Final Thoughts…
Both a Low Carb High Fat diet and Low Carb High Protein diet are low carb — so both are great for controlling blood sugar.
A Low Carb High Protein diet has almost twice the protein as a Low Carb High Fat diet — so, great for older adults and those who exercise regularly.
Protein provides satiety (feeling full) for almost half the calories as fat –so, great for weight loss.
If there is no need for a person to have very high levels of ketones, than a person should select which low carb or keto diet they follow on the basis of first meeting their protein needs. Then they can select the amount of carbohydrate that best meets their blood glucose goals. Finally, they can add a little fat to make things taste good as their essential fats come with their protein.
More Info?
If you are interested in learning more about my services, please have a look at the Services tab. At the top are services provided as a Registered Dietitian to those in Canada, and at the bottom are Nutrition Education services provided to those outside of Canada.
National Academies Press, Dietary Reference Intakes for Energy, Carbohydrate, Fiber, Fat, Fatty Acids, Cholesterol, Protein and Amino Acids (2005)
Thomas DT, Erdman KA, Burke LM. American College of Sports Medicine Joint Position Statement. Nutrition and Athletic Performance [published correction appears in Med Sci Sports Exerc. 2017
Fielding RA, Vellas B, Evans WJ, Bhasin S, et al, Sarcopenia: an undiagnosed condition in older adults. Current consensus definition: prevalence, etiology, and consequences. International working group on sarcopenia. J Am Med Dir Assoc. 2011 May;12(4):249-56
Bauer J1, Biolo G, Cederholm T, Cesari M, et al. Evidence-based recommendations for optimal dietary protein intake in older people: a position paper from the PROT-AGE Study Group. J Am Med Dir Assoc. 2013 Aug;14(8):542-59
Evert, AB, Dennison M, Gardner CD, et al, Nutrition Therapy for Adults With
Diabetes or Prediabetes: A Consensus Report, Diabetes Care, Ahead of Print, published online April 18, 2019, https://doi.org/10.2337/dci19-0014
G B Forbes, E J Drenick, Loss of body nitrogen on fasting, The American Journal of Clinical Nutrition, Volume 32, Issue 8, August 1979, Pages 1570—1574, https://doi.org/10.1093/ajcn/32.8.1570
Owen OE, Felig P, Morgan AP, Wahren J, Cahill GF Jr. Liver and kidney metabolism during prolonged starvation. J Clin Invest. 1969 Mar;48(3):574-83. doi: 10.1172/JCI106016. PMID: 5773093; PMCID: PMC535723.
Phinney SD, Volek JS, To Fast of Not to Fast: what are the Risks of Fasting?, December 5, 2017, Virta Health, https://www.virtahealth.com/blog/science-of-intermittent-fasting
Cahill GF Jr. President’s address. Starvation. Trans Am Clin Climatol Assoc. 1983;94:1-21.
Volek JS, Phinney SD, The Art and Science of Low Carbohydrate Living: An Expert Guide, Beyond Obesity, 2011
LEGAL NOTICE: The contents of this blog, including text, images and cited statistics as well as all other material contained here (the ”content”) are for information purposes only. The content is not intended to be a substitute for professional advice, medical diagnosis and/or treatment and is not suitable for self-administration without the knowledge of your physician and regular monitoring by your physician. Do not disregard medical advice and always consult your physician with any questions you may have regarding a medical condition or before implementing anything you have read or heard in our content.
The human body is able to use carbohydrate, fat or protein to generate energy, however only carbohydrate and fat are major fuel sources. Protein’s role in the diet is mainly to provide amino acids needed by the body to make its own proteins, for structure and function.
During digestion, carbohydrate, fat and protein from food are broken down into their basic components — carbohydrates are broken into simple sugar and turned into glucose, proteins are broken down into amino acids, and fat is broken down into fatty acids and glycerol.
Figure 16.4.4 : The Effect of Exercise Intensity on Fuel Sources (from [1]Protein is not usually used for energy, although small amounts of amino acids from broken down protein are used by the body when we’re resting, and even smaller amounts are used when we’re doing moderate-intensity exercise[1].
During moderate-intensity exercise, our body will use half fatty acids as fuel and half glucose. During high-intensity exercise our body will rely on glucose as fuel — both from the carbohydrates we ate, as well as generated by breaking down fat stores. It is only if we are not getting enough calories in our food or from our fat stores that protein will be used for energy[2] and burned as fuel. If more protein is eaten than is needed by the body, the excess will be broken down and stored as fat [2].
Determining Individual Macros
In determining the amount of protein, fat and carbohydrate that each individual needs (i.e. “macros”), choosing the amount of protein we require comes first. The amount of carbohydrate and fat is chosen after that — based on the needs of the individual for blood sugar control and their metabolic health.
Since it is not a primary fuel source for the body, think of protein as the base of a balance scale — providing the body with building blocks for structure and function. The two arms of the balance are the two sources of fuel for energy: carbohydrate and fat.
How do we choose the amount of protein we need?
We need to have enough protein for our needs, but not so much as to either store the excess as fat — or worse, to exceed the ability of our body to get rid of the excess nitrogen-by-product in the urine. Since 84% of the nitrogen waste produced from protein intake is excreted as urea in the urine[3], the safe upper limit of protein intake is based on the maximum rate of urea production which is 3.2 g protein per kg of ideal body weight [4] i.e. lean body mass.
NOTE: this calculation is based on lean body mass (also known as Ideal Body Weight or Ideal Body Mass (IBW), not total body weight. Lean body mass is essentially one’s total body weight minus the amount of fat they have.
Lean body mass can be assessed using a DEXA scan, or estimated by using relative fat mass (RFM). The amount of fat someone has can be estimated from total body weight (taken on a scale), minus their estimated RFM as described in this article.
Once we know a person’s lean body mass, we can use the equation (3.21 g of protein / kg lean body mass) to determine the maximum amount of protein they can eat on an ongoing basis while being able to safely dispose of the ammonia via urea through urine.
Basic protein requirements are set in the Recommended Daily Allowance (RDA) for protein, which is the level that is sufficient to meet the needs of 97-98 % of healthy people and to prevent deficiency. The RDA for protein for healthy adults is calculated at 0.8 g protein / kg of reference body weight (i.e. IBM) [5]. Remember, this is the bare minimum to prevent deficiency in most people.
For those who are physically active, the Academy of Nutrition and Dietetics, Dietitians of Canada, and the American College of Sports Medicine[6] recommend a protein intake of 1.2—2.0 g protein / kg IBW per day to optimize recovery from training, and to promote the growth and maintenance of lean body mass.
Older people also need more protein in order to maintain muscle mass, and prevent sarcopenia (muscle loss associate with aging). There have been several position statements issued by those that work with an aging population indicating that protein intake between 1.0 and 1.5 g protein / kg IBW per day may best meet the needs of adults during aging [7,8].
Balancing Carbohydrate and Fat as Fuel
There are 3 ways that carbohydrate and fat as fuel can be balanced — and which one is best for a specific individual depends on their protein needs (outlined above), as well as their metabolic health.
Higher Carbohydrate than Fat
The standard American (and Canadian) diet recommended by national dietary guidelines aims for the majority of fuel (energy intake) to come from carbohydrate.
These diets are High Carb, Low Fat (HCLF) diets.
They are “high carb” because they provide >225g – 300 g carbohydrate / day, 45-65% of total energy intake.
They are “low fat” as they provide “not more than 30% of calories from fat [9].
For those who are metabolically healthy, a high carbohydrate diet where carbohydrate sources are unrefined whole grains (include the husk and the bran), as well as unprocessed starchy vegetables such as yam, peas and winter squash is certainly one option. The problem is that 88% of Americans are already metabolically unwell [10], with presumably a large percentage of Canadians as well (more about that here).
People who are already showing indications that they are not tolerating carbohydrate well; manifest either as high HOMA-IR, pre-diabetes or type 2 diabetes might do better to select another option for their main fuel source — especially given that the American Diabetes Association (ADA) consensus report on Diabetes and pre-diabetes published on April 2019 indicated that;
”Reducing overall carbohydrate intake for individuals with diabetes has demonstrated the most evidence for improving glycemia and may be applied in a variety of eating patterns that meet individual needs and preferences[11].”
Higher Fat than Carbohydrate
Low Carb, High Fat (LCHF) diets are one type of diet that provides more fuel (energy) from fat, than from carbohydrate. There is another type, outlined below.
These range from the popularized “keto diet” of Dr. Jason Fung and the Diet Doctor website which typically provide ~75% fat, 15% protein, ~10% carbohydrate — to the recommendations of Dr. Stephen Phinney and Dr. Jeff Volek from their book The Art and Science of Low Carbohydrate Living which recommends ~60-70% fat, 20%-up to 30% protein, and 10% carbohydrate [12].
These are considered “low carb” diets when they provide < 130g carbohydrate / day, < 26% of total energy intake and “very low carb” (ketogenic) diets when they provide 20—50g carbohydrate / day, < 10% total energy intake — based on the definition from Feinman et al [13] which defines very low carbohydrate, low carbohydrate, and moderate carbohydrate diets as follows:
1. very low carbohydrate diet: 20—50g carbohydrate /day, < 10% total energy intake
2. low carbohydrate diet: < 130g carbohydrate / day, < 26% of total energy intake
3. moderate carbohydrate diet: 130—225g carbohydrate / day, 26—45% of total energy intake
The same definitions of “low carbohydrate” and “very low carbohydrate” are also used in the clinical guidelines of the American Diabetes Association [11], as well as Diabetes Canada [15] where these are meal pattern options for those with diabetes and pre-diabetes to control blood sugar.
Balanced Fat and Carbs
This type of diet is a High Protein, Low Fat (HPLF) diet and the best-known is the P:E Diet of Dr. Ted Naiman.
The P:E Diet is “high protein” diet – recommending 40% protein with equal amounts of fat (30%) and carbohydrate (30%) — as generated by the P:E ratio Macro Calculator (located at the bottom of www.p2eq.com);
Macros as generated by the P:E ratio Macro Calculator (located at the bottom of www.p2eq.com).
The P:E diet is “low fat” as it provides “not more than 30% of calories from fat [9].
For the most part, the P:E diet is “moderate carb” — providing ~130—225g carbohydrate per day — although for some weights and heights, the carbohydrate content is slightly below the 130 g carbs / day cut-off for “low carb” (see examples from the P to E Macro Calculator, above).
While a high protein intake makes sense for those seeking to build and sculpt muscle, as outlined in this previous article setting the recommendation for protein at 40% of dietary intake (instead of as “g protein per kg body weight“) results in protein sometimes coming close to exceeding the excretion rate for urea of 3.2 g protein per kg reference body weight.
This could be avoided if the P:E Macro Calculator was set a maximum limit of protein of 3.0 g protein / per kg body weight.
Low Carbohydrate High Protein
A Low Carb High Protein (LCHP) diet provides ~25-30% protein, which is significantly higher than the 10-20% protein of the standard American (or Canadian diet), yet without the possibility of exceeding the urea excretion capacity of the kidney as protein intake is set to up to 2.5 grams protein per kg body weight (which is well below the maximum of 3.2 g protein / kg ideal body weight).
Having high protein, it offers more satiety at less than half the calories of fat [16] — which makes much more sense for someone seeking weight loss.
Like the Low Carb, High Fat diets of Dr. Jason Fung and Diet Doctor (~75% fat, 15% protein, ~10% carbohydrate) this diet is “high fat“, and provides 65-70% fat. In a sense, a Low Carb High Protein meal pattern reflects the higher end of the range of Dr. Stephen Phinney and Dr. Jeff Volek’s approach of ~60-70% fat, 20%-up to 30% protein, and 10% carbohydrate.
This meal patterns provides a wide range of fats from olive oil and avocado oil to (depending on the lipid profile of the person) butter and coconut oil. Most of the fat provided in the diet is not from added fat, but from fat that comes along with protein — such as the fat in meat, cheese, nuts or yogurt.
Most significantly, this meal pattern is “low carb” (< 130g carbohydrate / day) or “very low carb” / ketogenic — providing ~20—50g carbohydrate / day and as a low carb diet “has demonstrated the most evidence for improving glycemia” [11].
For those seeking fat loss but already having difficulty handling carbohydrate, a Low Carb High Protein (LCHP) meal pattern offers the “best of both worlds”.
It offers the benefits of being able to build new muscle, as well as lower the risk of muscle loss.
It also offers the higher satiety of high protein — without the possibility of exceeding the body’s ability to excrete ammonia in the urine.
…and it is “low carb” — providing the improved blood sugar control that “low carb” is known for.
Final Thoughts…
Humans only have two primary fuel sources, so meal patterns such as Low Carb High Fat, Low Carb High Protein and P:E (High Protein Low Fat) always come down to a choice between “low carb” or “low fat“.*
*theoretically, one could set all 3 macros at 33% each — making the meal pattern neither low fat or low carb — but to what end?
Whether low carb or low fat is the most suitable for someone depends on their protein needs and metabolic health.
Comes down to a choice between “low carb” and “low fat”
I started out 5 years ago teaching low carb from a Low Carb High Fat (LCHF) perspective, and for the last 3 years have also provided a Low Carb High Protein (LCHP) meal pattern.
For those seeking to improve blood sugar or put type 2 diabetes into remission, either one of the low carb options work, however it has been my experience that peri- and post-menopausal women often do much better on the higher protein version of a low carb diet when it comes to weight loss.
Over the last few months, I have also been asked to provide metabolically healthy people with a P:E / HPLF Meal Plan — which I do, although I set an upper limit on protein intake to a maximum of 2.0 g protein per kg ideal body weight.
Different people have different goals and health needs, which is why I offer more than one type of meal pattern. While a P:E diet is just on the edge of “low carb” — it is very much “low carb” when compared with the Standard American (and Canadian) diet.
There is no one-sized-fits-all low carb or ketogenic diet.
More Info?
If you are interested in having me design a Meal Plan for you, then please have a look at the Complete Assessment Package under the Services tab (for those in Canada).
If you are outside of Canada and would like me to provide you with Nutrition Education for either low carb high fat or low carb high protein, then please have a look the Meal Plan Package under the Services tab.
Fuel Sources. (2020, August 13). Retrieved May 24, 2021, from https://med.libretexts.org/@go/page/7071
Youdim A, Merck Manual, Carbohydrates, Proteins and Fats, https://www.merckmanuals.com/en-ca/home/disorders-of-nutrition/overview-of-nutrition/carbohydrates-proteins-and-fats
TomeÌ D, Bos C, Dietary Protein and Nitrogen Utilization, The Journal of Nutrition, Volume 130, Issue 7, July 2000, Pages 1868S—1873S, https://doi.org/10.1093/jn/130.7.1868S
Rudman D, DiFulco TJ, Galambos JT, Smith RB 3rd, Salam AA, Warren WD. Maximal rates of excretion and synthesis of urea in normal and cirrhotic subjects. J Clin Invest. 1973;52(9):2241-2249. doi:10.1172/JCI107410
National Academies Press, Dietary Reference Intakes for Energy, Carbohydrate, Fiber, Fat, Fatty Acids, Cholesterol, Protein and Amino Acids (2005)
Thomas DT, Erdman KA, Burke LM. American College of Sports Medicine Joint Position Statement. Nutrition and Athletic Performance [published correction appears in Med Sci Sports Exerc. 2017
Fielding RA, Vellas B, Evans WJ, Bhasin S, et al, Sarcopenia: an undiagnosed condition in older adults. Current consensus definition: prevalence, etiology, and consequences. International working group on sarcopenia. J Am Med Dir Assoc. 2011 May;12(4):249-56
Bauer J1, Biolo G, Cederholm T, Cesari M, et al. Evidence-based recommendations for optimal dietary protein intake in older people: a position paper from the PROT-AGE Study Group. J Am Med Dir Assoc. 2013 Aug;14(8):542-59
Institute of Medicine (US) Committee on Examination of Front-of-Package Nutrition Rating Systems and Symbols; Wartella EA, Lichtenstein AH, Boon CS, editors. Front-of-Package Nutrition Rating Systems and Symbols: Phase I Report. Washington (DC): National Academies Press (US); 2010. Appendix B, FDA Regulatory Requirements for Nutrient Content Claims. Available from: https://www.ncbi.nlm.nih.gov/books/NBK209851/
Araíºjo J, Cai J, Stevens J. Prevalence of Optimal Metabolic Health in American Adults: National Health and Nutrition Examination Survey 2009—2016. Metabolic Syndrome and Related Disorders Vol 20, No. 20, pg 1-7, DOI: 10.1089/met.2018.0105
Evert, AB, Dennison M, Gardner CD, et al, Nutrition Therapy for Adults With Diabetes or Prediabetes: A Consensus Report, Diabetes Care, Ahead of Print, published online April 18, 2019, https://doi.org/10.2337/dci19-0014
Volek JS, Phinney SD, The Art and Science of Low Carbohydrate Living: An Expert Guide, Beyond Obesity, 2011
Feinman RD, Pogozelski WK, Astrup A, Bernstein RK, Fine EJ,Westman EC, et al. Dietary Carbohydrate Restriction as the First Approach in Diabetes Management: critical review and evidence base. Nutrition. 2015;31(1):1—13
Diabetes Canada, Diabetes Canada Position Statement on Low Carbohydrate
Diets for Adults with Diabetes: A Rapid Review Canadian Journal of Diabetes (2020), doi: https://doi.org/10.1016/j.jcjd.2020.04.001
Stubbs J, Ferres S, Horgan G, Energy Density of Foods: Effects on Energy Intake, Critical Reviews in Food Science and Nutrition, 40:6, 481-515, 2010
LEGAL NOTICE: The contents of this blog, including text, images and cited statistics as well as all other material contained here (the ”content”) are for information purposes only. The content is not intended to be a substitute for professional advice, medical diagnosis and/or treatment and is not suitable for self-administration without the knowledge of your physician and regular monitoring by your physician. Do not disregard medical advice and always consult your physician with any questions you may have regarding a medical condition or before implementing anything you have read or heard in our content.


 This past Monday, I went to the lab to have blood tests to measure my thyroid hormones, anti-thyroid antibodies, and an iron panel. When I had met with my doctor last week, I learned that I would need to pay for the free T3 test because the British Columbia guidelines and protocols for ordering thyroid tests state that a free T3 test is only covered to rule out suspected cases of hyperthyroidism [1]. As I wrote


 Yesterday (October 22, 2022), I was the Dietitian representing low carb and keto diets in the management of type 2 diabetes at the Diabetes Canada Let’s End Diabetes Virtual Conference. I co-presented with two other Dietitians; Jenna Walsh, RD, CDE who represented intermittent fasting, and Alka Chopra, RD, CDE who represented a plant-based approach.


 My doctor agreed to my request for a thyroid panel [TSH, free T4, and free T3] even though I may have to pay for FT3 because of the provincial guidelines.
 The next symptom that I became aware of was


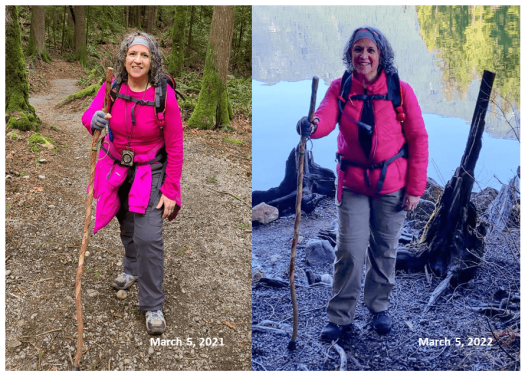


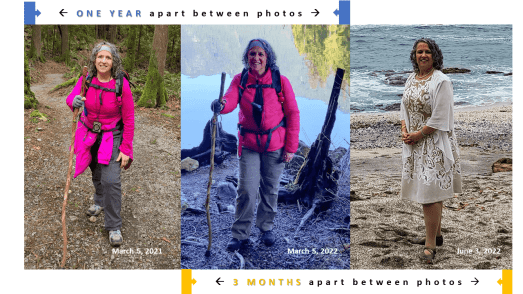


 Two years ago, in the summer of 2019, I was feeling fantastic and was in remission of type 2 diabetes and hypertension and was celebrating my “


 NOTE (August 15, 2022):


 When I set out to restore my health four years ago, that’s exactly what I did. Maintaining it simply takes making those same choices, daily. It really does come down to recognizing that there is a space between the circumstances and our response, where we have the power to choose.


 The first question I was asked at the summit was whether I identified as a food addict.
 The reality of answering criteria #8 and #9 was undeniable.
  I was obese, had type 2 diabetes and dangerously high blood pressure — and was a Registered Dietitian with a master’s degree who was in denial as to just how much danger I had put myself in! If you haven’t heard my story, it is under the Food for Thought tab, and titled
  Diabetes Canada in its patient resources on “the basics” of type 2 diabetes states; ”type 2 diabetes is a progressive, life-long disease” [5].
 The panel cautions that since there can still be the “legacy effect” of prior poor blood sugar control in various body tissues that continues after remission of symptoms, there is a need not only for ongoing monitoring of HbA1C, but also regular retinal screening for retinopathy, tests of renal function to rule out nephropathy, foot evaluation to rule out neuropathy, as well as measurement of blood pressure and weight to reduce the risk of cardiovascular disease.
 Ingredients

 The P:E Diet


 A
A
 Think of protein as the foundation of a balance scale — providing the body with building blocks for structure and function — and the two arms of a balance scale as the two sources of fuel for energy: carbohydrate and fat.
 This graph also from Virta Health [9] and based on the same research shows the long-term loss of body nitrogen (protein) as % of pre-fasting value. While loss of protein slows somewhat after day 10, it continues right up to 60 days.
 Both a Low Carb High Fat diet and Low Carb High Protein diet are low carb — so both are great for controlling blood sugar.


