
Most people think of pre-diabetes as ‘warning sign’ that they are at risk for developing type 2 diabetes, but it is actually the final stage before diagnosis. By the time a person is prediabetic their blood glucose results (also called “blood sugar”) are in the abnormal range on routine tests such as a fasting blood glucose test (FBS) and glycated hemoglobin (HbA1C). They also may already have increased high blood pressure, abnormal cholesterol, and be at increased risk of cardiovascular disease, including heart attack and stroke as well as chronic kidney disease. By assessing a person’s fasting blood glucose and fasting insulin at the same time then using a simple calculation we can accurately estimate the degree of a person’s insulin resistance and β-cell function before they become pre-diabetic — enabling them to make dietary interventions to prevent that from occurring, lower the likelihood of them progressing to type 2 diabetes
It is now known that abnormalities with the hormone insulin — including insulin resistance and hyperinsulinemia appear more than 20 years before a diagnosis of Type 2 Diabetes[1], so prevention of type 2 diabetes needs to begin when blood sugar results still appear normal.
Before getting into the technical details of insulin resistance and hyperinsulinemia, I want to explain these concepts in terms that everyone can understand.
Measuring Glucose and Insulin Together
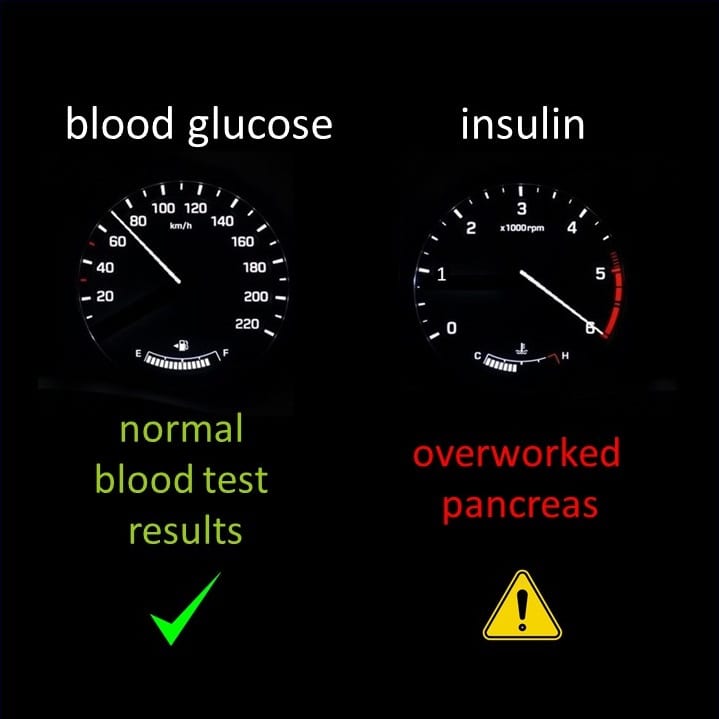
Most people know that a car’s speedometer indicates how fast the car is going. The tachometer indicates how many times per minute the engine is rotating. If a car is doing 180 km / hour (110 miles per hour) on the highway, one would expect the engine to be working hard. But if a car was only doing 70 km / hour (44 miles per hour), one wouldn’t expect the engine to be working that hard, right?
The problem is that blood sugar may be within normal range because the pancreas is overworking to keep it low! The β-cell of the pancreas are being overworked but no one notices because they aren’t looking for it.
Even when people have a 2 hour Oral Glucose Test with added insulin assessors (explained below), blood glucose results may come back normal because the person is healthy. The problem is that blood glucose results may appear normal because the pancreas is working way too hard to keep it that way! That is, using the car example, the tachometer is working very hard, but the car is hardly moving!
Let’s look at this scenario in terms of blood test results;
Let’s say we have a person that has fasted overnight and their fasting blood glucose in the morning is normal at 4.9 mmol/L (88 mg/dl), but their fasting insulin is much higher than the ideal 14.0 – 42.0 pmol/L (2-6 uU/ml) — in this case, say it is 132.6 pmol/L (19.1 uU/ml).
This would be like the car being started but in “park” in the driveway and the engine turning at 3,000 RPM! The pancreas is working way too hard to maintain blood sugar and the person hasn’t even eaten yet!
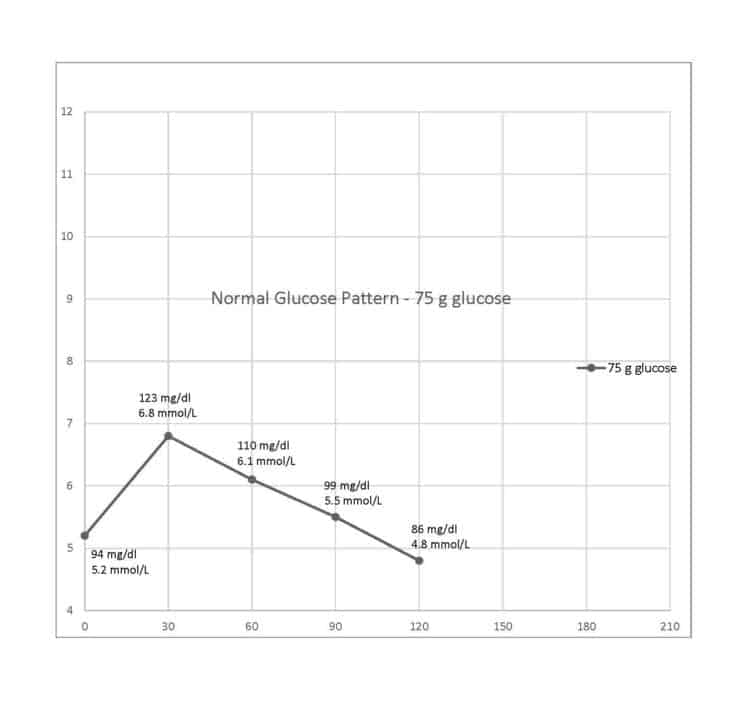
Say we now give this person 75 g of pure glucose to drink and check what happens to their blood sugar at 30 minutes and/or one hour afterwards.
What we expect a healthy person’s blood sugar to do is to go up in response to taking in the glucose, for the pancreas to release the appropriate amount of insulin which results in the blood sugar going back down to at- or slightly below where it started from. This is the normal, healthy response.
On a graph it would look like this;
But in the case of the person whose blood sugar is normal at fasting (i.e. 4.9 mmol/L (88 mg/dl)) but their fasting insulin is much higher than ideal (i.e. 132.6 pmol/L (19.1 uU/ml) instead of 14.0 – 42.0 pmol/L (2-6 uU/ml)), their car is in “park” but the engine is already turning fast!
When this person drinks the 75 g of glucose, their pancreas goes into “high rev” and releases a huge amount of insulin—which not only keeps the blood sugar from going up normally in response to taking in glucose, it may result in the blood sugar actually dropping slightly below the fasting level (from 4.9 mmol/L / 88 mg/dl to 4.8 mmol/L / 86 mg/dl). This is not a healthy response but is characteristic of hyperinsulinemia (too much circulating insulin even when the person is fasting).
This glucose and insulin response would look as follows;
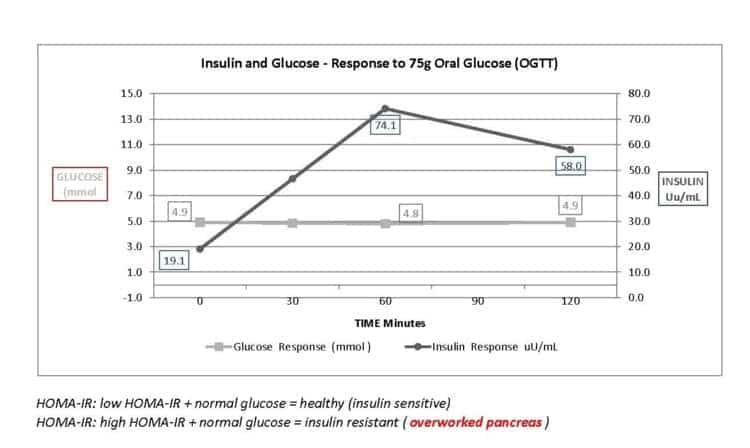
If this person had only had a standard 2 hour Glucose Tolerance Test, they would be told everything is “fine” because their fasting blood glucose was normal at 4.9 mmol/L / 88 mg/dl and at 2 hours their blood glucose came right back down to normal (4.9 mmol/l / 88 mg/dl)!
Using the car analogy, their “tachometer” (pancreas that produces insulin) is working way too hard in order to keep blood sugar low. Burnout of the pancreatic β-cells is what results in type 2 diabetes (T2D) but without assessing simultaneous glucose AND insulin at fasting, either 30 minutes or 1 hour, and at 2 hours, the fact this person’s pancreas is working way too hard to keep glucose low would be totally missed.
By the time a person is diagnosed with T2D, they have lost approximately half of their β-cell mass, so preventing the β-cell’s of the pancreas from being overworked is how to delay or prevent becoming type 2 diabetic!
Four Stages of Type 2 Diabetes – why assessing β-cell function is important
There are four stages in the progression of type 2 diabetes, with Insulin Resistance (IR) and hyperinsulinemia being the stage BEFORE pre-diabetes [2].
Stage 1: Insulin Resistance (including hyperinsulinemia)
Stage 2: Pre-diabetes
Stage 3: Type 2 Diabetes
Stage 4: Metabolic and Vascular Complications
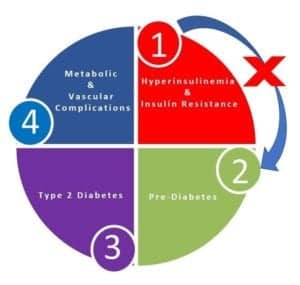
Insulin resistance and hyperinsulinemia together are essentially “pre-pre-diabetes“, therefore stopping progression of the disease at this point reduces the risk associated with high blood pressure, abnormal cholesterol, heart attack and stroke, as well as chronic kidney disease.
Insulin resistance is where the cells of the body ignore signals from the hormone insulin which tell it to move glucose from broken down from digested food — from the blood and into the cells. When someone is insulin resistant, blood glucose stays higher than it should be, for longer than it should be, which is called hyperglycemia. When there are insufficient receptors on muscle cells to move glucose out of the blood after eating, this is called insulin resistance. It isn’t known whether insulin resistance comes first or hyperinsulinemia (high circulating levels of insulin) does. It is believed that it may be different depending on the person[3].
Assessing Insulin Resistance and β-cell Function
Homeostatic Model Assessment (HOMA-IR) estimates the degree of insulin resistance (IR), β-cell function (the cells of the pancreas that produce insulin) and insulin sensitivity (%S) and is determined from the results simultaneous fasting blood glucose test and a fasting insulin test.
Alternatively, HOMA-IR can be determined from a fasting blood glucose test and a fasting C-peptide test [3]. C-peptide is released in proportion to insulin, so it can be used to estimate insulin. Individual results are best compared to local population cut off values for HOMA1-IR [4] (1985) or the updated HOMA2-IR [5] (1998) .
HOMA1-IR is defined as [fasting insulin (µU/mL)í— fasting glucose (mmol/L)]/22.5 [4] and HOMA2-IR is calculated using an online HOMA2 calculator released by the Diabetes Trials Unit, University of Oxford available at http://www.dtu.ox.ac.uk/homacalculator/index.php (updated January 8, 2013).
The original HOMA1-IR equation proposed by Matthews in 1985 [4] was widely used due to its simplicity, however it was not always reliable because it did not consider the variations in the glucose resistance of peripheral tissue and liver, or increases in the insulin secretion curve for blood glucose concentrations above 10 mmol/L (180 mg/dL) or the effect of circulating levels of pro-insulin. [6]. The updated HOMA2-IR computer model [5] has been used since 1998 and corrects for these.
Cut-off for insulin resistance using the original Matthews values (1985) [4] for HOMA-IR ≥ 2.7
Insulin sensitive is considered less than 1.0
Healthy is considered 0.5-1.4
Above 1.8 is early insulin resistance
Above 2.7 is considered significant insulin resistance
Cuff-off values for insulin resistance using the HOMA2-IR calculator (1998) [5] is HOMA2-IR ≥ 1.8. Three population based studies found the same or very close cut-offs applied, including a 2009 Brazilian study [7] which found HOMA2-IR ≥ 1.8, a 2014 Venezuelan study [8] which found HOMA2-IR ≥ 2.0 and a 2014 Iranian study [9] which found HOMA2-IR ≥ 1.8.
Use of HOMA-IR to Assess Insulin Resistance and β-cell Function in the Individual
HOMA-IR has been used to assess Insulin Resistance (IR) and β-cell function as a one-off measures in >150 epidemiological studies of subjects of various ethnic origins, with varying degrees of glucose tolerance [10].
In the Mexico City Study which used single glucose-insulin pairs (not the mean of three samples at 5-min intervals) [11], β-cell function and Insulin Resistance were assessed using HOMA-IR in ~1500 Mexicans with normal or impaired glucose tolerance (IGT) (27). Subjects were followed up for 3.5 years for the incidence of diabetes and to examine any possible relationship with baseline β-cell function and IR. At 3.5 years, ~4.5% of subjects with normal glucose tolerance at baseline and ~23.5% with impaired glucose tolerance at baseline had progressed to type 2 diabetes. That is, the development of diabetes was associated with higher HOMA-IR at baseline.
The use of HOMA-IR on an individual basis enables clinicians to quantify both the degree of insulin sensitivity and β-cell function on assessment — before the person makes any dietary changes. Once the individual understands the significance of their HOMA-IR results, it can provide significant motivation for them to make dietary changes to slow– or prevent the progression toward abnormal glucose tolerance, or type 2 diabetes. When HOMA-IR is repeated 6 months into dietary changes, it provides significant feedback to the individual regarding the effectiveness of of dietary changes, and the motivation to continue.
“HOMA-IR can be used to track changes in insulin sensitivity and β-cell function longitudinally in individuals. The model can also be used in individuals to indicate whether reduced insulin sensitivity or β-cell failure predominates.[10]
Measuring Hyperinsulemia
Detection of hyperinsulinemia (high circulating levels of insulin) can occur using an Oral Glucose Sensitivity Index (OGIS) where available, or with a 2-hr Oral Glucose Tolerance Test (2-hr OGTT) with simultaneous assessors of insulin. These are tests where a fasting person drinks a known amount of glucose (usually 75 g or 100 g of glucose) and their blood sugar and insulin values are measured before the test starts (baseline, while fasting) and at 2 hours. An additional assessor of blood glucose and insulin can be requested at 1 hour which is very helpful for detecting abnormalities that would missed if only assessing at fasting and at 2 hours. In the OGIS, both blood glucose and blood insulin levels are measured at baseline (fasting), at 120 minutes and at 180 minutes[3].
Final thoughts…
As mentioned at the start of this article, abnormalities in insulin, including insulin resistance and/or hyperinsulinemia begin to occur as much as 20 years before a diagnosis of type 2 diabetes — while blood sugar results are still normal. That is when we need to diagnose abnormalities!
If we simply monitor fasting blood glucose, we will miss that someone’s pancreas may be overworking.
Even if we monitor fasting blood glucose and glycated hemoglobin (HbA1C), we can miss that someone’s pancreas is overworking by constantly producing too much insulin.
Furthermore, even if a standard 2 hour Glucose Tolerance Test is run and the person’s fasting blood glucose and 2 hour glucose level after a load is measured, we still can miss that someone’s pancreas is being pushed way too hard if those values appear normal at baseline and at the end of the test.
By running a 2 hour Glucose Tolerance Test with simultaneous glucose and insulin at baseline (fasting), 30 minutes or 1 hour, and at 2 hours we can observe the pancreas being pushed way too hard and implement dietary changes to avoid further β-cell damage or β-cell death.
In British Columbia, the cost of a standard 2 hour Oral Glucose Tolerance Test is $11.82 before tax and $13.36 with HST.
Each additional glucose assessment is $3.48 before tax and $3.93 after tax.
Each insulin assessment costs $32.82 before tax and $37.09 after tax, so a 2 hour Oral Glucose Tolerance Test with additional glucose assessor at 1 hour and 3 insulin assessors at fasting, 1 hour and 2 hour costs as follows;
2 hour Oral Glucose Tolerance (fasting, 2 hours) = $ 13.36 with HST
additional glucose at 1 hour = $ 3.93 with HST
3 insulin assessors at fasting, 1 hour, 2 hours = $111.27 with HST
TOTAL = $128.56 with HST
When there are clinical reasons to suspect that a person may be insulin resistant and/or hyperinsulinemic and assessment of simultaneous glucose and insulin function can provide sufficient motivation for individuals to implement dietary changes that can prevent progression to type 2 diabetes, is this testing not worth <$130?
NOTE (March 9, 2021): Some family medicine doctors won’t order tests to assess insulin along with glucose in order to “save healthcare system dollars” — but instead will send their patient to an endocrinologist which costs the system ~$300 before any tests are run. Why? In parts of Canada, if audited, family medicine physicians have to re-pay for preventative tests (which are deemed “unnecessary”) . Self-paying for these tests is an option to consider.
If you would like to know about the services that I offer, please click on the Services tab to learn more and if you have questions related to these, please send me a note using the Contact Me form located on the tab above and I will reply as I am able.
To your good health!
Joy
You can follow me at:
https://twitter.com/lchfRD
https://www.facebook.com/lchfRD/
https://www.instagram.com/lchf_rd
Copyright ©2019 The LCHF-Dietitian (a division of BetterByDesign Nutrition Ltd.)
LEGAL NOTICE: The contents of this blog, including text, images and cited statistics as well as all other material contained here (the ”content”) are for information purposes only. The content is not intended to be a substitute for professional advice, medical diagnosis and/or treatment and is not suitable for self-administration without the knowledge of your physician and regular monitoring by your physician. Do not disregard medical advice and always consult your physician with any questions you may have regarding a medical condition or before implementing anything you have read or heard in our content.
References
- Sagesaka H, S.Y., Someya Y, et al, Type 2 Diabetes: When Does It Start? Journal of the Endocrine Society, 2018. 2(5): p. 476-484.
- Mechanick JI, G.A., Grunberger G, et al, Dysglycemia-Based Chronic Disease: an American Association of Clinical Endocrinologists Position Paper. Endocrine Practice, 2018. 24(11): p. 995-1011.
- Crofts, C., Understanding and Diagnosing Hyperinsulinemia. 2015, AUT University: Auckland, New Zealand. p. 205.
- Matthews, D. R; Hosker, J. P; Rudenski, A. S; Naylor, B. A; Treacher, D. F; Turner, R. C; “•Homeostasis model assessment: insulin resistance and β-cell function from fasting plasma glucose and insulin concentrations in man”–; Diabetologia; July, 1985; Volume 28, Number 7: Pp 412-419
- Levy JC, Matthews DR, Hermans MP. Correct homeostasis model assessment (HOMA) evaluation uses the computer program. Diabetes Care. 1998;21:2191—2192
- Song YS, Hwang Y-C, Ahn H-Y, Comparison of the Usefulness of the Updated Homeostasis Model Assessment (HOMA2) with the Original HOMA1 in the Prediction of Type 2 Diabetes Mellitus in Koreans, Diabetes Metab J. 2016 Aug; 40(4): 318—325
- Geloneze B, Vasques AC, Stabe CF et al, HOMA1-IR and HOMA2-IR indexes in identifying insulin resistance and metabolic syndrome: Brazilian Metabolic Syndrome Study (BRAMS), Arq Bras Endocrinol Metabol. 2009 Mar;53(2):281-7
- Bermíºdez V, Rojas J, Martínez MS et al, Epidemiologic Behavior and Estimation of an Optimal Cut-Off Point for Homeostasis Model Assessment-2 Insulin Resistance: A Report from a Venezuelan Population, Int Sch Res Notices. 2014 Oct 29;2014:616271
- Tohidi M, Ghasemi A, Hadaegh F, Age- and sex-specific reference values for fasting serum insulin levels and insulin resistance/sensitivity indices in healthy Iranian adults: Tehran Lipid and Glucose Study, Clin Biochem. 2014 Apr;47(6):432-8
- Wallace TM, Levy JC, Matthews DR, Use and Abuse of HOMA Modeling, Diabetes Care 2004 Jun; 27(6): 1487-1495. https://doi.org/10.2337/diacare.27.6.1487
- Haffner SM, Kennedy E, Gonzalez C, Stern MP, Miettinen H: A prospective analysis of the HOMA model: the Mexico City Diabetes Study. Diabetes Care 19:1138—1141, 1996