
Last Monday, I went to the lab for updated blood work, including a thyroid hormone panel, additional thyroid antibody tests, and an iron panel. I have moved past the frustration of there being no pricelist available for consumers who are self-paying for lab tests, and am now focusing on the lab test results, and the dietary changes that I need to make in light of those, as I am recovering from hypothyroidism.
DISCLAIMER: This article is a personal account posted under A Dietitian’s Journey. The information in this post should in no way be taken as a recommendation to self-diagnose, self-interpret diagnostic tests, or self-treat any suspected disorder. It is essential that people who suspect they may have symptoms of any condition consult with their doctor, as only a medical doctor can diagnose and treat.
The results came back late Monday afternoon and I met with my doctor to discuss them on Thursday, The good news is that based on calculation estimates converting the bovine Natural Desiccated Thyroid (NDT) medication that I had been taking, to a mixture of Synthroid® (a synthetic T4 medication) and Cytomel® (a synthetic T3 medication), my free T4 and free T3 are almost perfect. As my doctor said when we met, “between your research and my experience, we got this“.
This is a beautiful picture.
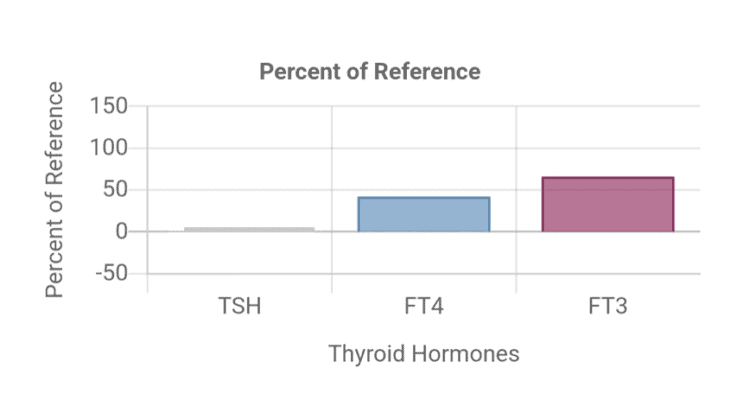
It shows, as my doctor and I had hoped, that my free T3 (the active thyroid hormone) is in the higher part of the reference range (65.5%); a level considered optimal by endocrinologists and thyroidologists who are well-versed in the use of the combination T4/T3 medications that I have been prescribed.
While my free T4 could be in the higher part of the range on the type of medication that I am taking, it may slightly lower because of the feedback from having sufficient free T3. That’s okay! I am feeling so much better, although it will take another year or more until I am really well again.
As expected, my TSH (Thyroid Stimulating Hormone, the pituitary hormone that tells the body how much thyroid hormone to make) is low because the amount of free T3 is optimal. This is a classic feedback loop where free T3 provides feedback on the pituitary gland, indicating that there isn’t a need to make more thyroid hormone. Think of it like a thermostat. When the room gets warm enough, there is feedback on the thermostat that no additional heat is required, and it turns it off until the room gets cold again.
Of importance, my TSH is not considered “suppressed” (TSH ≤0.03 mU/L) but “low” (TSH = 0.04-0.4 mU/liter) [1], so there is no increased risk of cardiovascular disease or bone fractures. Those with a “high” TSH (>4.0 mU/liter) — which was the level that I was at before being treated, and those with a “suppressed” TSH (≤0.03 mU/L) both have an increased risk of cardiovascular disease, abnormal heart rhythms and bone fractures. Those with “low” TSH (0.04-0.4 mU/liter) like I have, do not [1,2]. So more good news.
I have been diagnosed with Hashimoto’s disease (also known as Hashimoto’s thyroiditis) which is an autoimmune disease and diagnosis is based both on symptoms of hypothyroidism, along with the presence of thyroperoxidase antibodies (TPO-ab) and thyroglobulin antibodies (TG-ab) in the blood [3].
In many cases of hypothyroidism, it is these antibodies that contribute to the gradual disappearance of thyroid cells and the development of hypothyroidism. In my case, it was the trauma to the thyroid that resulted from surgery that I had 30 years ago to remove a benign tumour that was the major contributor to the eventual decrease in thyroid function.
Prior to being diagnosed, as you can read about here, I had all the classic symptoms of hypothyroidism, including body aches, joint pain, fatigue, feeling chilled, constipation, dry skin, hair loss, being forgetful, and even feeling depressed.
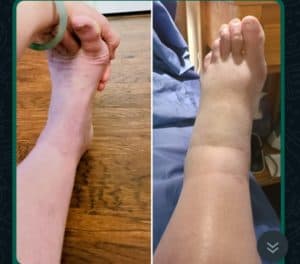
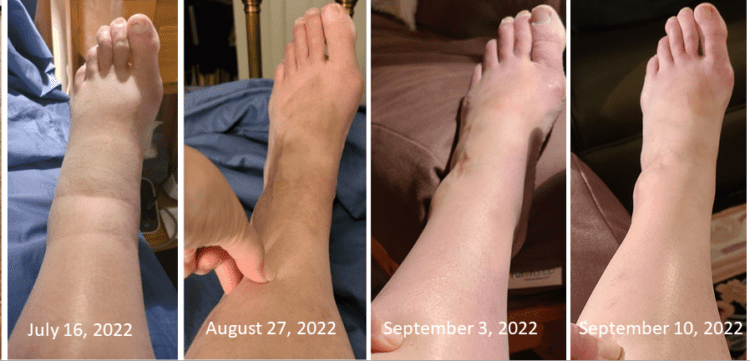
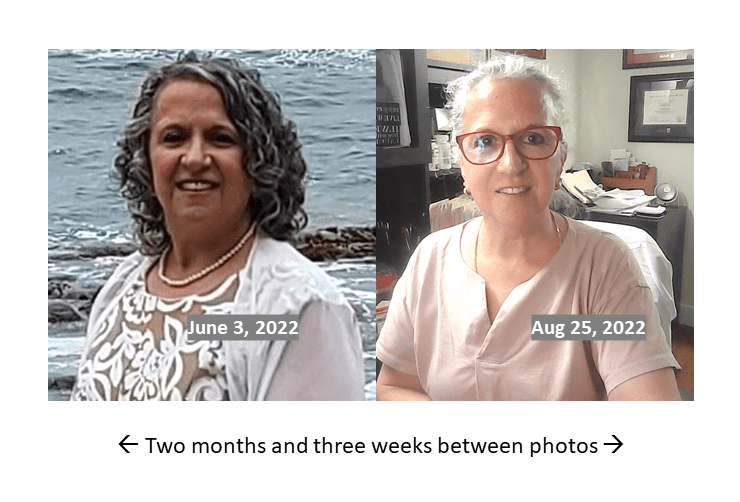
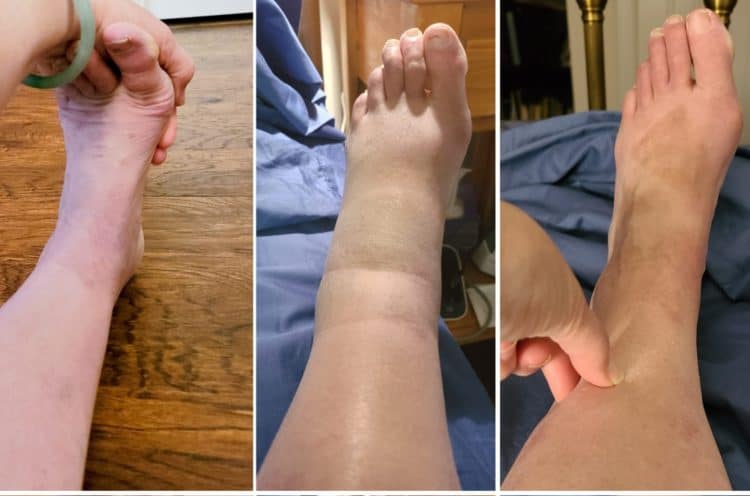
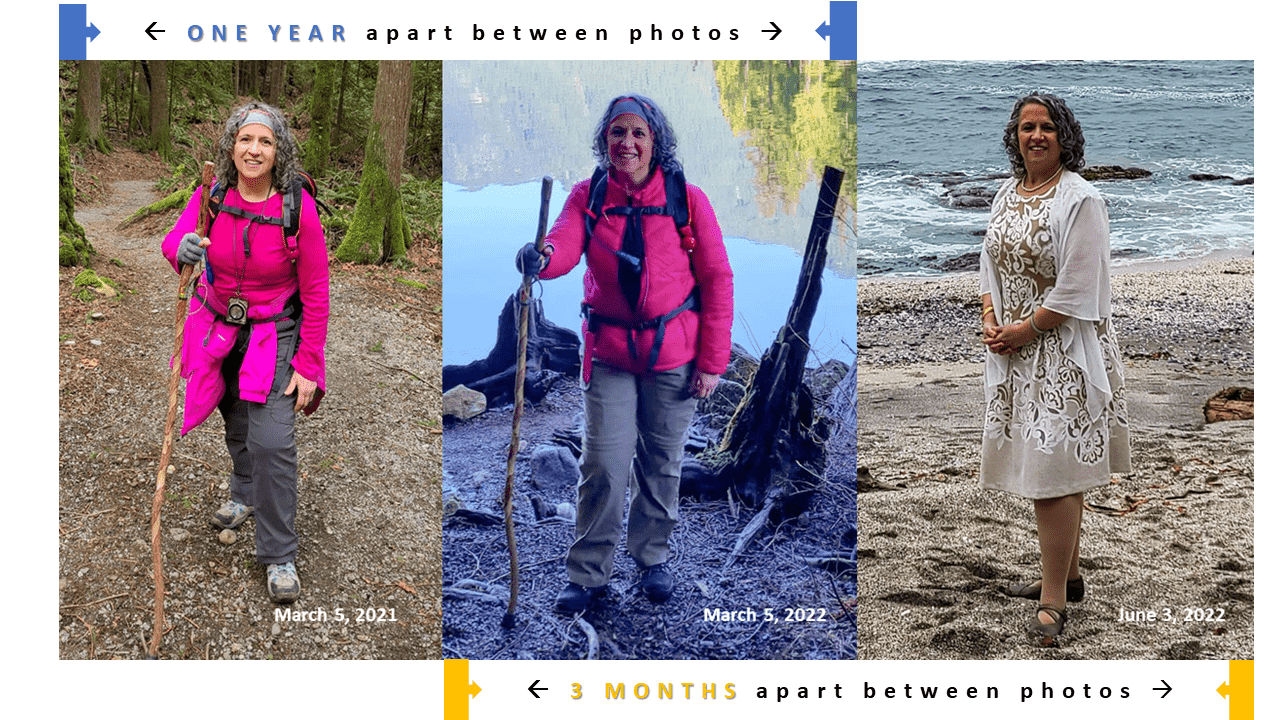
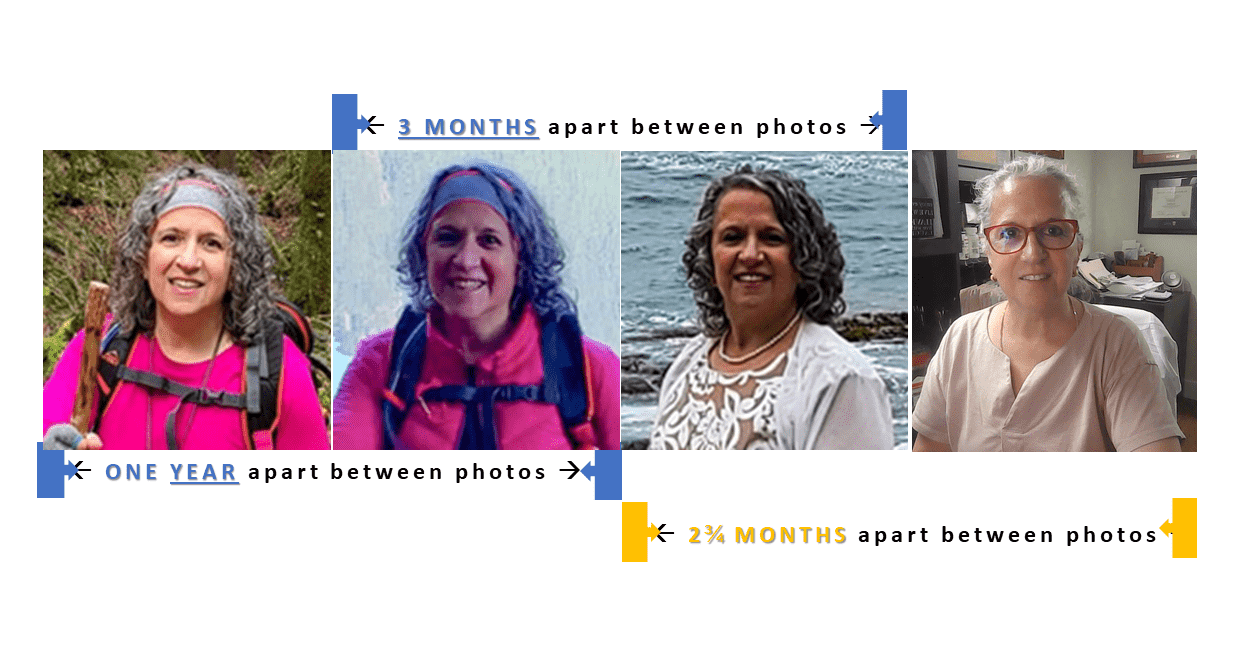
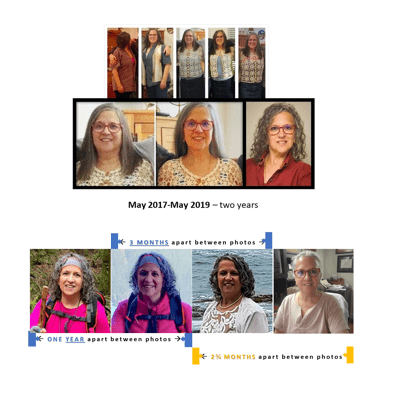
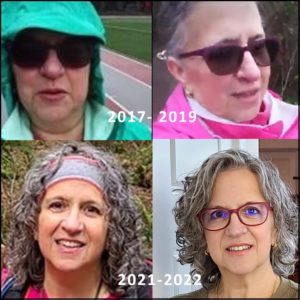
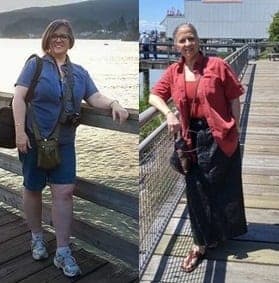
By the point I realized that these symptoms were not consistent with long-Covid (which is what I initially suspected) or aging (which my sons assumed), I had developed some of the symptoms of severe hypothyroidism [3], including difficulty with speech, significant water retention, and peripheral edema (swelling) of the ankles and face [3]. There are more photos of what I looked like when I was very sick here as well as photos from the beginning part of my recovery.
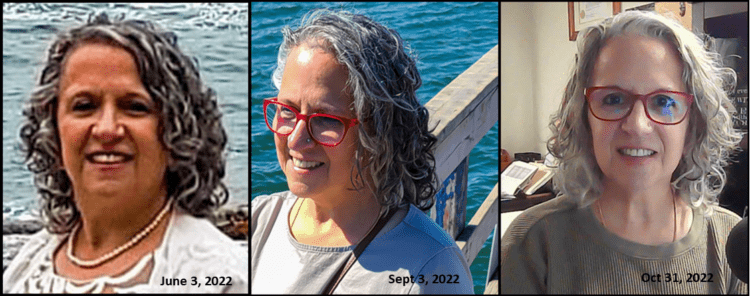
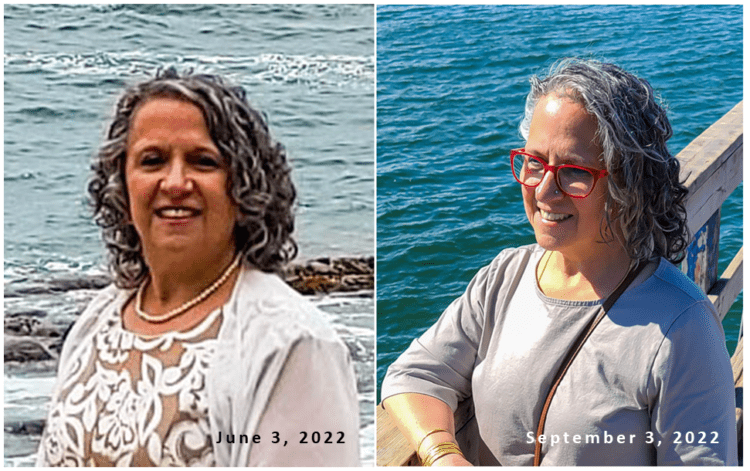
The photo on the left, above is what I looked like on June 3, 2022, at my youngest son’s wedding. I was so sick. I needed help walking on the beach for family photos, getting out of a chair or a car, I ached all over my body and I was beyond exhausted. I knew I was ill and had plans to see my doctor when he returned from vacation but in the meantime, I attended my son’s wedding, without talking about how I felt. No one really knew how sick I felt until afterwards and I didn’t know how seriously ill I really was until August.
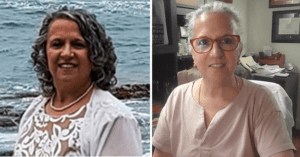
The middle picture, above was taken on September 3, 2022 after losing half my hair as a result of several nutrient deficiencies related to hypothyroidism that I have been correcting through adding specific foods high in these nutrients into my diet, as well as highly bioavailable supplements. At the time the middle picture was taken, I had been on Natural Desiccated Thyroid hormones (natural T4/T3 medication) for 6 weeks. While my doctor wanted me to continue on them because I was doing so much better, I wanted to go on synthetic T4 and T3 thyroid replacement hormones as it would be easier to travel across borders with these recognized medications.
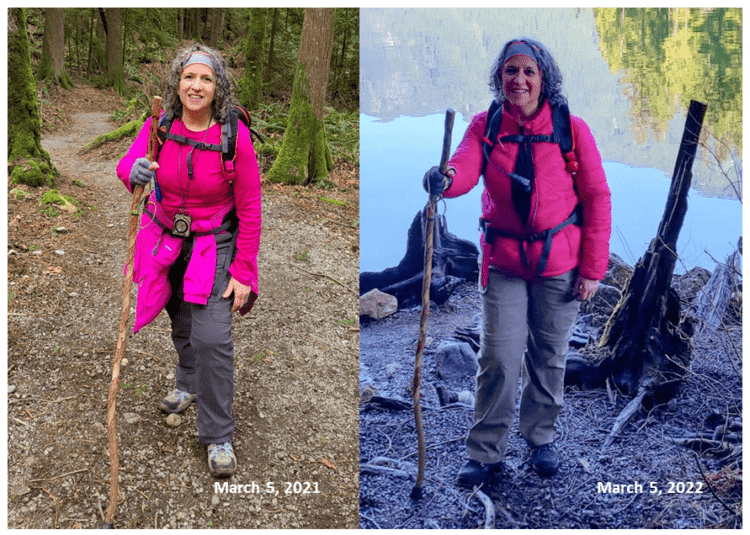
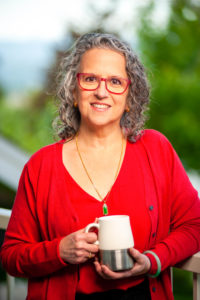
The picture on the right, is me today. I feel as though I have been to “hell and back“. Last week, my doctor said that it will take another year until I feel really well again, and probably another 6 months on top of that until my hair grows back, but I am so thankful for the difference in how I feel the last 5 months. I get tired easily. Hiking is out, and so are evening activities, but as my nutrient status continues to improve and the thyroid hormones permeate all my body’s tissues, I will gradually feel better and better.
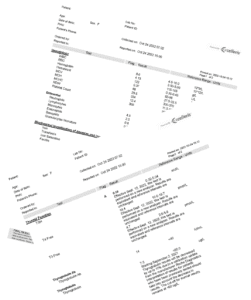 The blood tests confirm that I have both thyroperoxidase antibodies (TPO-Ab) and thyroglobulin antibodies (TG-Ab), which along with my symptoms, confirms my diagnosis of Hashimoto’s disease, but thankfully my blood test results indicate that neither are elevated.
Thyroperoxidase-Ab = 9 (<35 IU/mL)
Thyroglobulin Ab = 14 (<40 IU/mL)
While they are not elevated, they are present.
Gliadin and Transglutaminase
For many years I avoided gluten containing products because I thought I was gluten intolerant, although not celiac.
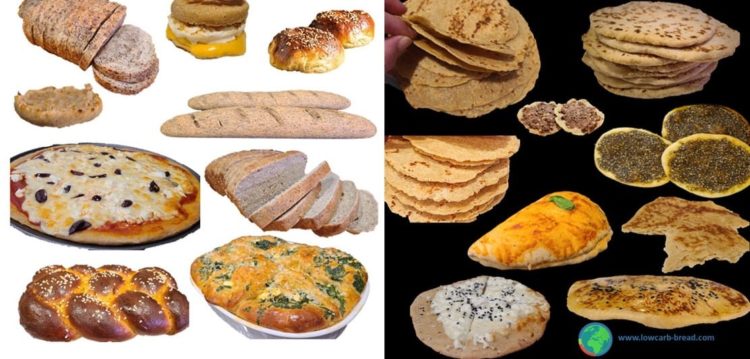
A year ago that I stumbled across some novel ingredients and had an idea to create low carb breads to provide dietary options for those with diabetes. My goal was to enable people who would not otherwise consider a low carbohydrate diet to be able to adopt one, for health reasons. I was mainly thinking of those from bread-centric cultures such as South East Asians (Indian) and Hispanics but in time, I developed many more types of low carb bread.
I was aware of the connection between high gluten consumption and leaky gut syndrome, but against that I weighed the serious morbidity and mortality linked to uncontrolled diabetes. I had come across many people who would rather stay diabetic, and potentially lose their toes or vision than give up bread and developing these breads seemed like the lesser of two evils.
Since being diagnosed with hypothyroidism that I had been developing over the previous 9 years (more about that here), I learned that the gliadin fraction of gluten structurally resembles transglutaminase. Transglutaminase is an enzyme that makes chemical bonds in the body, and while present in many organs, there are higher concentrations of transglutaminase in the thyroid.
In leaky gut syndrome, gliadin (and other substances) result in the gaps in between the cells of the intestinal wall to widen. This results in the immune system of the body reacting to food particles that are inside the intestine, that it normally would not see. It is thought that the immune system reacts to gliadin and creates antibodies to it, seeing it as a foreign invader. Since gliadin and transglutaminase have very similar structural properties, it is thought that in those with leaky gut syndrome, the immune system begins to attack the transglutaminase in the thyroid, and other tissues, contributing to the development of auto-immune conditions, including hypothyroidism.
A-1 Beta Casein and Gluten
A few years ago, I had leaky gut syndrome but it resolved with dietary changes, including avoiding gluten and A-1 beta casein dairy (you can read about what A-1 beta casein dairy is here). Naturally, as I had been working on recipe development for the low carb bread book, I had been eating gluten as I tested them. I also became more liberal in including dairy products from A1-beta casein cows, when I hadn’t used it in years. That started when there was severe flooding last year in Chilliwack last year due to heavy rains after the summer, and that was where my goat milk came from. Even once the roads were open again and the highways rebuilt, I never really went back to using goat milk, which is naturally A-2 beta casein. In the interest of an abundance of caution, I will go back to using dairy products from A-2 beta casein cows, or from goat or sheep milk (that are naturally A-2). Humans produce A-2 beta casein protein, and using milk from A-2 beta casein animals does not result in an immune response. It is not seen as “foreign.”
From what I’ve read and in discussing it with my doctor, it is likely that my hypothyroidism has been developing over the last 30 years, related to the surgery I had to remove a benign tumour. Further supporting that me becoming hypothyroid has been a long time in the making, I have had high-normal levels of TSH over the last 9 years — which happens to be a time period over which I was avoiding both gluten and A-1 dairy. Given that, I think it’s logical to conclude that my hypothyroidism is primarily related to the destruction of thyroid tissue in the invasive surgery connected to removal of the tumour. Further supporting this hypothesis, I currently have fairly low levels of TPO and TG antibodies, so I suspect they have begun developing fairly recently. Since a 2018 study reported that both TPO-antibodies and TG antibodies are decreased in hypothyroid patients following a gluten-free diet [4], it seems wise for me to go back to avoiding gluten, with the goal of lowering my TPO-antibodies and TG-antibodies down to as close to zero, as possible.
Cruciferous Vegetables
Cruciferous vegetables such as Brussels sprouts, broccoli, bok choy, cauliflower, cabbage, kale are known goitrogens. Goitrogens are naturally occurring substances that are thought to inhibit thyroid hormone production. The hydrolysis of a substance known as pro-goitrin that is found in cruciferous vegetables produces a substance known as goitrin, that is thought to interfere with thyroid hormone synthesis [5]. Since cooking cruciferous vegetables limits the effect on the thyroid function, and eating cruciferous vegetables have many health benefits, I will usually eat them cooked, but not in huge quantities. There are studies that found a worsening of hypothyroidism when people ate very large quantities of these (e.g. 1 – 1 ½ kg / day) so it is recommended that intake of these vegetables be kept relatively constant day to day, and limited to no more than 1-2 cup / day. I’ve decided that when I do eat them, to keep intake to the lower end of that range, and eat more non-cruciferous vegetables instead.
Iron Deficiency and Low Stomach Acid (hypochlorhydria)
I now know why I am still so tired. I asked my doctor to run an iron panel and the results show I have low iron. Previous results indicate my vitamin B12 are fine and I continue to supplement methylated folate and B12, so I know those are not a problem.
While my iron stores (ferritin) are okay, they are not optimal i.e., ferritin = 93 (15-247 ug/L) instead of >100ug/L.
My hematology panel is low-normal i.e. hemoglobin = 122 (115-155 g/L), hematocrit = 0.37* (0.35-0.45 L/L), MCV = 88 (82-98 fl), MCH = 29.5 (27.5-33.5 pg), MCHC = 334 (300-370 g/L)
My serum iron and iron saturation are very low i.e., serum iron = 11.9 (10.6-33.8 umol/L), iron saturation = 0.15 (0.13-0.50)
Low iron status is common with hypothyroidism, but it was surprising to me because I eat beef liver, or chicken livers every week, and also take a heme polysaccharide supplement (like Feramax®), so it may be due to an absorption problem.
Low stomach acid (hypochlorhydria) is common in hypothyroidism, and since low pH is needed for iron absorption, I have made dietary changes to improve that.
Final Thoughts…
I am very grateful that my doctor recognizes my knowledge as a clinician and is receptive to me advocating for my health. I am incredibly fortunate that he involves me in decisions regarding blood tests, as well as discussing medication types and dosages. As for the dietary changes and supplementation, he is content to let me handle that!
I hope that out of my experience that I have called “to hell and back” that I am able to help others better understand hypothyroid symptoms, diagnosis and treatment options so that they can discuss them with their doctor.
To your good health,
Joy
You can follow me on:
Twitter: https://twitter.com/lchfRD
Facebook: https://www.facebook.com/lchfRD/
Instagram: https://www.instagram.com/lchf_rd
Articles about Hypothyroidism
-
- 10/14 – Hypothyroidism Signs and Symptoms – a downloadable checklist
- 10/06 – Hair Loss (Part 2) – Nutrients of Importance for the Thyroid
- 09/04 – Hair Loss – root causes (Part 1)
- 08/26 – More Than Skin Deep – skin symptoms associated with hypothyroidism
- 08/12 – Beyond Diet – the role of hormones in metabolic health
- 08/07 Symptoms of Hypothyroidism Mistakenly Blamed on Aging
- 07/14 – Thyroid Function Assumed to be Normal When Only TSH is Tested
References
- van Vliet NA, Noordam R, van Klinken JB, et al. Thyroid Stimulating Hormone and Bone Mineral Density: Evidence From a Two-Sample Mendelian Randomization Study and a Candidate Gene Association Study. J Bone Miner Res. 2018;33(7):1318-1325. doi:10.1002/jbmr.3426
- Flynn RW, Bonellie SR, Jung RT, MacDonald TM, Morris AD, Leese GP. Serum thyroid-stimulating hormone concentration and morbidity from cardiovascular disease and fractures in patients on long-term thyroxine therapy. J Clin Endocrinol Metab. 2010;95(1):186-193. doi:10.1210/jc.2009-1625
- Puszkarz, Irena, Guty, Edyta, Stefaniak, Iwona, & Bonarek, Aleksandra. (2018). Role of food and nutrition in pathogenesis and prevention of Hashimoto’s thyroiditis. https://doi.org/10.5281/zenodo.1320419
- Krysiak, R.; Szkróbka, W.; Okopień, B. The Effect of Gluten-Free Diet on Thyroid Autoimmunity in Drug-Naïve Women with Hashimoto’s Thyroiditis: A Pilot Study. Exp. Clin. Endocrinol. Diabetes 2018, 127, 417–422.
- Felker P, Bunch R, Leung AM. Concentrations of thiocyanate and goitrin in human plasma, their precursor concentrations in brassica vegetables, and associated potential risk for hypothyroidism. Nutr Rev. 2016;74(4):248-258.
Copyright ©2022 The LCHF Dietitian (a division of BetterByDesign Nutrition Ltd.)
LEGAL NOTICE: The contents of this blog, including text, images and cited statistics as well as all other material contained here (the ”content”) are for information purposes only. The content is not intended to be a substitute for professional advice, medical diagnosis and/or treatment and is not suitable for self-administration without the knowledge of your physician and regular monitoring by your physician. Do not disregard medical advice and always consult your physician with any questions you may have regarding a medical condition or before implementing anything you have read or heard in our content.
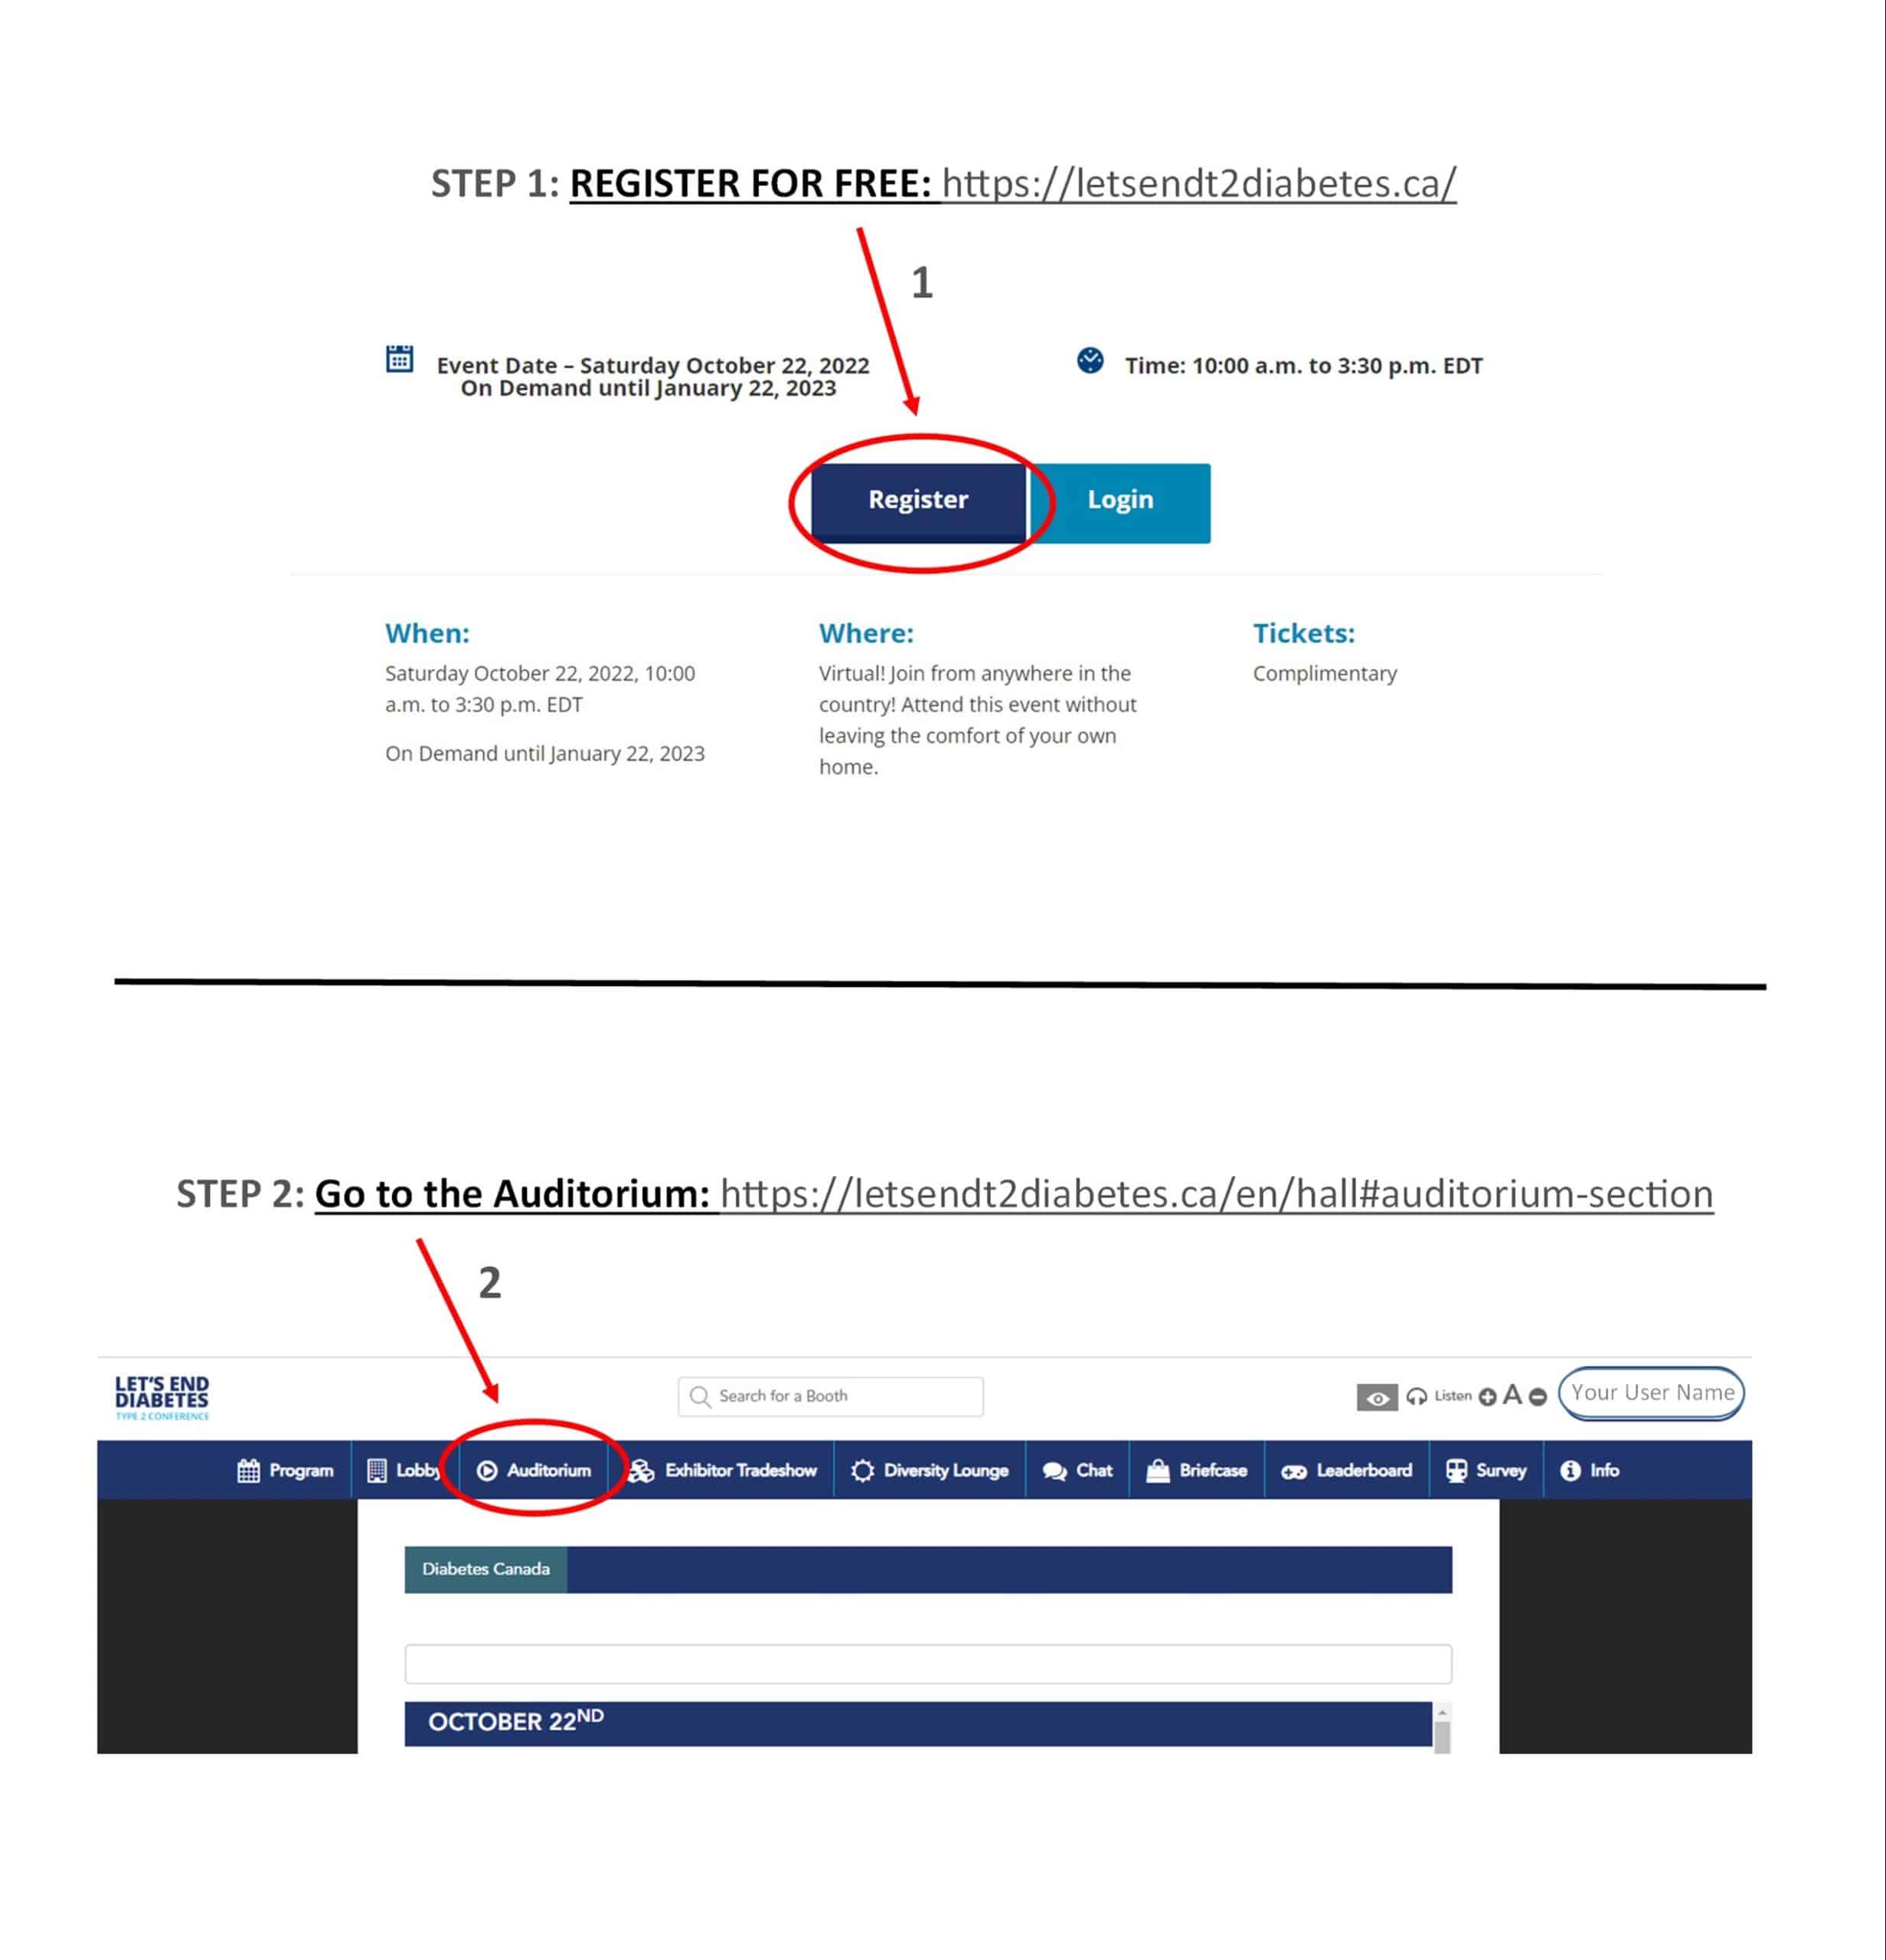
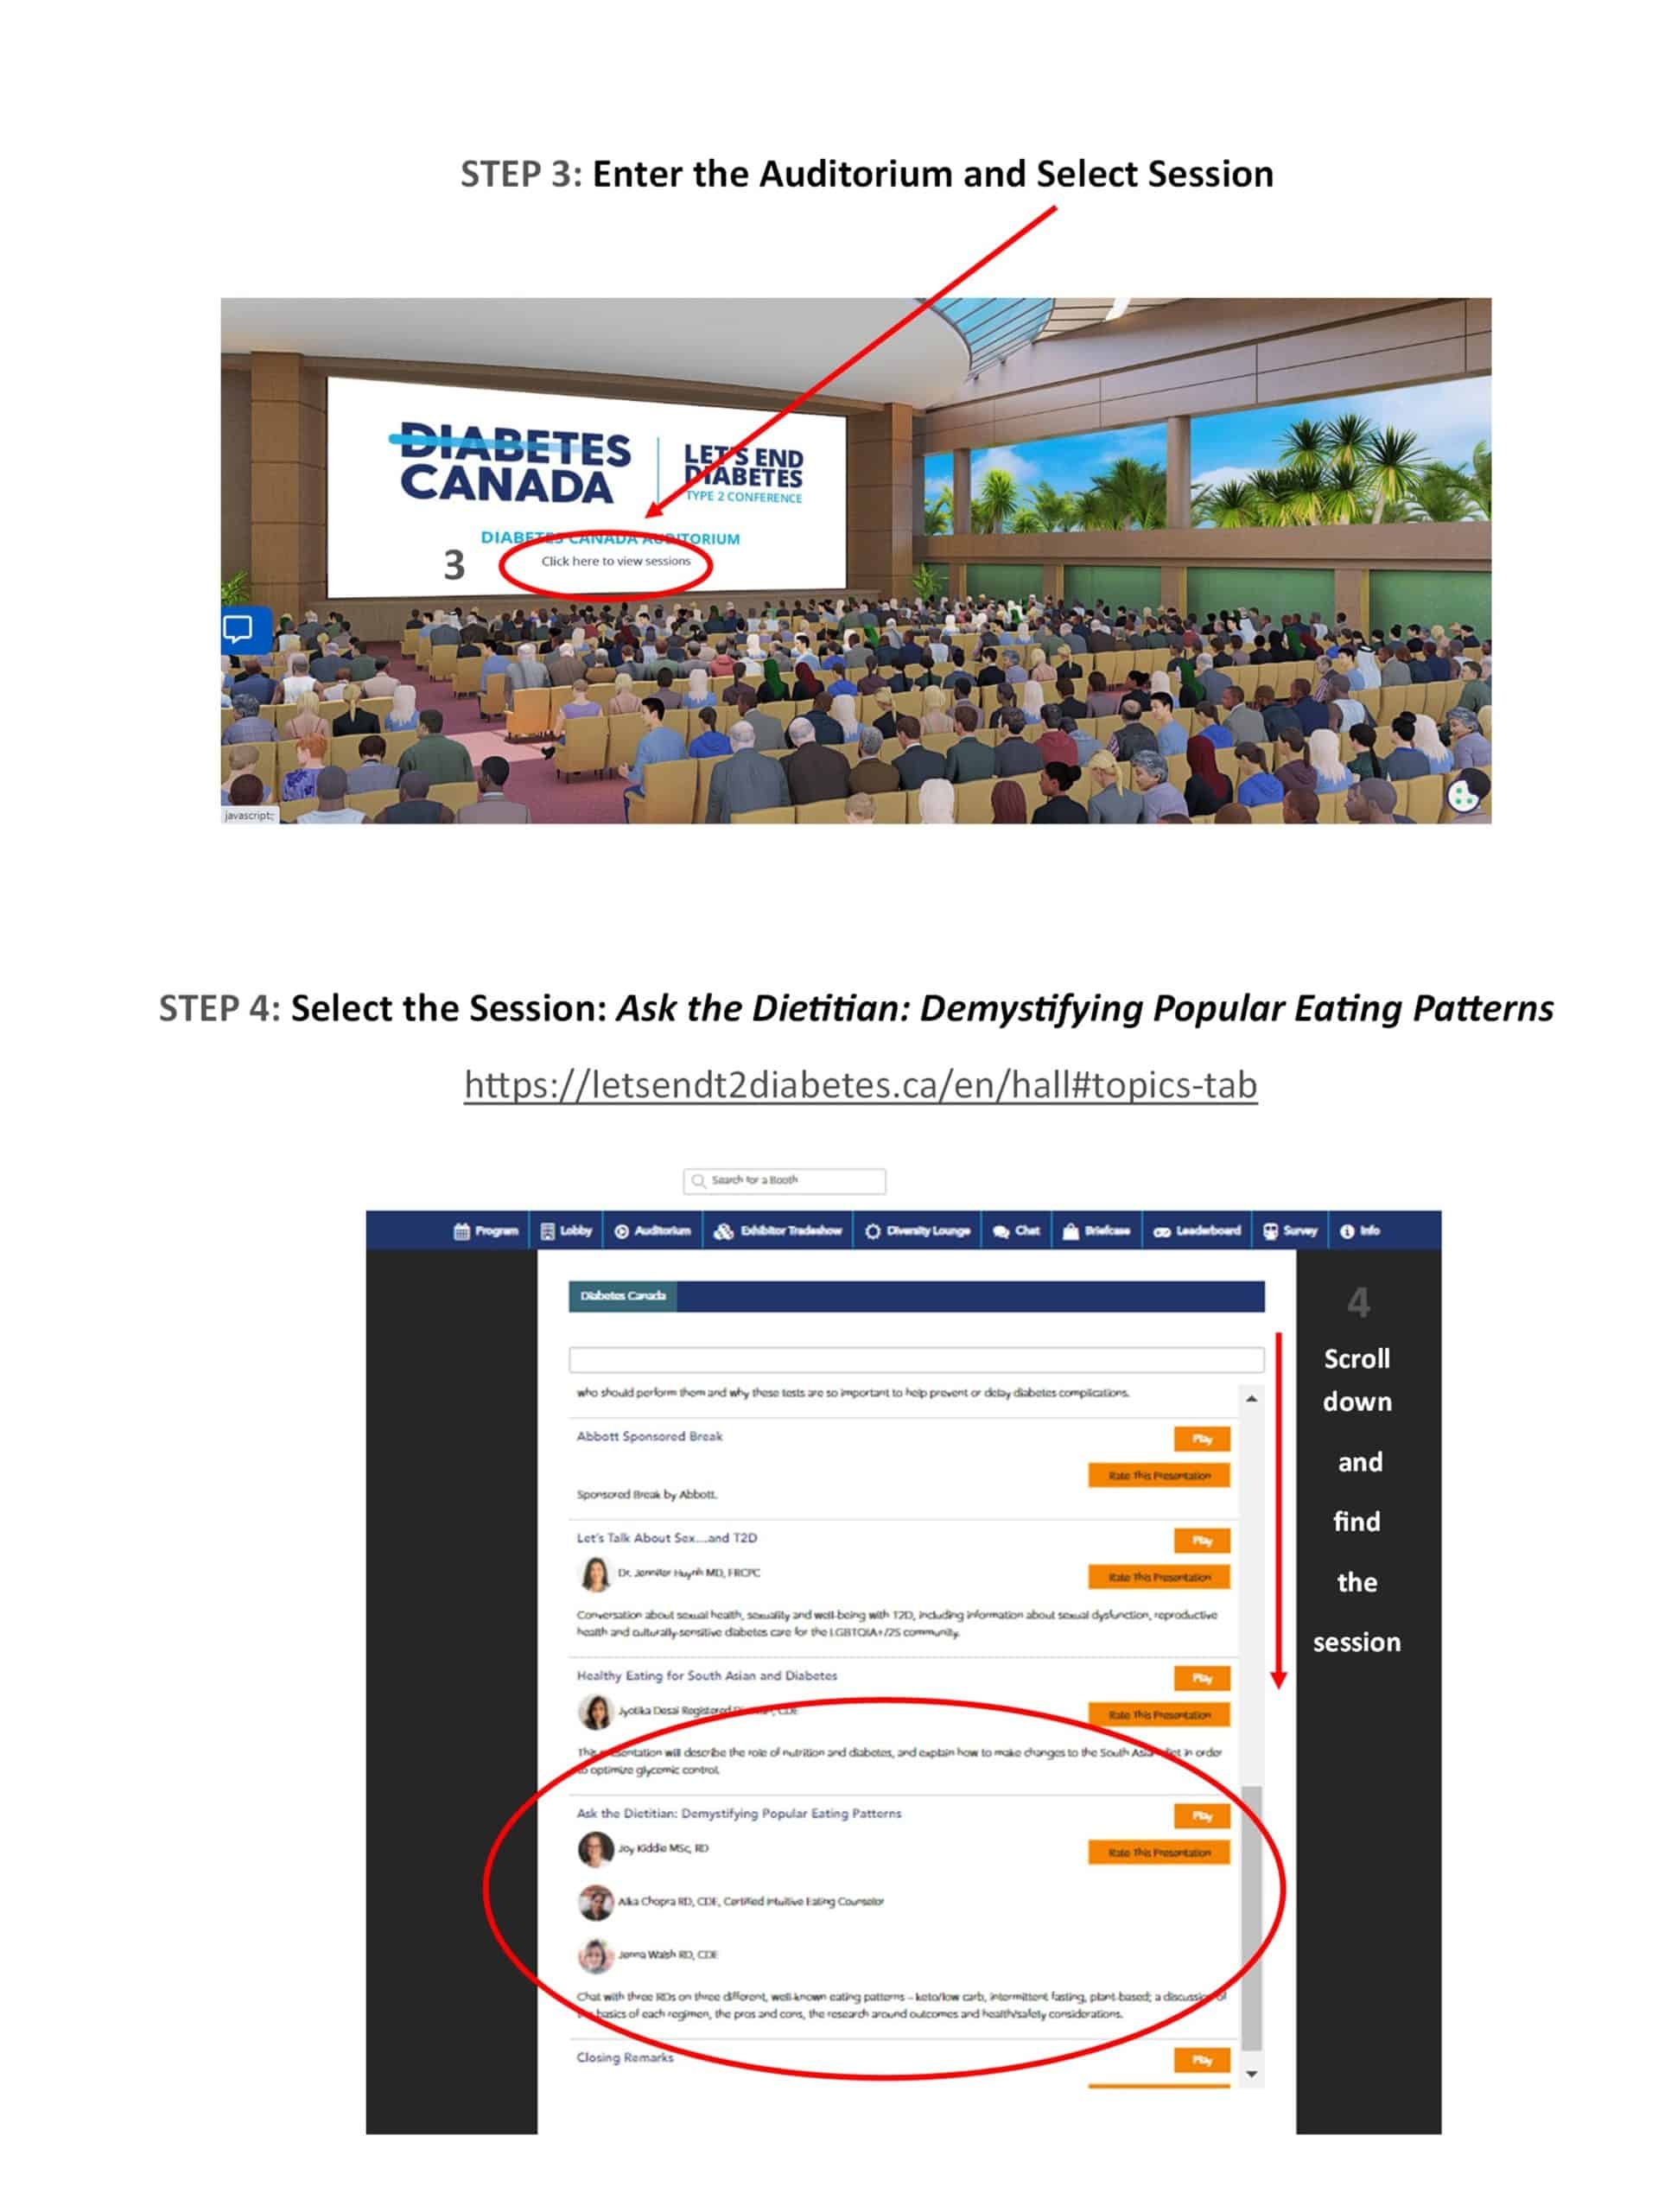
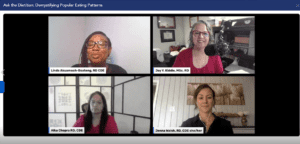 Yesterday (October 22, 2022), I was the Dietitian representing low carb and keto diets in the management of type 2 diabetes at the Diabetes Canada Let’s End Diabetes Virtual Conference. I co-presented with two other Dietitians; Jenna Walsh, RD, CDE who represented intermittent fasting, and Alka Chopra, RD, CDE who represented a plant-based approach.
 My doctor agreed to my request for a thyroid panel [TSH, free T4, and free T3] even though I may have to pay for FT3 because of the provincial guidelines.
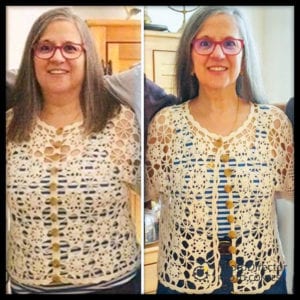
 The next symptom that I became aware of was


 The first question I was asked at the summit was whether I identified as a food addict.
 I was obese, had type 2 diabetes and dangerously high blood pressure — and was a Registered Dietitian with a master’s degree who was in denial as to just how much danger I had put myself in! If you haven’t heard my story, it is under the Food for Thought tab, and titled
 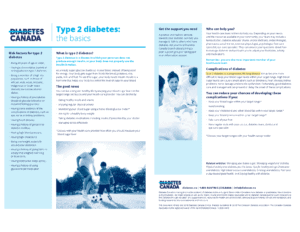 Diabetes Canada in its patient resources on “the basics” of type 2 diabetes states; ”type 2 diabetes is a progressive, life-long disease” [5].
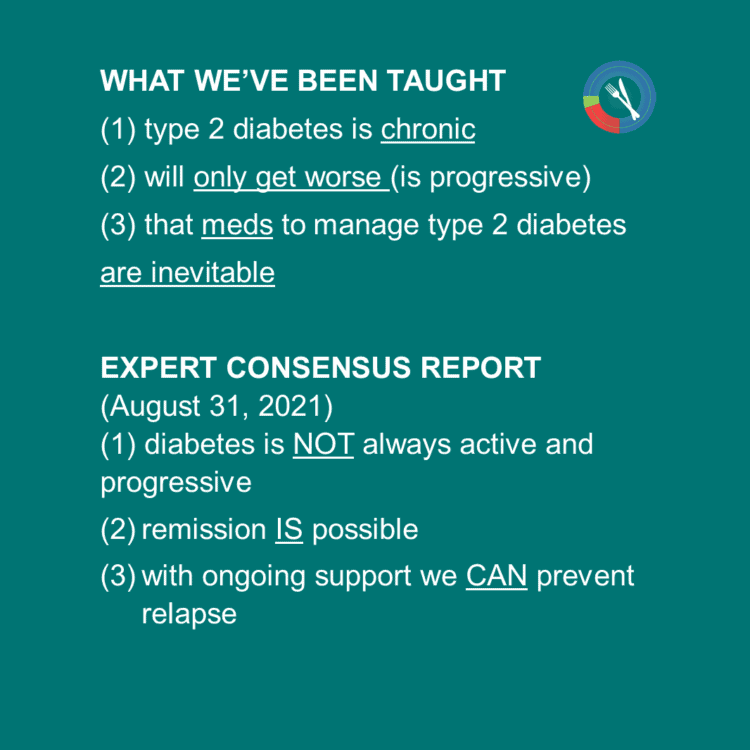
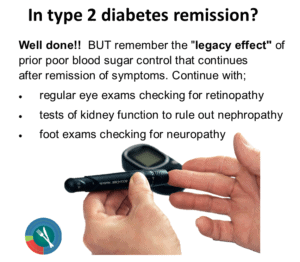 The panel cautions that since there can still be the “legacy effect” of prior poor blood sugar control in various body tissues that continues after remission of symptoms, there is a need not only for ongoing monitoring of HbA1C, but also regular retinal screening for retinopathy, tests of renal function to rule out nephropathy, foot evaluation to rule out neuropathy, as well as measurement of blood pressure and weight to reduce the risk of cardiovascular disease.
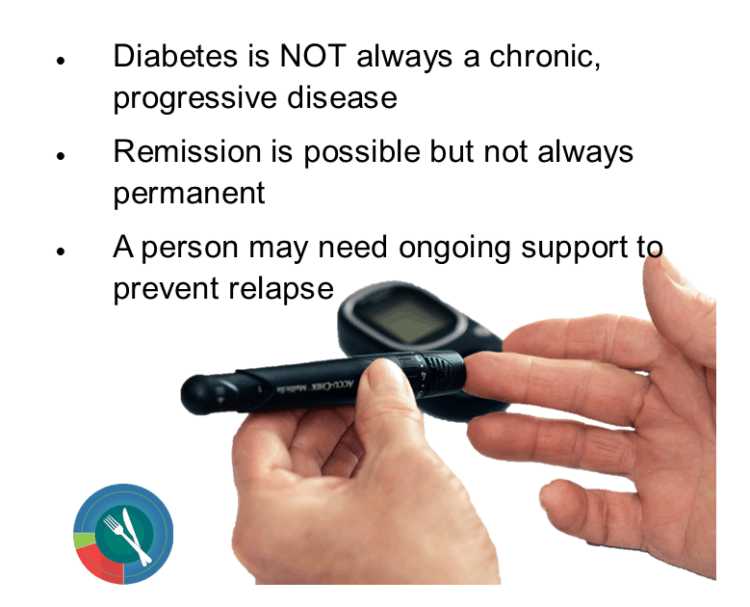
 Ingredients
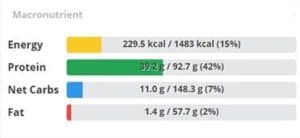
 The P:E Diet

 A
A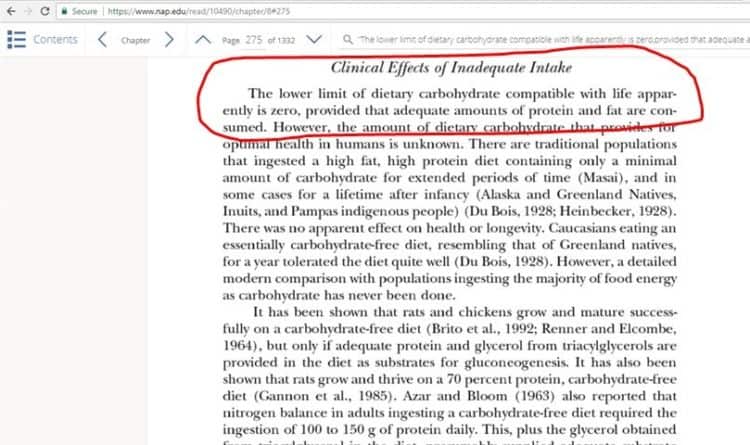
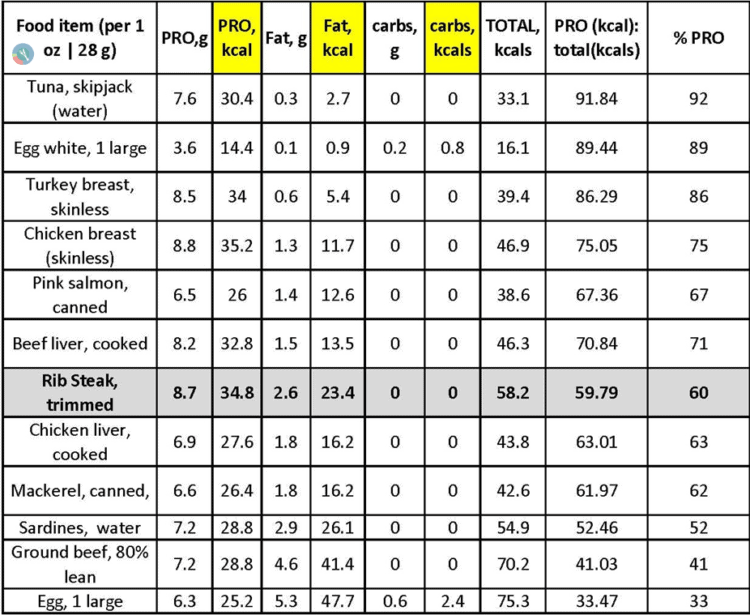
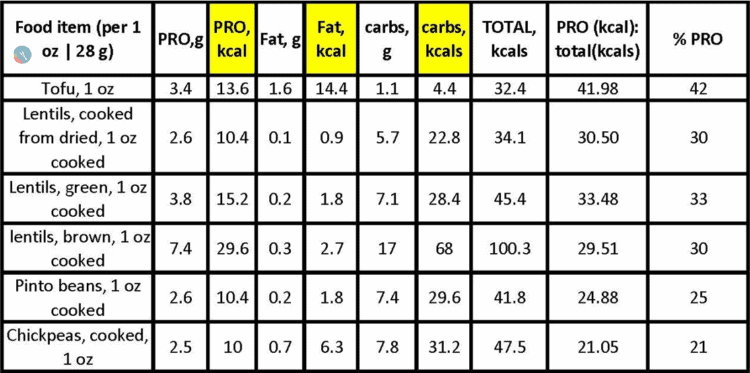
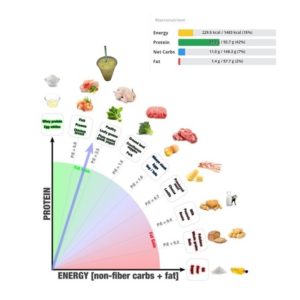
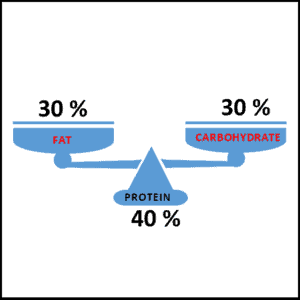
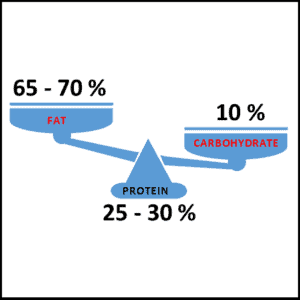
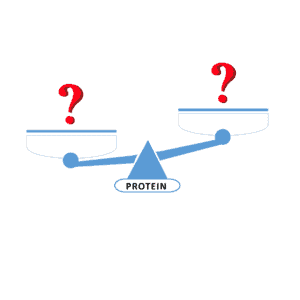
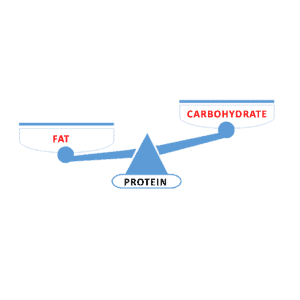
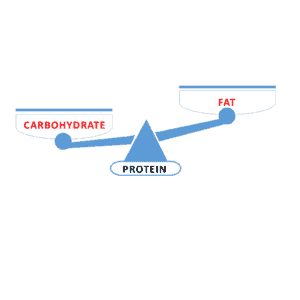
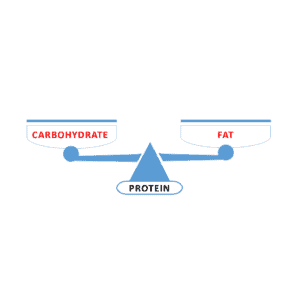
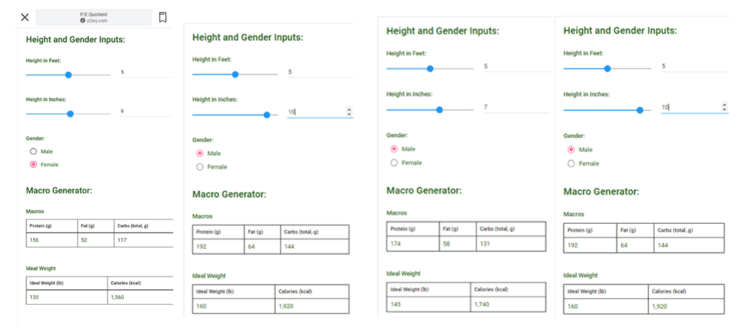
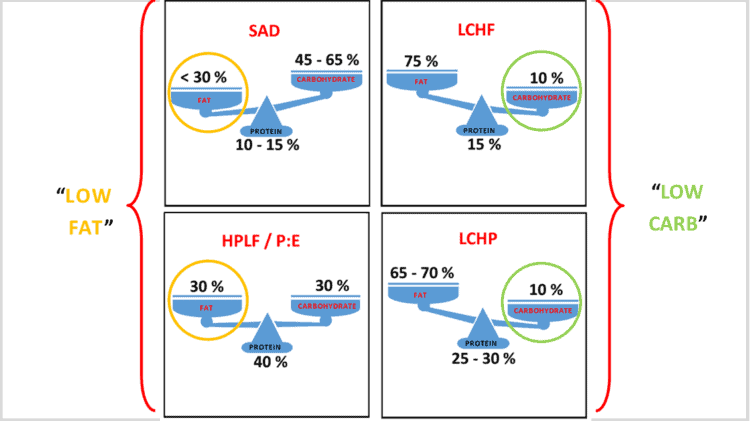
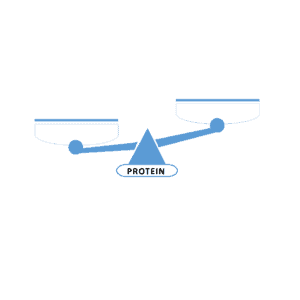 Think of protein as the foundation of a balance scale — providing the body with building blocks for structure and function — and the two arms of a balance scale as the two sources of fuel for energy: carbohydrate and fat.
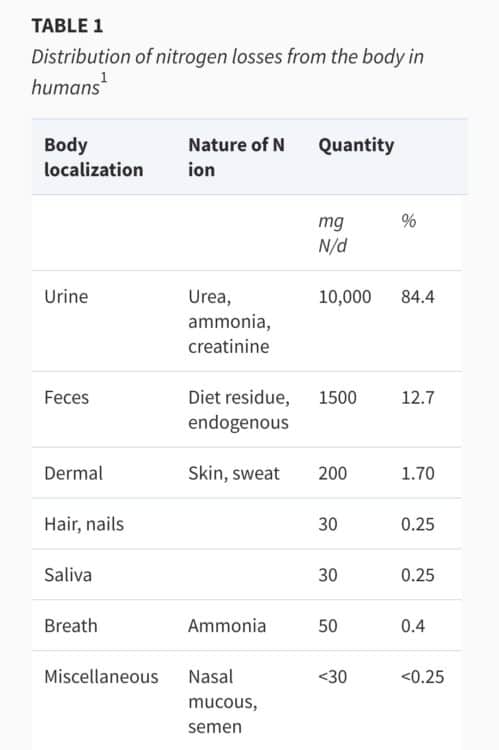
 This graph also from Virta Health [9] and based on the same research shows the long-term loss of body nitrogen (protein) as % of pre-fasting value. While loss of protein slows somewhat after day 10, it continues right up to 60 days.
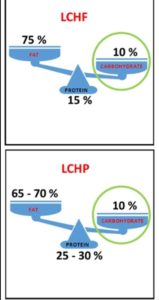 Both a Low Carb High Fat diet and Low Carb High Protein diet are low carb — so both are great for controlling blood sugar.
 The American Diabetes Association in conjunction with the European Association for the Study of Diabetes (EASD) used the above definition of a low carbohydrate diet and very low carbohydrate diet in their joint 2019 Consensus Report [2] and the American Diabetes Association used the same definition in their 2020 Standards of Medical Care in Diabetes [3].
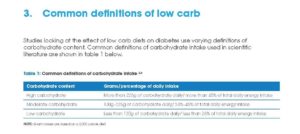 The same definition for a low carbohydrate diet and moderate carbohydrate diet were also used by Diabetes Australia in their 2018 Position Statement on Low Carbohydrate Eating for People with Diabetes [4].

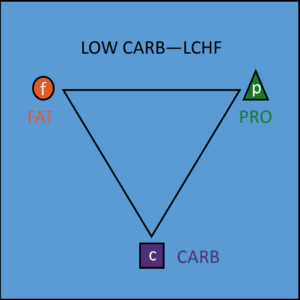 Considering the benefit / risk of more also needs to be considered when contemplating adding “more fat” in a low carb high fat (LCHF) diet (e.g. 75% fat, 15% protein, 10% carbs).
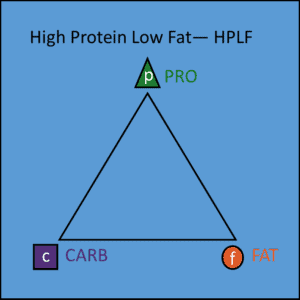 One also needs to consider the benefit / risk of adding “more protein” to a high protein, low fat (HPLF) diet, such as P:E (e.g. 40% protein, 30% carbs, 30% fat).
 In 2018, both Dr. Jason Fung and the Diet Doctor website were promoting a low carb high fat (LCHF) diet of ~75% fat, 15% protein and 10% carbohydrate, but since that time, Dr. Fung has increasingly focussed on the role of regular intermittent- and long term fasting for weight loss and diabetes remission, while continuing to
 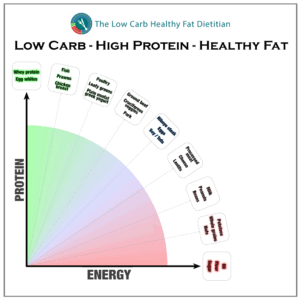 It has been my clinical experience since 2018 that a low carb higher protein diet is an excellent option for those seeking weight loss and remission of type 2 diabetes — especially those who do not do well on a very high fat diet, or for whom regular intermittent or extended fasting is not optimal due to the increased risk of sarcopenia (muscle loss).
 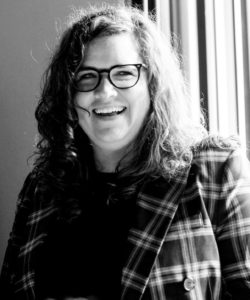 Approximately two years ago, I reached my highest weight of 250 pounds and decided to make one more attempt to lose weight, and began researching low-carbohydrate and ketogenic diets. Through this research, I discovered books, articles, and podcasts about food addiction. As I read and listened, I became certain that I qualified as a food- and sugar addict. I learned that sugar and flour are addictive substances and decided to remove them from my diet. I searched the internet for a dietitian who could help me to formulate a meal plan that eliminated the foods that I found addictive. I discovered Joy’s website and contacted her to schedule a Complete Assessment Package. Joy developed a meal plan for me that excluded the foods that were addictive for me and which allowed me to feel satisfied and energized, while losing weight. For the first time, weight loss did not feel like work.
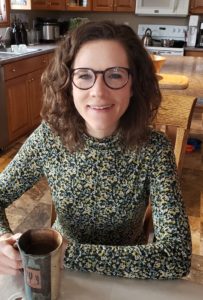 I have lost well over a 100 pounds, and am a normal body weight and a waist circumference. I am so thankful for my weight loss, and my improved physical health. Even more importantly however, my depression has been significantly better, and I am truly enjoying life. In addition, my ADHD symptoms have greatly decreased, and my mental capacity has significantly improved. For the first time in my life, I can complete my work with little procrastinating.
 I feel it is important to add that as a Dietitian, I do not specialize in food addiction or disordered eating — but I do help with the “eating end” of things for those who are getting support for these issues through other means.