
In November 2018, the American Association of Clinical Endocrinologists (AACE) released a Position Statement [1] which identified four separate disease stages associated with an abnormal glucose response, including Type 2 Diabetes;
Stage 1: Insulin Resistance
Stage 2: Prediabetes
Stage 3: Type 2 Diabetes
Stage 4: Vascular Complications — including retinopathy, nephropathy and neuropathy
Long before blood sugar becomes abnormal in the stage known as prediabetes, the progression to type 2 diabetes has already begun in the form of insulin resistance — and identifying insulin resistance at this stage (while blood glucose is still normal) enables people to implement dietary changes to avoid the progression to pre-diabetes, and type 2 diabetes.
Discovering insulin resistance in those who lack the more obvious outward signs can be especially helpful — including those who appear slim, but who may have visceral or ectopic fat (so-called TOFIs, “thin on the outside, fat on the inside”), or those who may have undetected hyperinsulinemia due to their abnormal response to dietary carbohydrate. Some people that fall in this category may include those with a significant family history of type 2 diabetes, or previous gestational diabetes, even though they currently appear healthy.
The Homeostatic Model Assessment (HOMA-IR) is a test that uses a simultaneous fasting blood glucose test and fasting insulin test to accurately estimate the degree of insulin resistance (IR) and β-cell function (the cells of the pancreas that produce insulin). Alternatively, HOMA-IR can also be determined from a simulteous fasting blood glucose test and a fasting C-peptide test [2]. C-peptide is released in proportion to insulin, so it can be used to estimate insulin.
The Homeostatic Model Assessment (HOMA) equations have been widely used in research to estimate insulin resistance and the two equations which use fasting blood levels of insulin and glucose are as follows, with HOMA-IR used to assess insulin resistance and HOMA-B used to assess pancreatic β—cell (beta-cell) function [3,9].
Individual results are best compared to local population cut off values for HOMA1-IR [3] (1985) or the updated HOMA2-IR* [4] (1998).
HOMA2-IR* is easily and accurately calculated using the online HOMA2 calculator released by the Diabetes Trials Unit, University of Oxford available at http://www.dtu.ox.ac.uk/homacalculator/index.php.
The original HOMA1-IR equation proposed by Matthews in 1985 [3] was widely used due to its simplicity, however it was not always reliable because it did not consider the variations in the glucose resistance of peripheral tissue and liver, or increases in the insulin secretion curve for blood glucose concentrations above 10 mmol/L (180 mg/dL), or the effect of circulating levels of pro-insulin. [5]. The updated HOMA2-IR computer model [6] mentioned above and available from Oxford University has been used since 1998 and corrects for these — and estimates both insulin resistance and β-cell function.
Cut-off for insulin resistance using the original Matthews values (1985) [3] for HOMA-IR ≥ 2.7
- Insulin sensitive is considered less than 1.0
- Healthy is considered 0.5-1.4
- Above 1.8 is early insulin resistance
- Above 2.7 is considered significant insulin resistance
Cuff-off values for insulin resistance using the HOMA2-IR calculator (1998) [6] is HOMA2-IR ≥ 1.8. Three population based studies found the same or very close cut-offs applied, including a 2009 Brazilian study [6] which found HOMA2-IR ≥ 1.8, a 2014 Venezuelan study [7] which found HOMA2-IR ≥ 2.0 and a 2014 Iranian study [8] which found HOMA2-IR ≥ 1.8.
Use of HOMA-IR to Assess Insulin Resistance and β-cell Function in the Individual
HOMA-IR has been used to assess Insulin Resistance (IR) and β-cell function as a one-off measures in individuals in >150 epidemiological studies of subjects of various ethnic origins, with varying degrees of glucose tolerance [9].
In the Mexico City Study which used single glucose-insulin pairs (not the mean of three samples at 5-min intervals) [10], β-cell function and insulin resistance were assessed using HOMA-IR in ~1500 Mexicans with normal or impaired glucose tolerance (IGT). Subjects were followed up for 3.5 years for the incidence of diabetes and to examine any possible relationship with baseline β-cell function and IR. At 3.5 years, ~4.5% of subjects with normal glucose tolerance at baseline and ~23.5% with impaired glucose tolerance at baseline had progressed to type 2 diabetes. That is, the development of diabetes was associated with higher HOMA-IR at baseline.
The use of HOMA-IR on an individual basis enables clinicians to quantify both the degree of insulin sensitivity and β-cell function on assessment — before the person makes any dietary changes. Once the individual understands the significance of their HOMA-IR results, it can provide significant motivation for them to make dietary changes in order to prevent the progression toward abnormal glucose tolerance, or type 2 diabetes. When HOMA-IR is repeated 6 months into dietary changes, it provides significant feedback to the individual regarding the effectiveness of dietary changes, and the motivation to continue.
”HOMA-IR can be used to track changes in insulin sensitivity and β-cell function longitudinally in individuals. The model can also be used in individuals to indicate whether reduced insulin sensitivity or β-cell failure predominates[10].
Assessing HOMA2-IR is the reason I may request a simultaneous fasting blood glucose and fasting insulin from those that come to me and who have insulin resistance and/or hyperinsulinemia. My goal is to find out even when blood sugar results are still normal in order find out if their pancreas is working too hard in order to keep them that way.
More Info?
If you would like more information about how I can support you in meeting your health and nutrition goals, please have a look around my web page, or send me a note through the Contact Me form.
To your good health!
Joy
You can follow me on:
Twitter: https://twitter.com/lchfRD
Facebook: https://www.facebook.com/lchfRD/
Instagram: https://www.instagram.com/lchf_rd
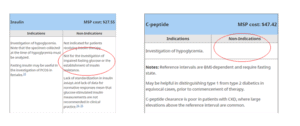
Note: In British Columbia, family MDs may decline to order the fasting insulin test for the investigation of insulin resistance as the BC government does not authorize payment for that use, but many physicians will if they feel it is clinically warranted. Alternatively, a fasting C-peptide test can be ordered without restriction and can be used to determine HOMA2-IR using the Oxford calculator.
People also have the option to self-pay for these tests.
References
- American Association of Clinical Endocrinologists Announces Framework for Dysglycemia-Based Chronic Disease Care Model, November 28, 2018, AACE Online Newsroom, url: https://media.aace.com/press-release/american-association-clinical-endocrinologists-announces-frameworkdysglycemia-based-c
- Crofts, C., Understanding and Diagnosing Hyperinsulinemia. 2015, AUT University: Auckland, New Zealand. p. 205.
- Matthews, D. R; Hosker, J. P; Rudenski, A. S; Naylor, B. A; Treacher, D. F; Turner, R. C; “•Homeostasis model assessment: insulin resistance and β-cell function from fasting plasma glucose and insulin concentrations in man”–; Diabetologia; July, 1985; Volume 28, Number 7: Pp 412-419
- Levy JC, Matthews DR, Hermans MP. Correct homeostasis model assessment (HOMA) evaluation uses the computer program. Diabetes Care. 1998;21:2191—2192
- Song YS, Hwang Y-C, Ahn H-Y, Comparison of the Usefulness of the Updated Homeostasis Model Assessment (HOMA2) with the Original HOMA1 in the Prediction of Type 2 Diabetes Mellitus in Koreans, Diabetes Metab J. 2016 Aug; 40(4): 318—325
- Geloneze B, Vasques AC, Stabe CF et al, HOMA1-IR and HOMA2-IR indexes in identifying insulin resistance and metabolic syndrome: Brazilian Metabolic Syndrome Study (BRAMS), Arq Bras Endocrinol Metabol. 2009 Mar;53(2):281-7
- Bermíºdez V, Rojas J, Martínez MS et al, Epidemiologic Behavior and Estimation of an Optimal Cut-Off Point for Homeostasis Model Assessment-2 Insulin Resistance: A Report from a Venezuelan Population, Int Sch Res Notices. 2014 Oct 29;2014:616271
- Tohidi M, Ghasemi A, Hadaegh F, Age- and sex-specific reference values for fasting serum insulin levels and insulin resistance/sensitivity indices in healthy Iranian adults: Tehran Lipid and Glucose Study, Clin Biochem. 2014 Apr;47(6):432-8
- Wallace TM, Levy JC, Matthews DR, Use and Abuse of HOMA Modeling, Diabetes Care 2004 Jun; 27(6): 1487-1495. https://doi.org/10.2337/diacare.27.6.1487
- Haffner SM, Kennedy E, Gonzalez C, Stern MP, Miettinen H: A prospective analysis of the HOMA model: the Mexico City Diabetes Study. Diabetes Care 19:1138—1141, 1996
Copyright ©2021 The LCHF Dietitian (a division of BetterByDesign Nutrition Ltd.)
LEGAL NOTICE: The contents of this blog, including text, images and cited statistics as well as all other material contained here (the ”content”) are for information purposes only. The content is not intended to be a substitute for professional advice, medical diagnosis and/or treatment and is not suitable for self-administration without the knowledge of your physician and regular monitoring by your physician. Do not disregard medical advice and always consult your physician with any questions you may have regarding a medical condition or before implementing anything you have read or heard in our content.