A Dietitian’s Journey – the road to better health

A Dietitian’s Journey – the road to better health

In the previous article titled “A Dietitian’s Journey – the beginning”, I shared about why I am (1) following a low carb high healthy fat diet and (2) extending the time between meals in my pursuit of improved health. In this post, I talk about the smaller third of the picture, (3) exercise. Why I am doing this is because quite literally, my life and quality of my life depends on it.

This “journey” is my road to better health – to optimal health.

As a Registered Dietitian in private practice, I’ve spent the last decade helping people in the Lower Mainland of Vancouver learn how to eat healthier, lose weight, lower their blood sugar and blood pressure and have cholesterol that is in the healthy range.  While I had lost 50 pounds myself a few years ago, little by little over the last 2 years, I’d put 1/2 of it back and along with the higher weight, came higher blood sugar levels, followed by high blood pressure.

My “fat picture” – prior to losing 50 lbs.

I had two choices; (1) go on medication or (2) change my lifestyle. I chose the latter. March 5 2017 was the beginning of the journey, on the road to better health.

But what was the “road”?

Over the last 2 years, I’ve done a lot of reading with regards to the physiology of why and how diets high in carbs underlie the “obesity epidemic”.  I understood how excess carbs that were not needed for energy were converted to fat and stored in the liver. I also understood how this excess fat in the liver negatively impacted cholesterol levels – that it wasn’t eating fat that gave people high cholesterol (except for a very small minority with genetic conditions) but eating too many carbs.

Day in, day out in my private practice I’d explain to people how eating “plenty of fruit and vegetables” was making things worse for them because of the carb content in these foods – foods that were eaten with- and between meals. I knew that following the standard recommendations of the last 40 years – to eat low fat and high carbohydrate and restricting portions was not going to accomplish my goal.

I decided to “practice what I preach” by eating a low carb, high fat diet (LCHF), and by extending the time between meals.  In time, I also hope to incorporate short periods of high intensity interval training (HIIT), but for now I just need to get moving!

Since I am not yet “fat adapted” – that is, my body hasn’t yet switched over to using my own fat stores as a fuel source, I knew that I needed to start with walking. Baby steps!

Yesterday, I set an appointment with myself to do just that, and while I was 3 hours later than I planned to be today, my ipod wasn’t charged and it was 5° C and pouring rain, I went to the track and did what I said I would do.

you can follow me at:

 https://twitter.com/lchfRD

  https://www.facebook.com/lchfRD/

Here’s a clip from my first workout:

Note: I am a "sample-set of 1" - meaning that my results may or may not be like any others who follow a similar lifestyle. If you are considering eating "low carb" and are taking medication to control your blood sugar or blood pressure, please discuss it with your doctor, first.

Copyright ©2017 The LCHF-Dietitian (a division of BetterByDesign Nutrition Ltd.) 

LEGAL NOTICE: The contents of this blog, including text, images and cited statistics as well as all other material contained here (the ”content”) are for information purposes only.  The content is not intended to be a substitute for professional advice, medical diagnosis and/or treatment and is not suitable for self-administration without the knowledge of your physician and regular monitoring by your physician. Do not disregard medical advice and always consult your physician with any questions you may have regarding a medical condition or before implementing anything  you have read or heard in our content.

A Dietitian’s Journey – the beginning

A Dietitian’s Journey – the road to better health

I remember back at McGill, when I was doing my undergrad training as a Dietitian, one of my professors saying that most people chose Dietetics because they came from a background of disordered eating or diet-related health issues.  True to form, most of my extended family were obese and most had Diabetes, high blood pressure and high cholesterol and were on a whole host of medications for each.

Fast-forward 20 years (and several children later) and despite losing 35 of the 60 pounds I had to lose, I became Diabetic. More recently, I’ve had high blood pressure.

Unable to answer my questions regarding addressing both of these through a low-carb-high-healthy-fat eating plan, my GP referred me to an Endocrinologist. After a thorough physical examination and a whole host of blood work, she asked me about how I planned to address this, given that I am a Dietitian.  Hesitantly, I told her that I planned to eat a high healthy-fat diet and low carb diet with a medium amount of protein and use intermittent fasting to lower insulin resistance. She asked me what percent of “net-carbs” (total carbs minus fiber) I was aiming for and what percentage of protein and what my fat sources would be, and I told her.  I was waiting for an extremely negative reaction, but instead was completely taken aback by her reply. She said that from she’s been reading in the literature, my plan was not only evidenced-based, but that if I didn’t don’t lose the rest of the weight and eat this way, that I will end up on both medication for my blood sugar, and cholesterol and likely for my blood pressure, too.

I began to implement the dietary and lifestyle changes and was seeing my “numbers” coming down, but like many people, life happened and I didn’t follow through. The weight crept up and presumably so did my blood sugar and pressure, but I had stopped monitoring those ages ago. But it was a problem with my eyes — one whose cause was unrelated to being Diabetic or having high blood pressure that was a game-changer for me. Having these conditions put me at higher risk of losing my vision and this was simply not something I was willing to risk.

Two weeks ago, I arrived at a fork-in-the-road. One direction was the same as most of my family took; with medication for blood sugar, blood pressure and cholesterol. The other was the road that I am taking; the one less traveled, but very well-researched, and with the encouragement of my Endocrinologist – a low-carb-high-healthy-fat way of eating, with extended periods of time between meals, and periods of days of eating and then not eating. Not “starving”, but “intermittent fasting”.

The difference?

Starving results in the body lowering its metabolism to spare calories and intermittent fasting and alternate-day fasting results in the body raising its metabolism and burning stored fat.

The expected outcome?

The first goal begins with lowering insulin resistance; which is the underlying cause of Type 2 Diabetes, and with lower insulin resistance follows lower blood sugar levels – both fasting blood sugar and A1C (3 month average).

A change in diet and strategic use of fasting, lowers insulin and cortisol levels which in turn, lower triglycerides (TG). TG are largely a byproduct of a high-carb diet (especially affected by fructose), so lowering these results in lower TG and in turn, lower levels of LDL (bad cholesterol) and higher levels of HDL (good cholesterol).  Lower insulin and cortisol as well as less abdominal fat, results in lower, more normalized blood pressure.

Will it work?  The research seems to indicate it will and over the weeks to come, I will posting the results of some of that research so that the context of what I’m doing can be understood.  After all, I am a Dietitian and a scientist — it has to be evidenced-based.

The First Two Weeks – off to a good start

Blood Sugar

Of course this is an incredibly small period of time to look at, but in the first two weeks since I started my low-carb-high-healthy-fat eating with intermittent- and alternate-day fasting , my blood sugar has decreased substantially even on the days I was eating, provided I was eating very few carbs.

arrows indicated 2 periods of eating 10-15% carbs

Blood Pressure

My blood pressure went from 50% Stage 1 hypertension with 1 hypertensive emergency (scary!) and ~30% Stage 2 Hypertension the first week:

…to approximately 80% Stage 1 Hypertension and almost 20% pre-hypertension the second week.

That is a significant change!

My weight is only down ~ 4 pounds, but I’ve lost 1 inch off my waist.

I am not hungry on my intermittent-fast days …and keep in mind, I talk about food all day long with my clients. If I am not talking about food, I am working on meal plans and writing about food!  If I was hungry, this would be torture, but it’s not. In fact, the last time I ate was last night at supper and I feel fine. I should have had a coffee though (as I get caffeine headaches if I don’t).  I’ll make one soon.

I’ve only taken one alternative-day fast so far and it went fine.  I drank “bone-broth” (I’ll explain in coming blogs!) and had my morning coffee with a little cream, no milk because of the carbs. I don’t really like cream, but it was okay.  Bone broth is interesting — a bit like chicken broth, but different.

One side-bonus that I never expected, is that I am sleeping better than I have in years.  Crazy good sleep and waking up rested.  What a great added bonus.

I have a long way to go to get to my goals (plural) because I’ve set the bar very high…and why not? If the literature indicates that this works, then I want;

(1) blood sugar in the non-diabetic range

(2) normal blood pressure

(3) normal / ideal cholesterol levels

(4) a waist circumference in the “at or below” recommended values of the Heart and Stroke Foundation

Will I meet all these goals?  Who knows?! But I won’t know if I don’t try and the alternative of a life of medication for blood sugar, blood pressure and eventually cholesterol too does not appeal to me!

So join me in my journey – a journey of change, of good health and on a road less traveled.

To our health!

Joy

you can follow me at:

 https://twitter.com/lchfRD

  https://www.facebook.com/lchfRD/

Note: I am a “sample-set of 1” – meaning that my results may or may not be like any others who follow a similar lifestyle. If you are considering eating “low carb” and are taking medication to control your blood sugar or blood pressure, please discuss it with your doctor, first.

Copyright ©2017 The LCHF-Dietitian (a division of BetterByDesign Nutrition Ltd.) 

LEGAL NOTICE: The contents of this blog, including text, images and cited statistics as well as all other material contained here (the ”content”) are for information purposes only.  The content is not intended to be a substitute for professional advice, medical diagnosis and/or treatment and is not suitable for self-administration without the knowledge of your physician and regular monitoring by your physician. Do not disregard medical advice and always consult your physician with any questions you may have regarding a medical condition or before implementing anything  you have read or heard in our content.

The “Skinny” on Fats

INTRODUCTION:

Many people believe that saturated fat is “bad” for you but few people realize that our bodies actually manufacture it.  It’s true. In this article, I cover “just enough” chemistry (made very easy!!) for you to be able to understand the latest new findings. My next article will be on a change in the dietary recommendations of a key stakeholder in heart health in Canada, and what this change means.

If Saturated Fat was so Dangerous, Why Would our Body Actually Make it?

There are two sources of fats (also called “lipids“); those we eat in our diets and those our body makes. The fats we eat are called “exogenous fats” (“exo” meaning ‘from outside’) and the type of fats that our body makes are called “endogenous fats” (“endo” meaning ‘from within’).

Exogenous Fats

The types of fat that our body takes in as exogenous lipids from what we eat include saturated fats, and different kinds of unsaturated fats — including polyunsaturated fats — both omega 3 and omega 6, as well as monounsaturated fats. You can look back to the preceding blog, if you aren’t clear on these.

Endogenous Fats

Our body actually makes fat in a process called lipogenesis. This is important because some of the LDL cholesterol and triglycerides (TG) that gets reported on blood test results is endogenous; that is, our bodies made it. So we have high LDL (“bad” cholesterol) or triglycerides it’s not all from the fat we eat!

[Not only do our bodies make saturated fat, but excess carbohydrates gets stored in our body first as triglyceride and then if it still isnt needed, it gets stored as LDL cholesterol in our liver.  So carbs can raise both triglycerides and LDL cholesterol.]

Below, I will present just enough chemistry to understand the different types of fat and more importantly, be able to read about them and understand.

The Saturated Fat Our Body Makes and What it is Used For

1. The first thing that you need to know is that palmitic acid is a long-chain saturated fat is made (synthesized) in the liver. Palmitic acid is a 16-carbon fatty acid and having so many carbons in its backbone, it is considered “long chain”). It has no double bonds, so all the carbons in the backbone have a hydrogen bound to it (more on that below), so palmitic acid is a saturated fat.  Palmitic acid is found naturally in foods such as butter, cheese, milk and meat — but it is also synthesized by our bodies!

Now the message of the media since the mid- to late-1970s is to eat low-fat dairy; including low fat milk, low-fat yogourt and low-fat cheese with the assumption that saturated fat is “bad” for us — but our bodies actually manufacture it!


2. The other thing that you need to know is that a triglyceride is made up of three fatty acids attached to a glycerol molecule. That’s easy to remember, because “tri” means “3”.

a) Glycerol acts as the support for the other fats and is made up of three carbon atoms, each with something called a “hydroxyl group” bound to it.

A hydroxyl group (written “-OH”) is an oxygen and a hydrogen molecule bound together.  That is, water (H2O) is just a hydrogen (H) molecule bound to a hydroxyl (-OH) group.

So, this is a glycerol molecule;

As you can see, each of the carbons in the chain have a hydroxyl (-OH) group bound to it. Easy, so far, right?

b) Fatty acids are long chains of carbon atoms (i.e. think of a freight train, where each rail car is a carbon atom) with a carboxylic acid (-COOH) group at one end (i.e. the caboose is a carboxylic group). At each of the carbons in the chain, there is the potential for a hydrogen atom (H) to bind there.

You may recall from our previous article that a saturated fat is one that has no double bonds in the carbon chain, so in that case, all the carbon atoms in the chain have a hydrogen attached.  It is having all the carbons “saturated” with hydrogen atoms, that make it a “saturated” fat!

The names given to fatty acids are based on the number of carbon atoms and the number of carbon-carbon double bonds in the chain.


Different Kinds of Oils 

Remember, a triglyceride is made up of three fatty acids attached to a glycerol molecule. So, for example, palmitic acid and stearic acid are both exactly the same, except one has 16 carbons (palmitic acid) and the other has 18 carbons (stearic acid) in its chain.

Palmitic acid, a saturated fat has 16 carbons.  That is, it is “saturated” with hydrogen atoms at each of its 16 carbons. It is all of this “saturation” that makes saturated fat solid at room temperature.

Stearic Acid, is also a saturated fat, but has 18 carbons, so each of its carbons has a hydrogen bound to it,

Using just these two saturated fatty acids (palmitic acid and stearic acid) we can combine them in different ratios to make entirely different oils! For example, canola oil has a 4:2 ratio of palmitic acid to stearic acid and grapeseed oil has an 8:4 ratio of palmitic acid to stearic acid.

Furthermore, the same two fatty acids can be put together in the same ratio and be different fats. For example in a 7:2 ratio, it could be either almond oil or safflower oil — depending on how they are put together.

Palmitic acid, the saturated fat that our body makes is found in all kinds of “healthy” foods.

Lipogenesis – Our Bodies Making fat!

Lipogenesis is the process by which our bodies actually make fat and our bodies can make unsaturated fats or saturated fats.  

Unsaturated fatty acid lipogenesis

Our body can make a longer chain unsaturated fat from a shorter chain fatty acid (such as taking the linolenic acid from flax seed and adding carbons to the chain to make arachidonic acid). But there are limits.  Our bodies cannot take the linolenic acid from flax seed and make it into eicohexanoic acid or decahexanoic acid which are the healthy “omega 3 fats” fats found in  fish. So eating eggs made from chickens fed flax is not the same as eating fish.  We just can’t turn one into the other. Our body can make it longer, but not much longer.

Saturated fatty acid lipogenesis

As said above, our bodies synthesize palmitic acid, a 16 carbon saturated fat in our liver and then forms a triglyceride from three palmitic acid molecules attached to a glycerol molecule. These triglycerides are then transported around the body in something called a VLDL. More on that just below. 


Cholesterol – The Good the Bad and the Ugly

Most people know that HDL cholesterol is the so-called “good cholesterol” and LDL cholesterol is the “bad” cholesterol  — but where does LDL (“bad cholesterol”) come from? The first step when our body makes something called VLDL.

Very Low Density Lipoproteins (VLDL)

The body takes the triglycerides it manufactures in lipogenesis as well as takes in in the diet into Very-low-density lipoprotein (VLDL) cholesterol. These VLDLs move cholesterol, triglycerides and other lipids (fats) around the body.

VLDL is produced in the liver and include the triglycerides made with differing amounts of palmitic acid.  That is, our bodies MAKE palmitic acid in the liver and then combine the palmitic acid it makes in differing ratios, into triglycerides. It then takes the triglycerides, containing palmitic acid and protein and packages it into VLDLs. It then releases the VLDLs into the bloodstream, to supply body tissues with triglycerides.  About half of a VLDL cholesterol is made up of triglycerides, including those containing the palmitic acid it made!

High levels of VLDL cholesterol have been associated with the development of plaque deposits on artery walls, which narrow the passage and restrict blood flow.

VLDL cholesterol on blood test results aren’t measured, but estimated as a percentage of the triglyceride value.

What is LDL cholesterol?

When VLDL cholesterol reach fat cells (called “adipose tissue”), the triglyceride is stripped out and absorbed into fat cells. That means that VLDLs shrink.

Once a VLDL has lost a large amount of triglyceride it becomes a new, smaller, lipoprotein, which is called Low Density Lipoprotein, or LDL — the so-called bad cholesterol’. LDL contains mostly cholesterol and some protein. Some LDLs are removed from the circulation by cells around the body that need the cholesterol contained in them and the rest is taken out of the circulation by the liver.

Here is the key point: the only source of LDL is VLDL. 

Saturated Fat — not dangerous and can be beneficial 

The media keeps telling us that “saturated fat is bad” and that it is even “dangerous” — but if it was so dangerous, why would our bodies actually manufacture it?  Our bodies manufacture palmitic acid, a saturated fat, then synthesize triglycerides from it which it sends all around our bodies, supplying our bodies with saturated fat!

Furthermore, there are some saturated fatty acids, called Medium Chain Triglycerides (MCTs) that are metabolized entirely differently than the longer chain saturated fatty acids and have beneficial properties.  These MCT oils go straight to the liver by the portal circulation and don’t need to be digested.

People who consume fats high in MCT oil, such as coconut oil which is almost half (44-55%) Lauric acid, an MCT have been found to have lower amounts of “belly fat” than those that do not consume these saturated fats.  Studies have found lower rates of ”visceral adiposity” or ”belly fat” in those that consume these fats, and correspondingly , lower lowering waist circumference.

Since carrying fat around the abdomen (the so-called “apple shaped” people) is considered to be a risk-factor to heart disease and studies have found that those who eat a diet high in MCT saturated fats have less fat around their middles and a smaller waist circumference, can we categorically say that saturated fat is really “bad” or “dangerous” to heart health. In fact, in our next article, we will outline the beginning of a change in the recommendations concerning saturated fat consumption.

Some thoughts…

Saturated fat and its consumption needs to be put into context; one context would be looking at the risks of a high carbohydrate diet compared with a high saturated fat diet, for example.  As covered in previous blogs, prior to 1977, when the dietary recommendations in Canada and the US changed to favour a diet low in saturated fat and high in carbohydrates, the rate of Diabetes was 1/10th what it is now and obesity rates in adults, especially men were too. Childhood obesity was almost unheard of prior to 1977.

Another context would be to differentiate between saturate fats.  That is, to look at which saturated fats.  Numerous studies demonstrate the benefits of MCT oils in increasing metabolism, lowering body fat, especially “visceral adiposity”.

Another context would be to determine how much of the “high cholesterol” (i.e. high LDL cholesterol) came from VLDL that was endogenously produced, versus eaten (exogenous).

Many studies have found that people are less hungry (have increased “satiety”) when they consume higher fat dairy products (which are rich in saturated fat), and as a result consume less calories overall than those that do not eat higher fat dairy products. So, we need to know which fats, and in particular which saturated fats are associated with this increased satiety?

It is my opinion that “vilifying” fat — labelling it as ‘unhealthy’ and the current government dietary recommendations and the media ads encouraging us to eat “low fat” everything, is creating a much bigger problem than the fat itself.  When manufacturers take out fat, they have to ‘replace” it with something and that ‘something’ is often sugar (simple carbohydrates).  Is increasing the carbohydrate content ‘safer’ than the naturally occurring fat that was found in the milk or yogourt or cheese, in the first place?

Recent studies seem to indicate that saturated fat consumption is not the issue when it comes to heart risk — and that saturated fat may actually be protective against heart risk. Certainly there are many studies showing the benefits of consuming MCT oil for reducing “belly fat”, which reduces heart risk — so can we say that something like coconut oil, used in moderation is “bad” or “dangerous”.

Looking at the epidemiological data from the last 35 years, we can see what has happened to obesity rates and diabetes rates since both the American and Canadian governments have been encouraging us to eat “low fat” everything.

Are naturally occurring fats really the issue — or are synthetic “trans fats” and excess carbohydrate?

At this point in time, I am persuaded by the many studies I have read, that naturally occurring fats, including saturated fat are not “bad” or “dangerous” when consumed as part of a whole-foods diet.

Note: Everyone’s results following a LCHF lifestyle will differ as there is no one-size-fits-all approach and everybody’s nutritional needs and health status is different. If you want to adopt this kind of lifestyle, please discuss it with your doctor, first.

Copyright ©2016 The LCHF-Dietitian (a division of BetterByDesign Nutrition Ltd.) 

LEGAL NOTICE: The contents of this blog, including text, images and cited statistics as well as all other material contained here (the ”content”) are for information purposes only.  The content is not intended to be a substitute for professional advice, medical diagnosis and/or treatment and is not suitable for self-administration without the knowledge of your physician and regular monitoring by your physician. Do not disregard medical advice and always consult your physician with any questions you may have regarding a medical condition or before implementing anything  you have read or heard in our content.


follow me at:

 https://twitter.com/joykiddieRD

  https://www.facebook.com/lchfRD/


Carbs or Fat – which one should we eat less of?

Intro: Since 1977, Health Canada and Canada’s Food Guide have been promoting a diet which is high in carbs (45-65%) and low in fat (20-35% ) and which recommends that no more than 7% of fat comes from saturated fat — with the goal of lowering heart disease.

As elaborated on in an earlier blog, prior to 1977, the obesity rate [measured as Body Mass Index (BMI) ≥ 30 kg / m2] of Canadian adults was <10% and in 1978, only 15% of children and adolescents were overweight or obese.

As a result of lowering dietary intake from fat and increasing it substantially from carbohydrates, what happened to obesity statistics? Diabetes statistics?

Obesity became an epidemic.

In adults the prevalence of obesity [body mass index (BMI) ≥30 kg/m2] went from 10% in 1970-72 to 26% in 2009-11! In children, that rate doubled to 29% of children and adolescents being overweight or obese by 2007 and by 2011, obesity prevalence for boys was 15.1% and for girls was  8.0% in 5 to 17 year olds.

Based on waist circumference, 37% of adults and 13% of youth are currently considered abdominally obese.

Diabetes rates almost doubled.

In the 1970s, the rate of Type 2 Diabetes in women was 2.6% and 3.4 % in men, in the 1980s that number rose to 3.8% for women and 4.5% for men.  In the 1990s the rate was almost double what it was in 1970; 4.7% for women and 7.5% for men.

Now get this: Type 2 Diabetes contributes to increased risk of heart disease.

So in an effort to reduce rates of heart disease by lowering fat intake and increasing carbohydrate intake, rates of Type 2 Diabetes doubled — which in turn, raised the risk of heart disease! Ironic.

If eating a high carbohydrate, low fat diet is associated with higher rates of obesity which in turn results in a higher incidence of Type 2 Diabetes, what is the option? Isn’t it also a problem to eat a low carbohydrate / high fat diet… isn’t a high fat diet bad for you?”.

This is the question that we will begin to answer in this article and conclude in the next one.


Are all fats the same? Is extra virgin olive oil in the same category as bacon? Or fish oil as lard?

The Health Canada guidelines recommend eating low fat dairy products, lean meat and using a “small amount — 2 to 3 tablespoons (30 to 45 mL ) of unsaturated fat each day. This includes oil used for cooking, salad dressings, margarine and mayonnaise“.

1. We are told to use a small amount of unsaturated fat per day; what is an unsaturated fat and are they all the same?

2. Is the fat in dairy products and meat “bad” for you?

I am going to answer the first question in this article and the second question in the next one.


1. What are the different type of fats.

There are two main classes of fats — saturated fats and unsaturated fats.

Unsaturated fat can be further classified as polyunsaturated fats and mono-unsaturated fats. Polyunsaturated fats include everything from omega-3 fats from fish oil to the fat found in omega-6 fats found in canola oil and corn oil. More about what makes it an ‘omega-3’ or ‘omega-g’ below. Omega-3 fats, especially the long chain ones from fish oil (e.g. DHA, EPA) are heart-healthy and are anti-inflammatory and have been found to be protective against heart disease. Refined seed oils that are high in omega-6 fats are pro-inflammatory.

Monounsaturated fats such as those found in avocado and nuts or cold-expressed from olive oil or avocado or nuts and seeds are considered by Health Canada and the writers of Canada’s Food Guide as the healthiest (and thus, preferred) kind of fat.

We’ve been told to eat a “low fat diet” but are all fats the same? Are omega-3 fats from fish to be lumped together with fat from bacon? And if we eat a diet low in saturated fat, will our “bad” cholesterol (LDL) go down?

Most people have heard that of the fats taken in from the diet, saturated fat is “bad” for you and mono-unsaturated fat and polyunsaturated fat is “good” for you.  Before we deal with whether this is true, let’s define what these are.

There are some basics that we need to cover, to ‘follow’ the discussion as to whether saturated fat in the diet results in high LDL cholesterol and high Triglycerides (TG). I’ll try to make this much less painful than it may have been when you first learned this.

  • fatty acids are molecules made up of a carbon backbone.  Think of it like a train with cars connected together.  Actually think of it more like “fuselage” of a plane (which will become clear as to why, below). The body is made up of carbons all in a row.
  • if there are no double bonds in the carbon chain, it is a saturated fatty acids because something can bond at every carbon along the carbon chain.  Think of those molecules that bond to a carbon as “wings” sticking off the fuselage.
  • if there is one double bond in the carbon chain, it is an unsaturated fatty acid. It is “unsaturated” because no other compound can bond where the double bond is. So it can have “wings” every where else along the carbon chain (which makes it unsaturated) but not at the place where the one double bond is.
  • if the carbon chain has more than one double bond, it is called a polyunsaturated  fatty acids (PUFAs).
  • there can be a double bonds off one of the carbons in the carbon backbone chain.
  • where the double bond off the carbon backbone is located determines whether it is an omega-3 polyunsaturated fatty acid or an omega-6 polyunsaturated fatty acid.
  • all omega-3 fats have their first double bond in the same place on the carbon chain (away from what is called the ‘carboxyl’ end).  All omega-3 fats have their first double bond starting at the 3rd carbon (away from what is called the ‘carboxyl end’).
  • all omega 6 fats have their first double bond starting at the 6th carbon (away from the carboxyl end)

That’s pretty well all the chemistry you need to know.

So we’ve heard that we should decrease our intake of all fat, especially saturated fat as it leads to high LDL cholesterol, high triglycerides (TG) but is that true?   2. Is the fat in dairy products and meat “bad” for you?

3. Is saturated fat in the diet the only source?

Spoiler alert!

Our bodies not only make fat, they synthesize saturated fat!

We will cover the making of endogenous (“in the body”) saturated fat in Part 2, coming soon!

Have questions about the services I offer? Please click on the “Contact Us” tab above, to send me a note.

Note: Everyone’s results following a LCHF lifestyle will differ as there is no one-size-fits-all approach and everybody’s nutritional needs and health status is different. If you want to adopt this kind of lifestyle, please discuss it with your doctor, first.

Copyright ©2015 The LCHF-Dietitian (a division of BetterByDesign Nutrition Ltd.) 

LEGAL NOTICE: The contents of this blog, including text, images and cited statistics as well as all other material contained here (the ”content”) are for information purposes only.  The content is not intended to be a substitute for professional advice, medical diagnosis and/or treatment and is not suitable for self-administration without the knowledge of your physician and regular monitoring by your physician. Do not disregard medical advice and always consult your physician with any questions you may have regarding a medical condition or before implementing anything  you have read or heard in our content.


follow me at:

 https://twitter.com/joykiddieRD

  https://www.facebook.com/lchfRD/

Weight Gain as a Hormone Imbalance not a Calorie Imbalance

Weight gain is not caused simply by taking in more calories than you burn (the so-called ”calorie-in / calorie-out” model).  Calories in and calories out are interdependent factors, so when calories are restricted the body actually slows its metabolism, lowering the energy it uses for vital bodily functions. Basal Energy Expenditure (BEE) can decrease by as much as 30-50% in order to spare calories!

On the opposite end, when too many calories are taken in by someone who is already overweight, the body will try to get rid of them by increasing its Basal Energy Expenditure, usually by speeding up respiration, increasing heart rate and breathing and generating more heat.

The body does this because its set point’; the weight at which your body likes to be and will tend to stay with very little effort, is highly regulated. It really isn’t that easy to gain or lose weight if we haven’t already compromised this built-in homeostatic mechanism.

That is why trying to control calories doesn’t work for long term weight loss. When we restrict calories, and increase our exercise, our body responds by increasing hunger, initiating craving (especially for foods such as simple carbs that can be broken down quickly to glucose for your blood) and by decreasing the amount of energy it uses.

Have you ever skipped a meal or lowered your calories so much that you feel cold; even though the room is at an adequate temperature and you are dressed appropriately? You are shivering because your body is sparing calories it would normally use for heat generation.

Body Weight is Regulated by Hormones

Body weight is not really under our control as much as we’d like to believe.  It is a tightly regulated process that involves a variety hormones including leptin (a hormone that regulates fat stores by inhibiting hunger), ghrelin (a hormone that increase hunger when your stomach is empty) and insulin, which plays a very significant role in hunger, eating behavior and fat management.

To understand how significant a role insulin plays in weight regulation, let’s look at a situation where there is insufficient insulin. Type I diabetes results from the destruction of the insulin-producing pancreatic islet cells stemming from an autoimmune disorder. One of the hallmarks of this disease and it’s very low levels of insulin is severe weight loss. Type I diabetics need to take insulin injections to correct for the insulin deficiency but the more insulin that is taken, the more weight gain there is. As insulin levels go up, hunger is triggered and we feel the urge to eat.

Insulin is one of the major controllers of the body set point.

As mentioned, if we don’t take in sufficient calories, then our body decreases our Basal Energy Expenditure so that we end up maintaining our body weight in response to whatever the number of calories are that we take in.  The issue in weight gain is not how to reduce calories but how to reduce insulin.

Insulin as the Main Factor in Weight Gain

When we eat food, our body releases insulin in response to the rise in glucose in our blood, coming from the digested food. Insulin acts as a messenger to instruct the body’s cells to absorb glucose, in effect reducing blood glucose levels.

Insulin resistance is a condition in which the cells of the body become resistant to insulin and fail to respond normally to normal levels insulin, leading to higher blood sugar. The pancreas tries to compensate to this condition by producing more and more insulin.  As long as the pancreas is able to produce enough insulin to overcome this resistance, blood glucose levels remain normal but when the pancreas can no longer produce enough insulin, the blood glucose levels begin to rise.

Initially, this added rise in blood glucose happens after meals (when glucose levels are already at their highest) and more insulin is needed – but eventually these higher levels of glucose are seen first thing in the morning when the person hasn’t eaten for 8 or 10 hours. When blood sugar rises abnormally above specific clinical levels, the person is diagnosed as having Type 2 diabetes. Insulin resistance is often called ”pre-diabetes” because it precedes the development of Type 2 Diabetes.

Consistently high blood glucose levels along with insulin resistance lead to cells that are starved of glucose even though there is plenty of glucose in the blood. Since the cells aren’t getting any of the glucose even though it is there, it is not available to the cells because insulin is not binding it and taking it in. As a result, hunger signals are sent to the brain, leading to eating, even though the person has recently eaten.

As more and more glucose accumulates (both from the food being eaten and as you will see in a minute, through the making of glucose due to the effect of cortisol, another hormone) the high levels of glucose trigger the body to store the excess glucose as body fat.

The Effect of Stress on Weight Gain

Cortisol, the so-called stress hormone also plays a role in weight gain. Let’s look at another medical conditions to illustrate the effects of cortisol. In Cushing Syndrome, cortisol is over-produced by the body and weight gain results.  When we give people a synthetic form of cortisol as a medication (e.g. prednisone) they get something called Cushinoid Syndrome.  That is, they look like they have Cushing ’s disease. Not only do they gain weight, but there is a particular distribution of this weight gain called truncal obesity which means that fat is gained around the belly, rather than on the arms and legs.

In adrenal insufficiency (also known as Addison’s disease) which produces the opposite effect, the adrenal gland becomes damaged due an autoimmune condition and is unable to produce cortisol.  The hallmark of Addison’s disease is weight loss.

So what role does cortisol play in healthy individuals? Cortisol is released as a result of ordinary events such as waking up in the morning or exercising, but also is released in response to physiological and psychological stress.  Physiological stress might be an illness or injury and the release of cortisol services a needed function to make sure we have enough glucose to heal.

Under stressful conditions, cortisol also plays the role of providing the body with glucose by tapping into protein stores via gluconeogenesis in the liver. This energy can be helpful in a ”fight or flight” type of stressor, such as when one is being chased by something however under constant levels of psychological stress, elevated cortisol over leads to higher levels of glucose being made from protein in the body the long term.  So in addition to glucose coming from the food we eat (exogenous sources), we now have the body making its own glucose (endogenous sources).  The combined exogenous glucose from good and the endogenous glucose triggered by cortisol, now leads to even higher blood sugar levels that without the long term stress.

With continually high levels of cortisol, the body will take fat that is stored as triglycerides in our liver and relocate them to visceral fat cells — those under the muscle, deep in the abdomen. Just like in Cushing’s syndrome, we now see truncal obesity triggered by stress, mediated by cortisol.

Weight Gain is due to Hormonal Triggers and not a Lack of Will-Power

Cortisol also directly influences appetite and cravings by binding to hypothalamus receptors in the brain, triggering us to eat and crave foods that are easily broken down to glucose.  Cortisol also indirectly influences appetite by modulating other hormones that stimulate appetite. Simple carbohydrates like bread, pasta, candy and pop are common foods that people reach for in response to these craving because they are easily broken down to simple sugars. So, it is actually the higher levels of cortisol that lead to increased appetite and in particular cravings for high-calorie foods, not simply a lack of will-power.

As you can see, we don’t really control our body weight any more than we control our heart rates.  To a large degree, body weight is regulated automatically under the influence of hormones; hormones that indicate to eat and indicate when we are satiated.  Hormones signal our bodies to increase energy expenditure and when calories are restricted, hormones will slow energy expenditure.

Why All Diets Work and often All Diets Fail

It doesn’t really matter which diet people follow, whether it is Atkins, South Beach, or the good old fashioned low fat, low calorie diet, all diets in the short term produce weight loss. Yes, some are healthier than others, but they all “work”.

One would hope that by continuing to eat according to what ever diet we’ve chosen and by exercising, that our body’s set point would reset at a lower level, but this doesn’t happen.

Insulin levels stay high, continuing to drive hunger and eating.

How does this affect weight loss?

A few months into our diet, regardless what diet we follow, weight loss begins to plateau.  As the plateau continues, people get discouraged, and think to themselves if I’m not losing weight, then I may as well eat — fill in the blank’. This is either followed by an abandoning of the diet completely and a regaining of the weight previously lost (or more) or by a stubborn insistence to restrict calories and fat even further — leading to a downshifting of basal energy expenditure. It’s a vicious cycle.

But why does Body Weight Plateau in the First Place?

In response to weight loss, the body tries to return to its original set point.  First it slows metabolism to try and slow down weight loss — resulting in slowed weight loss and eventual plateauing.

The reason is because we’ve done nothing to lower insulin levels.

Think of set point like a body weight thermostat’. With a thermostat, when the air is hot enough, the furnace turns off and when it is too cool, the thermostat turns the furnace on.  Regardless what kind of diet a person follows, there will be weight loss effects in the short term, but eventually, even with continued compliance, body weight plateaus and in time, the person begins to regain the weight.

What about exercise?

Surely exercise will help us lose weight, right?

Basal energy expenditure which is the amount of energy we use at rest is estimated to be approximately 12-15 calories per pound.  For someone confined to complete bed-rest, caloric needs are calculated as 1.2 times Basal energy expenditure (BEE).

To visualize the effect exercise has on calorie loss, let’s take a 140 pound person as an example, whose basal caloric needs are 2200 — 2500 calories per day. Say they start exercising.  They start walking at a moderate pace (2 miles/hour) for 45 minutes every day, and burn roughly 104 calories.  Let’s look at that in terms of basal energy expenditure — that is only 4% of the BEE.  Okay, so say the person starts working out at a more vigorous pace, calorie burning will go up, right?  But how much?  6% of BEE?  8% of BEE? That’s about it.

The bottom line is, the vast majority of calories you take it; about 95% of caloric intake is used to heat the body and other metabolic processes, including keeping your heart beating, breathing, digestion, brain function, liver and kidney function, etc.

Set point is a tightly regulated mechanism, like a thermostat.  When we burn more calories through exercise two things happen.  Studies show that people actually end up decreasing their activity outside of the period of exercise and the other is they increase their caloric intake in response to exercise. That’s where the phrase ”working up an appetite” comes from.

The reason exercise is not that effective for weight loss is because of metabolic compensation.  We understand this intuitively though, don’t we? When know when we cut calories, restrict certain foods and increase our exercise that our body responds by being more hungry and increasing cravings. We try to take extreme measures only to find that we don’t really have a chance at making the weight loss last long term.

Don’t misunderstand; exercise is good for you.  There are many benefits to regular exercise such as improved cardiovascular function, increased strength and flexibility, and lowering stress which will lower cortisol but weight loss is not one of the significant benefits of exercise.

So if restricting calories causes are energy usage to slow and results in us being more sedentary outside of the times we exercise or eating more in response to exercise, how do we lose weight and keep it off?

To keep weight off long term, we need to address the underlying hormonal trigger to hunger and appetite; mainly insulin. To lower weight and keep it off, we need to lower our insulin level.

There are two aspects to lowering insulin levels (1) the foods we eat and (2) when we eat and this will be the topic of the next blog.


Note: Everyone’s results following a LCHF lifestyle will differ as there is no one-size-fits-all approach and everybody’s nutritional needs and health status is different. If you want to adopt this kind of lifestyle, please discuss it with your doctor, first.

Copyright ©2015 The LCHF-Dietitian (a division of BetterByDesign Nutrition Ltd.) 

LEGAL NOTICE: The contents of this blog, including text, images and cited statistics as well as all other material contained here (the ”content”) are for information purposes only.  The content is not intended to be a substitute for professional advice, medical diagnosis and/or treatment and is not suitable for self-administration without the knowledge of your physician and regular monitoring by your physician. Do not disregard medical advice and always consult your physician with any questions you may have regarding a medical condition or before implementing anything  you have read or heard in our content.

Obesity Rates in Canada and Changes to Canada’s Food Guide

Introduction: Many people look to Canada’s Food Guide (CFG) as the ”measuring stick” as to whether they are eating a healthy diet, but did you know that over the years, CFG has changed dramatically? Canada’s first food guide, the Official Food Rules, was introduced to the public in July 1942. This guide acknowledged wartime food rationing, while endeavoring to prevent nutritional deficiencies and to improve the health of Canadians. Over the years the names of the food groups, the serving sizes and numbers of servings has changed.  Serving sizes are now given in ranges; and one has to wonder if these changes have resulted in ”over-nutrition“.

Changes in Canada’s obesity rates seems to parallel the changes in Canada’s Food Guide which is the topic of this blog.


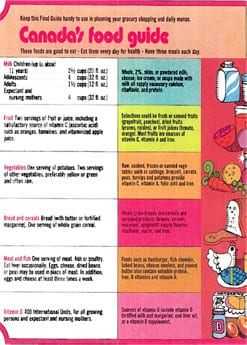
Canada’s Food Rules — 1949

The post-WWII ”Canada’s Food Rules” of 1949 emphasized people taking in sufficient nutrients to prevent nutritional deficiency as well as to avoid excess, by stressing that ”more is not necessarily better”.

Adult guidelines promoted;

canadas_food_rules_19492 cups or more of full fat milk

1 serving of citrus or tomatoes daily & 1 other fruit

2 serving potatoes plus 2 servings other vegetables (preferably yellow or green and frequently raw)

4 slices of bread with butter and 1 serving whole grain cereal

one serving meat, fish or poultry or dried beans, eggs (3x / week), cheese (3x / week)

use liver frequently


Canada’s Food Guide — 1961

In the 1961 version the language softened; with “Guide” replacing “Rules” in the title. Canada’s Food Guide now sought to emphasize its flexibility and wide-ranging application for healthy eating, recognizing that many different dietary patterns could satisfy nutrient needs.

Adult guidelines promoted;

1961-eng1 1/2 cups or more of full fat milk (decreased by ½ cup)

1 serving of citrus or tomatoes daily & 1 other fruit

2 serving potatoes plus 2 servings other vegetables (preferably yellow or green and frequently raw)

4 slices of bread with butter and 1 serving whole grain cereal

one serving meat, fish or poultry, eggs (3x / week), cheese (3x / week) or dried beans

use liver frequently

Reference: Nutrition Division, National Department of Health and Welfare (1961). Rules out – guide in. Canadian Nutrition Notes, 17(7):49-50 (cited in Health and Welfare Canada. Action towards healthy eating: technical report. 1990).


Canada’s Food Guide — 1977

In 1977 Canada’s Food Guide underwent a dramatic revision. There were now four food groups, instead of five, as fruits and vegetables were combined since their nutrient content overlapped and the name of those groups changed, too.

The Milk group became Milk and Milk Products, to highlight the inclusion of other dairy foods, Meat and Alternates replaced Meat and Fish allowing for vegetarian choices — but also resulting in the inclusion of things like peanut butter in this category, rather than categorized in the fat’ category as occurs in other systems, such as the Food Exchanges.

Most significantly, serving ranges were added.

The big focus was on more carbs and less fats (regardless of what the sources of those fats were) — there was no differentiation between lard and olive oil. There was a shift to using low fat dairy products and the beginning of generations of ”fat phobic” Canadians began.  ”Low Fat” products became all the rage.

cfg_history_1977_two_small2 servings (skim, 2%, whole) milk, buttermilk or yogourt (1 serving = 1 cup milk, ¾ cup yogourt, 1 ½ oz cheese)

4-5 servings fruit & vegetables (at least 2 vegetables) – cooked, raw or fruit juices, include yellow or green or green leafy vegetables

3-5 servings of Bread and Cereal

2 servings  Meat and Alternates – (1 serving = 2-3 oz lean cooked meat, fish or poultry or 2 eggs or 1 cup dried cooked legumes or ½ – 1 cup* nuts or seeds).

In 1977, there was introduction of a concept of ”energy balance“; balancing energy intake with energy output (”calories in / calories out” model) which makes the assumption that basal metabolic rates stays the same.

With the goal of reducing diet-related chronic diseases (such as heart disease and high blood pressure), Canada’s Food Guide encouraged Canadians to reduce salt and fat, without distinguishing between sources of fats. In the process, the quantity of all kinds of fat, including healthy monounsaturated fats such as olive oil and nut and seed oil were all reduced.  Canada’s Food Guide encouraged Canadians to eat plenty of fruits and vegetables without distinguishing between high fiber, non-starchy vegetables and high carbohydrate starchy vegetables. More on that below.

Before 1977, the obesity rate [measured as Body Mass Index (BMI) ≥ 30 kg / m2] of Canadian adults was <10%.  Keep that number in mind. It changes considerably over the years as Canada’s Food Guide recommendations changed.


A report submitted to Health Canada in 1977 by the Committee on Diet and Cardiovascular Disease advised the government to take action to prevent diet-related chronic diseases such as heart disease and high blood pressure, so the emphasis in the revised 1982 Canada’s Food Guide was towards even lower fat products.

Lower fat in products often meant more sugar (as fructose or high fructose corn syrup) being added to products such as yogourt, to help make up for the missing taste. Portions of nuts and seeds which contain heart-healthy monounsaturated fats were reduced in the ongoing push to lower all fat in the diet.

There was a continued shift towards carbs as the main source of calories; not only from Breads & Cereals, but from Fruit & Vegetables too — and in this category, there was no distinction between starchy vegetables (such as potatoes, peas, corn, squash and yams) and non-starchy vegetables, such as salad greens or asparagus.  As a result, a serving of sweet potato was categorized no differently than a serving of salad greens.

Furthermore, a serving of fruit juice was considered equivalent to a serving of fruit; with no concern for the fact that there was no fiber in the juice and significantly more carbohydrates per serving.  Carbs were perceived as ”good” and fat was promoted as ”bad”.  As a result of these changes, under this new Canada’s Food Guide, one could have 3 glasses of juiceone serving of potato and a tiny salad and ”meet” the guidelines.

Canada’s Food Guide — 1982

Adult guidelines promoted;

cfg_history_1982_two_small2 servings (skim, 2%, whole) milk, buttermilk or yogourt (1 serving = 1 cup milk, ¾ cup yogourt, 1 ½ oz cheese)

4-5 servings fruit & vegetables (at least 2 vegetables) – cooked, raw or fruit juices, include yellow or green or green leafy vegetables

3-5 servings of Bread and Cereal

2 servings  Meat and Alternates – (1 serving = 2-3 oz lean cooked meat, fish or poultry or 2 eggs or 1 cup dried cooked legumes or ½ cup* nuts or seeds).

Reference: Ballantyne, R.M., Bush, M.B. (1980). An evaluation of Canada’s food guide and handbook. Nutrition Quarterly, 4(1):1-4.


Canada’s Food Guide — 1992

In 1992, Canada’s Food Guide became Canada’s Food Guide to Healthy Eating.

A new ”total diet approach” aimed to meet both energy (calories) and nutrient requirements, resulted in large ranges in the number of servings in the four food groups.

To meet higher energy needs, the Guide encouraged selection of more servings from the Grain Products and Vegetables and Fruit groups — resulting in an even higher percentage of carbohydrates in the diet.

Adult guidelines servings changed as follows:

cfg_history_1992_two_small3-5   5-12 servings of Bread and Cereal

4-5   5-10 servings fruit & vegetables (at least 2 vegetables) – cooked, raw or fruit juices, include yellow or green or green leafy vegetables

2   2-4 servings (skim, 2%, whole) milk, buttermilk or yogourt (serving = 1 cup milk, ¾ cup yogourt, 1 ½ oz cheese)

2   2-3 servings Meat and Alternates – (1 serving = 2-3 oz lean cooked meat, fish or poultry or 2 eggs or ½ – 1 cup cooked legumes or 2 Tbsp. peanut butter)

Grain Products were now 1st on list (5-12 servings!); reflecting the shift that most of calories (45-65% of calories) were to come from carbs.

Vegetables and Fruit were put 2nd on the list (5-10 servings) and could still be chosen as all carbs (potato, yams, other starchy vegetables, fruit, fruit juice) and along with this, there was a continued decrease in calories from fat (e.g. nut butters went from ½ cup — 1 cup in 1977 to ½ cup 1982 to 2 Tbsp. in 1992)

Also in this Guide, cheese was categorized with milk and yogourt — even though other ways of accounting for food such as the Diabetic Exchanges, classify cheese with Meat and Alternates (and nut butters with fat).


In 2005, there were even more changes to Canada’s Food Guide to Healthy Eating.  This is the Guide currently in use in Canada.

The numbers of servings were broken down based on stage of life and gender, but continuing the emphasis on high carbohydrate, low fat.  There were different number of servings per day for children aged 2-3, aged 4-8, aged 9-13, adolescent girls (aged 14-18), adolescent boys (aged 14-18), men (until aged 50), women (until aged 50) and then men over 50 and women over 50.

While Vegetables and Fruit were now put 1st instead of Grain Products, these could still be chosen as mostly carbs (potato, yams, other starchy vegetables, fruit, fruit juice), so with Grain Products put 2nd, carbs still formed the bulk of daily calories.


Canada’s Food Guide — 2005

Adult guidelines promoted (adults aged 19-50 years):

CFG 20055-10   7-8 (women) 8-10 (men) servings fruit & vegetables (at least 2 vegetables) – cooked, raw or fruit juices, include yellow or green or green leafy vegetables

5-12   6-7 (women) 8 (men) servings of Grain Products

2-4   2 (women and men) servings (skim, 2%, whole) milk, buttermilk or yogourt (serving = 1 cup milk, ¾ cup yogourt, 1 ½ oz cheese)

2-3 servings Meat and Alternates – (1 serving = 2-3 oz lean cooked meat, fish or poultry or 2 eggs or ½ – 1 cup cooked legumes or 2 Tbsp. peanut butter)

Recommendations include:

Vegetables and Fruit

go for orange vegetables such as carrots, sweet potatoes* and winter squash*

*Note: starchy vegetables such as sweet potato and winter squash contain the SAME number of carbohydrates per serving as a serving of Breads and Cereals i.e. 15 g carbohydrate per ½ cup serving compared with non-starchy vegetables such as asparagus, broccoli and salad greens.

Under this Guide, Vegetables and Fruit can contribute 105 g — 150 g carbs per day (400 — 600 calories per day) if chosen as starchy vegetables and fruit / fruit juice.

Milk and Alternates

The Guide recommends: ”Drink skim, 1% or 2% milk each day” which overlooks the satiety (feeling fuller) effect of higher fat dairy.

”select lower fat milk alternates” — fails to look a the fact that loads of sugar as flavouring replaces the fat, contributing the equivalent of 2 — 4 servings of carbs per 3/4 cup serving (where a serving of carbs as per the Food Exchanges is considered 15 g carbohydrate per serving)

Oils and Fats

The Guide recommends: ”include a small amount (2-3 Tbsp.) of unsaturated fat each day.  This includes oil for cooking, salad dressing, margarine and mayonnaise. Use vegetable oils such as canola and soybean” resulting in the decrease of healthy-monounsaturated fats such as olive oil, nuts and seeds.

Children

The Guide recommends to ”serve small nutritious meals and snacks daily

Three meals AND a few snacks?

What effect have these dietary recommendations had on obesity statistics?

Let’s look at children;

  • In 1978, only 15% of children and adolescents were overweight or obese.
  • By 2007, that rate doubled to 29% of children and adolescents being overweight or obese.
  • By 2011, obesity prevalence alone for boys was 15.1% and for girls was at 8.0% in 5 to 17 year olds.

What about adults?

  • The prevalence of obesity [body mass index (BMI) ≥30 kg/m2] in Canadian adults increased from 10% in 1970-72 to 26% in 2009-11
  • Based on waist circumference 37% of adults and 13% of youth are abdominally obese.
  • Looking at these numbers slightly differently, as of 2013, there were approximately 7 million obese adults and 600 000 obese school-aged children in Canada

One has to wonder whether this dramatic increase in obesity and overweight after 1977 is correlated to Canada’s Food Guide shift to lower fat, higher carbohydrate diets.

In my  Dietetic practice, I give clients a choice of meal plan patterns because I don’t believe three meals and three snacks per day with 45-65% of calories as carbohydrate is the best way for people to address the matter of their excess weight.

For clients that come to me insulin resistant and/or overweight, I explain based on the literature why I recommend a meal plan pattern based on full meals without snacks with most of the calories coming from heart healthy satiety-offering monounsaturated fats. When clients are able to eat until they are satisfied without feeling hungry between meals and without feeling deprived, they are able to lose weight naturally and relatively easily.

Of course if clients want a meal plan based on the traditional 3 meals and 3 snack meal pattern I provide that for them using current recommendations.  There is no question that both ways, people can lose weight and lower their blood sugars, but my interest as a Dietitian is not only to see people’s weight and blood sugar and cholesterol come down, but to also see them feeling good and being happy with the process.

If you would like more information on the services I offer, please click on the Contact Us tab, above to send me a note.

Note: Everyone’s results following a LCHF lifestyle will differ as there is no one-size-fits-all approach and everybody’s nutritional needs and health status is different. If you want to adopt this kind of lifestyle, please discuss it with your doctor, first.

Copyright ©2015 The LCHF-Dietitian (a division of BetterByDesign Nutrition Ltd.) 

LEGAL NOTICE: The contents of this blog, including text, images and cited statistics as well as all other material contained here (the ”content”) are for information purposes only.  The content is not intended to be a substitute for professional advice, medical diagnosis and/or treatment and is not suitable for self-administration without the knowledge of your physician and regular monitoring by your physician. Do not disregard medical advice and always consult your physician with any questions you may have regarding a medical condition or before implementing anything  you have read or heard in our content.

Canada’s Food Guide — an Epidemiological Experiment Gone Terribly Wrong?

Health Canada released a statement this past Tuesday (May 19, 2015) implying they may change Canada’s Food Guide recommendations. Their statement came just a week after a Canadian Medical Association Journal released a report a week earlier (May 11, 2015) summarizing some of the criticisms of the Guide made by healthcare professionals who presented at the Canadian Obesity Summit in Toronto at the beginning of May.  One of the criticism included Health Canada’s current endorsement of 100% juice as equivalent to a serving of fruit.

Canada’s Food Guide (officially called Eating Well with Canada’s Food Guide) recommends that Canadian adults consume up to 10 servings of fruit and vegetables a day (depending on age and gender) and with a half-cup of juice counting as a single serving, it’s easy to see how a person might drink a few cups of fruit juice a day in order to try and meet that requirement.  The problem arises that even a single glass of orange juice can put you over the daily sugar limit recommended by the World Health Organization (WHO).

In March, the World Health Organization (WHO) released a report entitled Guideline: Sugars intake for adult and children where it concluded that the world was consuming too much sugar and recommended that people cut their intake of sugar to the equivalent of just six to 12 teaspoons per day.

Many popular brands of 100% orange and apple juice sold in Canada contain as much as five teaspoons of sugar per serving so it’s easy to see that if the public is trying to meet their 7-10 servings of fruit and vegetables by drinking juice, they will be way over the WHO’s daily sugar limit.

A study from the UK that was just published 2 weeks ago in the European journal Diabetologia linked daily consumption of sweetened drinks including so-called ”healthy” beverages like sweetened milk and fruit juice with increased diabetes risk. The study found that for each 5% increase of a person’s total energy intake provided by sweet drinks (even so-called ”healthy ones” like chocolate milk and 100% juice) that the risk of developing Type 2 diabetes could rise by 18 %. The study also found that by replacing one sweetened drink with water or unsweetened tea or coffee per day could help cut the risk of developing diabetes by as much as 25%.

This most recent statement from the director of the Office of Nutrition Policy and Promotion Hasan Hutchinson said the department is currently ”reviewing the evidence base for its current guidance” to Canadians and that ”depending on the conclusions of the scientific review, guidance for consumption (quantity and frequency) of various foods, including juice, could be updated in the future“. In my opinion, consumption of 100% fruit juice as equivalent to a serving of Vegetables and Fruit is not the only aspect of Canada’s Food Guide that Health Canada needs to re-evaluate.

Shift to a Carbohydrate-based Diet; how has that worked out?

Prior to 1977, Canada’s Food Guide recommended no more than 5 servings of bread or cereal per day for adults and now recommends 6-7 servings per day of Grain Products for women and up to 8 servings of Grain Products per day for men. In 1961, Canada’s Food Guide recommended only 1 serving of citrus fruit (as fruit) or a serving of tomatoes daily & only one other fruit.  Now adults can have any of the recommended 7-10 servings of Vegetables and Fruit per day as fruit (or juice). Even as actual servings of fruit, current recommendations can be chosen as 4-5 times the amount of fruit as in in 1961.

Since 1977 and in ever increasing amounts, Health Canada has shifted their recommendations away from healthy fats and low carbohydrate diets, towards diets where carbohydrates form the main source of calories.  Current recommendations are for 45-65% of calories to come from carbohydrate and only 20- 30% of calories from fat.  Our society has become ”fat phobic” thinking all sources of fat are ”bad”. People drink skim or 1% milk and eat 0% yogourt and low fat cheese; all the while making sure to have ”enough’ carbohydrates; 6-8 servings of Grains Products (including bread, pasta and rice). Hidden as Vegetables are even more carbohydrates as the 7-10 servings of Vegetables and Fruit which are recommended for an adult to eat makes no distinction between starchy vegetables (like potatoes, yams, peas and corn) and non-starchy vegetables (like salad greens and asparagus or broccoli). People can literally eat all their Vegetable and Fruit servings as carbohydrate laden starchy vegetables and fruit and ”meet” Canada’s Food Guide!

Canadians are encouraged to fill themselves up on toast or cereal for breakfast, sandwiches or rice for lunch and pasta or pizza (with ”healthy toppings”) for supper; all in an effort to ”meet” Canada’s Food Guide.

At the same time, people have been conditioned to avoid fats because they believe that fat is ”bad”; while making no distinction between healthy fats from avocado, nuts, seeds and fatty fish and fats from chemically cured bacon and nitrite- laden sausage.

What Has Happened to Canada’s Obesity Rates since 1977?

In ever increasing amounts, Health Canada has recommended that we avoid fat and get 1/2 to 2/3 of our calories from carbohydrates? How has Canada’s obesity rate changed since then?

In 1978, only 15% of children and adolescents were overweight or obese.

By 2007, 29% of children and adolescents were overweight or obese.

By 2011, just the obesity prevalence for boys was 15.1% and for girls was 8.0% in 5- to 17 year olds.

What about adults?

The prevalence of obesity [body mass index (BMI) ≥30 kg/m2] in Canadian adults increased two and a half times; from 10% in 1970-72 to 26% in 2009-11.

In 1970-72 7.6% of men and 11.7% of women were considered obese.

In 2013, 20.1% of men and 17.4% of women were considered obese.

And looking at waist circumference rather than BMI, 37% of adults and 13% of youth are currently considered abdominally obese.

So how has Health Canada’s recommendations of a high carbohydrate low fat diet been working out?

Certainly there must be a better way?

There is.

More in my next blog.

In the meantime, if you would like to learn a better way to think about food why not contact me?

I can help you begin to tackle overweight or obesity in a way that encourages eating healthy fat and which are supported by current research literature.

I can also help you learn which sources of carbohydrate provide the best nutrition to meet your daily recommended nutrient intake for vitamins and minerals as well as how to eat in a way that can begin to tackle one of the main issues associated with being overweight; that of insulin resistance.

Click on the “Contact Us” tab above, to send me a note.


References

Canadian Medical Association Journal, Early Releases (May 11, 2015), Food Guide Under Fire at Obesity Summit, www.cmaj.ca/site/earlyreleases/11may15_food-guide-under-fire-at-obesity-summit.xhtml

http://www.cbc.ca/news/health/canada-food-guide-s-listing-of-juice-as-a-fruit-serving-called-bananas-1.3080658

http://www.ctvnews.ca/health/will-fruit-juice-be-cut-from-canada-s-food-guide-1.2380960

Janssen I, The Public Health Burden of Obesity in Canada, Canadian Journal of Diabetes, 37 (2013), pg. 90-96

Nutrition Division, National Department of Health and Welfare (1961). Rules out – guide in. Canadian Nutrition Notes, 17(7):49-50 (cited in Health and Welfare Canada. Action towards healthy eating: technical report. 1990).

O’Connor, L, Imamura F, Lentjes M et al, Prospective associations and population impact of sweet beverage intake and type 2 diabetes, and effects of substitutions with alternative beverages, Diabetologia May 6, 2015 [Epub ahead of print]

Statistics Canada, Overweight and obese adults (self-reported) 2009, http://www.statcan.gc.ca/pub/82-625-x/2010002/article/11255-eng.htm

World Health Organization, Guideline: Sugars intake for adult and children, March 2015, http://who.int/nutrition/publications/guidelines/sugars_intake/en/

Note: Everyone’s results following a LCHF lifestyle will differ as there is no one-size-fits-all approach and everybody’s nutritional needs and health status is different. If you want to adopt this kind of lifestyle, please discuss it with your doctor, first.

Copyright ©2015 The LCHF-Dietitian (a division of BetterByDesign Nutrition Ltd.) 

LEGAL NOTICE: The contents of this blog, including text, images and cited statistics as well as all other material contained here (the ”content”) are for information purposes only.  The content is not intended to be a substitute for professional advice, medical diagnosis and/or treatment and is not suitable for self-administration without the knowledge of your physician and regular monitoring by your physician. Do not disregard medical advice and always consult your physician with any questions you may have regarding a medical condition or before implementing anything  you have read or heard in our content.

Why do we Gain Weight — the Myth of ”Calories in, Calories out”

People often assume that the answer to the question why do we gain weight is obvious and it is because people eat more calories than they burn; the old ”calorie in, calorie out” paradigm.  That is, calories not used in some form of exercise are converted to fat and stored.  If we assume that the cause of weight gain is that simple, then the solution must be equally simple; eat less and exercise more, right? But is it?

Many Physicians and Dietitians continue to hold to this ”calorie in, calorie out” model and to counsel their patients that in order to lose the stored fat, they need to eat less and exercise more.  If it is really that simple, then why are 4.7 million adults in Canada classified as obese and more than 40% of men and 27% of women classified as overweight? If it is that simple, why do obesity statistics continuing to rise? Because it isn’t that simple.

There is an underlying assumption that ”calories in” and ”calories out” are two independent events.  That is, if you reduce ”calories in”, ”calories out” is unaffected. The difficulty lies in that the body decides where it is going to ”spend” the calories taken in. Let’s say we take in 2000 calories; some will be used for the energy we need during a 24-hour period by our body during resting conditions (Basal Energy Expenditure) and some will be used to synthesize muscle, bone or other proteins.  ”Calories out” is not just exercise.

Another underlying assumption is that all calories are created equal. But are they? First what is a calorie?

A calorie is the amount of heat that is released when certain foods are burned in a laboratory.  It doesn’t matter if the food is protein, fat or carbohydrate, if they have 100 calories then 100 calories of heat is released when they are burned. So in the ”calorie in, calorie out” model it really doesn’t matter what we eat whether it is broccoli or butter, in the end it only matters how many calories they add up to.  Period.

If we start with the assumption that ”calories in” are independent of ”calories out” then the only thing that really matters is how many calories we take in, not from what sources. In this model, since all food is burned and a certain amount of calories are released, then we arrive at the conclusion that weight gain is simply a matter of comparing what goes in (energy) to what goes out (energy expenditure).  In this simplistic view, weight gain is caused by having too many calories (energy) compared to too little exercise (energy expenditure).  But it is not that simple.

Some of the energy expenditure will be for building tissue, staying warm, cognitive function and our bodies determine whether ”calories in” go to those involuntary functions over voluntary exercise Looking at weight loss in terms of the ”calorie in, calorie out” model fails to take into account that the body will slow its metabolism in response to reduced calories, because it needs to use those calories for vital functions so restricting calories doesn’t necessarily translate to weight loss.

Furthermore, assuming that all foods can be boiled down to how many calories they contain fails to take into consideration that the composition of different types of foods actually increases or decreases hunger and thus eating when and what and how much we eat. The assumption by many health care professionals has been that obese people are overweight because their metabolism has slowed and that keeps them from burning off the calories they take in.

To explain this in terms of the ”calories in calories out” model, say a slim person takes in 2000 calories and has a Total Energy Expenditure (TEE) [the amount of calories they burn per day] of 2000 calories, which means they don’t gain or lose weight. An obese person will take in the same 2000 calories, but assuming their TEE is lower, say 1500 calories, 500 calories are store as fat and they gain a pound. But is that in fact so?

A recent study however has disproved this.

When measured in the laboratory, obese people had a Total Energy Expenditure (TEE) of 3244 calories compared to lean people who had a TEE of 2404 calories. That is, when excess calories are eaten in someone who is already obese, the body will actually increase its Basal Energy Expenditure (BEE) to try and get rid of those calories.

So why are obese people obese?

Shouldn’t this increase in Total Energy Expenditure over time caused them to burn off those calories and become lean again? Actually, body weight, like other functions in our body is a closely regulated system and we have so something called a ”Set Point” which acts to regulate it. When too many calories are taken in, the body tries to get rid of them and when too few calories are taken in, the body tries to conserve them. The body does this to maintain its set point’. So if we are overweight, the body will adjust its processes to maintain that set point. More on that below. It is not about how many calories we take in but what changes the Set Point.

People also make the assumption that how much we eat (”calories in”) is voluntary; that is we can choose to eat or not eat, but there are a number of hormones such as leptin, ghrelin, cholecystokinin, and peptin YY that tell our body when we are hungry and we are not. Hunger and satiety (feeling full) are under hormonal control and as such, when we eat (”calories in”) is not voluntary.

People also assume that Calories Out’ is voluntary; that we control how much exercise we do and assuming that our basal energy expenditure is stable and unchanging over time, we ignore it.  But it is not. This mistaken belief that the only variable that changes is the energy expended in voluntary exercise and that this consumes a major proportion of our calories leads to the conclusion that ”diet” and ”exercise” are equal partners in weight management and they aren’t.

The fact is, most of our Total Energy Expenditure is used for generation of body heat and other metabolic processes (called Basal Energy Expenditure). Furthermore, Basal Energy Expenditure is not stable and can increase or decrease by as much as 50%. This up-regulation and down-regulation of our body processes contributes way more to weight loss or gain than exercise does. But that is not what we’ve been told.  We have believed that if we just exercise more and eat less we will lose weight. Let’s look at this a little more closely.

What happens to our body if we suddenly restrict caloric intake? According to ”calories in calories out” model, a reduction in calories will result in Total Energy Expenditure (TEE) using fat for energy and the person would lose weight.  Sounds great except that is not what happens.

In fact, Total Energy Expenditure drops substantially — by as much as 30-50%.  People complain of being unable to stay warm even with plenty of clothing and that is because calories are spared in heating the body. Heart rate and blood pressure drop to conserve energy (calories).  People even find it difficult to concentrate because the brain is very metabolically active and restricting calories suddenly turns that down. Calories are needed to move, so in sudden calorie restriction people feel weak during physical activity. In other words, metabolism slows.

Why does the body do this? It’s survival.

Consider a person normally eating 3000 calories a day suddenly starts eating 2000 calories a day.  If they were to continue to burn 3000 calories daily, they would soon deplete all their fat stores, then their protein stores and then they would die. The body tightly regulates body weight and compensates for this sudden decrease in calories by saving calories from its Total Energy Expenditure.  Instead of burning fat in storage, the body reduces its caloric expenditure on body functions to 2000 calories a day and restores balance.

The ”calorie in calorie out” model does not factor in that basal energy expenditure is not stable.  It ignores that restricting calories results in down-regulation in Total Energy Expenditure. That is, ”calories in” and ”calories out” are not independent.

The ”calorie in calorie out” model of weight gain also ignores that hunger, eating and fat storage are regulated by numerous hormones. Leptin (a hormone correlated to the amount of body fat) is one such mechanism, adiponectin (a hormone suppressed in obese people) may be another mechanism and there are others being researched.  It is also believed that cortisol, the stress hormone may play a role.  But there is one well-known hormone that plays a very significant role in hunger, eating behavior and fat management and that is insulin. Insulin’s effect will be covered in detail in future blogs. A little teaser’; we as health care practitioners have been focusing on blood glucose while overlooking insulin, which regulates it.

So in summary,

  1. ”calories in” and ”calories out” are not independent, but one affects the other.
  2. ”Calories in” is not only under voluntary control (what and how much we choose to eat) but several hormone play a significant role in terms of hunger and fat storage.
  3. ”Calories out” is not only controlled voluntarily through exercise but also involuntarily by up-regulating and down-regulating basal metabolic expenditure (tissue synthesis, heat generation, etc).
  4. Fat storage is not simply a result of having more ”calories in” than ”calories out” burned as exercise.

So what causes us to gain weight? This will be the topic of future blogs.

REFERENCES

DeLany J P, Kelley D E, Hames K C et al, High energy expenditure masks low physical activity in obesity, International Journal of Obesity 37, 1006-1011 (July 2013)

Fung, Jason, Intensive Dietary Management, The Aeteology of Obesity, August 2013

Health Canada, Overweight and Obese Adults (2102), http://www.statcan.gc.ca/pub/82-625-x/2013001/article/11840-eng.htm


Copyright ©2015 BetterByDesign Nutrition Ltd.  LEGAL NOTICE: The contents of this website, including text, images and cited statistics as well as all other material contained here (the ”content”) are for information purposes only.  The content is not intended to be a substitute for professional advice, medical diagnosis and/or treatment and is not suitable for self-administration without regular monitoring by a Registered Dietitian and with the knowledge of your physician. Do not disregard medical advice and always consult your physician with any questions you may have regarding a medical condition or before implementing something you have read in our content. 

Role of Green Tea Powder (Matcha) in Weight and Abdominal Fat Loss

UPDATE: 

(April 25, 2017) Be sure get the recipe for a Low Carb High Healthy Fat Matcha Smoothie here: https://www.lchf-rd.com/2017/04/24/low-carb-green-tea-matcha-smoothie-role-in-weight-and-abdominal-fat-loss/.

Less than 3 gm of carbohydrate at all the health benefits of Matcha!


Introduction

Recent estimates indicate that about 1/3 of the adult population in the US is obese [Centers for Disease Control and Prevention, 2009] and while 2011 estimates in Canada indicate that approximately 1/5 of Canadians adults are classified as obese based on self-reported height and weight [Statistics Canada], studies have found that obesity rates in self-reported weight is ~7.4% higher when based on measured height and weight [Shields et al].  Adjusting for this under self-reporting of weight, > 1/4 (25.6%) of the adult population in Canada would be considered obese.  Recent literature suggests that obesity and the related diseases of ”metabolic syndrome” associated with obesity are not just a North American problem either, but a global health problem [Popkin].Although there are many genetic and environmental factors that may predispose people to weight gain, the main cause of overweight and obesity is believed to be an imbalance between dietary intake and energy expenditure (i.e. calories in > calories out).  Excess fat mass develops over time from a very small positive energy imbalance i.e. just taking in slightly more calories than needed.  In general, average weight gain per year is small; approximately 1 pound per year across all race, economic, and sex groups [Brown].There are many strategies used to address weight gain, including;-         

Dietary approaches; which usually focus on decreasing caloric intake through a variety of means and while some people go on self-chosen ”diets” that are bizarre and even dangerous, weight loss will occur as long as energy intake is less than energy expenditure (i.e. calories in < calories out).

–          Lifestyle strategies that help individuals identify and modify their eating behaviour and patterns of eating.  When people understand why they eat and when they eat, it is easier for them to make long-term lifestyle changes.

–          Exercise and increased physical activity to help people attain and maintain a healthy body weight.

–          Food intake is sometimes addressed pharmacologically by doctors by using drugs such as Orlistat (which blocks lipase, an enzyme involved in fat absorption).

–          Surgical approaches provide the most dramatic weight loss and outside of the cosmetic value, may have a role in reducing long-term mortality and the incidence of diabetes [Bray].

Role of Green Tea Catechins in Weight Loss

Green tea is the unfermented leaves of the Camellia sinensis plant and contains a number of biologically active compounds called catechins and epigallocatechin gallate (EGCG) makes up almost 30% of the solids in green tea [Kim et al].  Recent studies have found that green tea catechins, especially EGCG play a significant role in both weight loss and body fat composition.

Green Tea Catechins and ”Metabolic Syndrome”

Several large-scale population studies have linked increased green tea consumption with significant reductions in ”metabolic syndrome” which is a cluster of diseases that include;

–          insulin resistance or diabetes

–          hyperinsulinemia (high levels of insulin in the blood)

–          cardiovascular diseases; high blood pressure & coronary heart disease

–          obesity

It is thought that epigallocatechin gallate (EGCG), the most abundant catechin in green tea, mimics the actions of insulin.  This has positive health implications for people with insulin resistance or diabetes [Kao et al] and EGCG also lowers blood pressure almost as effectively as the ACE-inhibitor drug, Enalapril, having significant implications for people with cardiovascular disease [Kim et al].

Green Tea in Population Studies

Population studies and several randomized controlled studies (where one group is ”treated” and the other group is not) have shown that waist circumference is smaller and levels of body fat is less the more green tea consumed  [Phung et al] .  The anti-obesity effects of green tea are usually attributed to the presence of catechins [Naigle].

Green Tea Catechins

While catechins make up ~ 30% of green tea’s dry weight (of which 60—80% are catechins) oolong and black tea, which are produced from partially fermented or completely fermented tea leaves contains approximately half the catechin content of green tea.

Drinking 8-10 cups of green tea per day is enough to increase blood levels of EGCG into a measurably significant range [Kim et al]. Matcha, a powdered green tea used in the Japanese tea ceremony and popular in cold green tea beverages such as bubble tea, contains 137 times greater concentration of EGCG than China Green Tips (Mao Jian) tea [Weiss et al].

 Green Tea Catechin Content of Brewed Green Tea vs Matcha Powder

A typical cup (250 ml) of brewed green tea contains 50—100 mg catechins and 30—40 mg caffeine, with the amount of tea leaves, water temperature and brewing time all affecting the green tea catechin content in each cup.

A gram (~1/3 tsp) of matcha powder contains 105 mg of catechins (of which 61 mg are EGCs) and contains 35 mg of caffeine. Most matcha drinks made at local tea and coffee houses are made and served cold and contain ~1 tsp of matcha powder which contains ~315 mg of catechins (of which ~183 mg are EGCs).  Since there is no brewing time involved in the preparation of cold matcha beverages, the amount of catechins remains relatively constant in each cup. Variation in catechin content in matcha powder is largely due to where the plant is grown and how it is processed.

Weight Loss Effect of Green Tea Catechins

A 2009 meta-analysis (combining the data from all studies) of 11 green tea catechin studies found that subjects consuming between 270 to 1200 mg green tea catechins / day (i.e. 1 — 4 tsp of matcha powder per day) lost an average of 1.31 kg (~ 3 lbs) over 12 weeks [Hursel].

 Decreased Body Fat & Abdominal Fat even without Significant Weight Loss

The effect of green tea catechins on body composition is significant even when the weight loss between ”treated” and ”untreated” groups is small (~5 lbs in 12 weeks).

Even with such small amounts of weight loss;

– the total amount of abdominal fat decreases 25 times more with green tea catechin consumption than without it (−7.7 vs. −0.3%)

and

 total amount of subcutaneous abdominal fat (the fat just below the skin of the abdomen) decreases almost 8 times more with green tea catechin consumption thank without it (−6.2 vs. 0.8%).

 How do Green Tea Catechins Work?

The mechanisms by which green tea catechins reduce body weight and reduce the amount of total body fat and in particular reduce the amount of abdominal fat are still being investigated.  It is currently thought that green tea catechins;

–          increased thermogenesis; i.e. increased heat production which would result in increased energy expenditure (or calorie burning)

–          increase fat oxidation (or using body fat as energy)

–          decrease appetite

–          down-regulation of enzymes involved in liver fat metabolism

–          decrease nutrient absorption

 Green Tea Absorption

Green tea catechins are absorbed in the intestine.  Since the presence of food significantly decreases their absorption, green tea catechins are best taken 1/2 an hour before meals or 2 hours after meals.

The timing of green tea catechin intake may also affect the absorption and metabolism of glucose.  A study by Park et al found that when green tea catechins were given one hour before to a glucose (sugar) load, glucose uptake was inhibited and was also accompanied by an increase in insulin levels. Taking green tea catechins an hour before consuming highly sweet foods may be beneficial for those with insulin resistance or diabetes.

Green Tea Catechins and Milk

There seems to be some dispute in the literature as to whether the casein (a protein) in milk binds green tea catechins, making them unavailable for absorption in the body, which is why matcha drinks are often made with non-milk beverages such as soy milk, almond milk or rice milk (that don’t have casein).

Conclusion

Consuming between 1 — 4 tsp of matcha powder per day (270 to 1200 mg green tea catechins / day) is sufficient to result in weight loss of approximately 3 lbs in 12 weeks (with no other dietary or activity changes) and to significantly decrease body fat composition and reduce the quantity of abdominal fat.
 

***Warning to pregnant women***

While EGCG has also been found to be similar in its effect to etoposide anddoxorubicin, a potent anti-cancer drug used in chemotherapy [Bandele et al], high intake of polyphenolic compounds during pregnancy is suspected to increase risk of neonatal leukemia. Bioflavonoid supplements (including green tea catechins) should not be used by pregnant women [Paolini et al].

Recipe for Iced Matcha 

For those of you that have been asking what I am always drinking in that thermos…this is it!

Ingredients

–          1 tsp matcha (green tea) powder (contains ~315 mg catechins)

–          500 ml soy milk

–          crushed ice

Method

  1. Place 1 tsp matcha powder in a small stainless steel sieve and gently press through the sieve into a small bowl with the back of a small spoon
  2. Put the sieved matcha powder into a ceramic or glass bowl (not metal, as the tannins in the tea will react and give the beverage and ”off” metalic taste)
  3. With a bamboo whisk (available at Japanese and Korean grocery stores), whisk 3 Tbsp boiled and cooled water into the matcha powder, until all the lumps are gone and the mixture is smooth
  4. Place 1/4 cup of crushed ice in the bottom of a tall (16 oz / 500 ml) glass
  5. Pour matcha and water mixture over ice in the glass
  6. Fill glass with soy milk (or almond milk or rice milk) *

* I use 2/3 unsweetened soy milk and 1/3 sweetened soy milk

Note: once the matcha is blended with the soy milk, the tannins in the green tea are neutralized and no longer react with metal, so the beverage can then be put in an insulated stainless steel cup.

References

Bandele, OJ, Osheroff, N. Epigallocatechin gallate, a major constituent of green tea, poisons human type II topoisomerases”.Chem Res Toxicol 21 (4): 936—43, April 2008.

Bray GA. Lifestyle and pharmacological approaches to weight loss: efficacy and safety. J Clin Endocrinol Metab 2008;93:S81—88.

Brown WJ, Williams L, Ford JH, Ball K, Dobson AJ. Identifying the energy gap: magnitude and determinants of 5-year weight gain in midage women. Obes Res 2005;13:1431—41.

Centers for Disease Control and Prevention (CDC). Overweight and obesity. http://www.cdc.gov/obesity/index.html accessed Nov 20. 2009

Hursel R, Viechtbauer W, Westerterp-Plantenga MS. The effects of green tea on weight loss and weight maintenance: a meta-analysis. Int J Obes (Lond) 2009;33:956—61.

Kao YH, Chang MJ, Chen CL, Tea, Obesity, and Diabetes, Molecular Nutrition & Food Research, 50 (2): 188—210, February 2006

Kim JA, Formoso G, Li Y, Potenza MA, Marasciulo FL, Montagnani M, Quon MJ., Epigallocatechin gallate, a green tea polyphenol, mediates NO-dependent vasodilation using signaling pathways in vascular endothelium requiring reactive oxygen species and Fyn, J Biol Chem. 2007 May 4;282(18):13736-45. Epub 2007 Mar 15.

Nagle DG, Ferreira D, Zhou YD. Epigallocatechin-3-gallate (EGCG): chemical and biomedical perspective. Phytochemistry 2006;67:1849—55.

Park JH, Jin JY, Baek WK, Park SH, Sung HY, Kim YK, et al. Ambivalent role of gallated catechins in glucose tolerance in humans: a novel insight into nonabsorbable gallated catechin-derived inhibitors of glucose absorption. J Phyisiol Pharmacol 2009;60:101—9.

Popkin BM. Recent dynamics suggest selected countries catching up to US obesity. Am J Clin Nutr 2010;91:284S—8S.

Phung OJ, Baker WL, Matthews LJ, Lanosa M, Thorne A, Coleman CI. Effect of green tea catechins with or without caffeine on anthropometric measures: a systematic review and meta-analysis. Am J Clin Nutr 2010;91:73—81.

Paolini, M, Sapone, A, Valgimigli, L, “Avoidance of bioflavonoid supplements during pregnancy: a pathway to infant leukemia?”. Mutat Res 527 (1—2): 99—101. (Jun 2003)

Rains, TM, Agarwal S, Maki KC, ”Antiobesity effects of green tea catechins; a mechanistic review” J or Nutr Biochem 22(2011):1-7

Shields M, Connor Gorber S, Trembaly MS, Estimates of obesity based on self-report versus direct measures, Statistics Canada (StatsCan), http://www.statcan.gc.ca/pub/82-003-x/2008002/article/10569-eng.htm

Statistics Canada(StatsCan) — Overweight and Obese Adults (self-reported), 2011 http://www.statcan.gc.ca/pub/82-625-x/2012001/article/11664-eng.htm

Weiss, DJ, Anderton CR, Determination of catechins in matcha green tea by micellar electrokinetic chromatography, Journal of Chromatography A, Vol 1011(1—2):173-180, September 2003