This article on the Perils of Food Processing is based on a lecture given by Gabor Erdosi, MSc, MBA— Food News Conference, May 19, 2018 — Prague, Czech Republic.
Part 1 can be read here.
INTRODUCTION: In the first part of this article on the Perils of Food Processing, we considered the effect of different types of simple food processing such as grinding and cooking on the hormonal response of the incretin hormones to carbohydrate intake. While interesting, we rarely eat meals that are only made up carbohydrate, without any fat or protein. Even if we eat a slice of bread or toast and put peanut butter on top, it is now mixture of carbohydrate, fat and protein. How does a mixed meal” with fat and protein affect the body’s hormonal response to carbohydrate? How does the presence of fiber impact this hormonal response? Does it matter how often we eat, or how fast? This and more are covered in this article.
Response of Incretin Hormones to Meal with Fat and Carbohydrate
In the first study we’re going to look at, the researchers designed a sandwich that produced a very stable glucose response in healthy individuals. The sandwich was made of 120 g of white bread, 20 g of butter and 10 g of dried meat. As can be seen from curve A, blood sugar rose to ~150 mg/dl (~8.3 mmol/L) and stayed relatively stable for the next 3 hours (180 minutes).
But what happened to the insulin response when these foods were eaten separately and together in a sandwich?

Looking at curve B (bottom), it can be seen when subjects ate only the dried meat, blood insulin levels didn’t rise much at first, but then rose a little bit at ~ 90 minutes and stayed relatively constant. When subjects ate only the butter, insulin levels rose a little bit more and then only increased slightly over the next several hours. But when they ate the sandwich with the white bread, butter and dried meat, you can see that blood insulin levels rose quite steeply, beginning before 30 minutes, reaching a maximum level at 60 minutes, and then decreased very slowly over the next several hours. This makes sense, because of the presence of the carbohydrate in the bread.
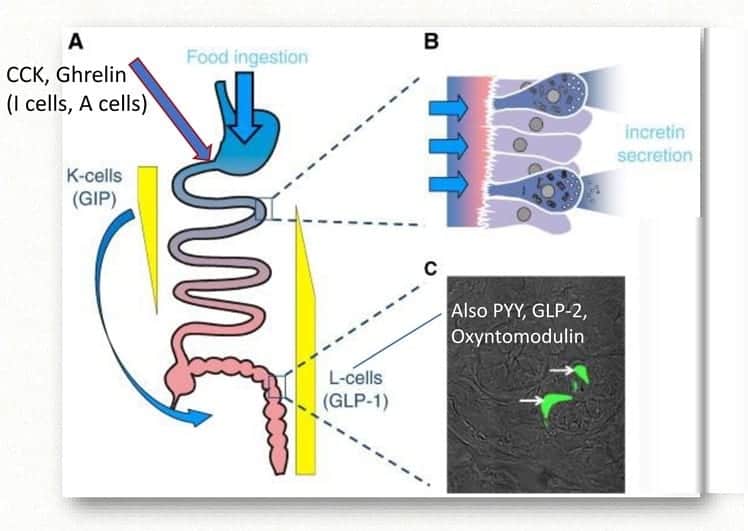
What is interesting is what happens to the two gut hormones, GIP (from the K-cells) and GLP-1 (from the L-cells) in response to eating these foods.

Looking at the second curve (graph on the right) it can be seen that in response to the mixed meal’ of the sandwich, GIP from the K-cells (high up in the intestine) is released rapidly and in large amounts. That is, a mixed meal results in a large stimulation of both insulin and glucagon release. Insulin moves the glucose into the cell for storage at the level of the fat cells increases lipoprotein lipase, which increases triglyceride storage. This is an anabolic process of storing nutrients for use later.
As can be seen from the first curve, when a mixed meal’ is eaten, GLP-1 is released from the L-cells lower down in the intestine responded but is much less pronounced. That is, in response to GLP-1 secretion, insulin is released to a small extent, but there is little of the signalling to decrease glucagon, which means little effect on the hunger signal and little satiety (feeling full).
Incretin Response to a Standard Western Diet Meal versus a Paleo-style Meal
In this next study, we can see the same effect in a plant-based meal, using a reference meal and a paleolithic style meal (called PAL2) that both had the same number of calories (~1600 kcals) and very similar macronutrient distributions (carbohydrate, fat, protein). The only difference between the reference diet and the Paleolithic type diet is the amount of processing.

The reference meal was made up of cooked, long grain rice, mango and boiled carrots, some fish cooked over dry heat and some olive oil.
The paleo type meal was made up of raw strawberries, raw apple, as well as the same significantly more fish cooked over dry heat, raw mushrooms, seedless raisins, zucchini (courgettes), flax seed, cinnamon and capers. While both of these meals had the same number of calories, as can be seen, there was a significant difference in the weight between these two meals — with the reference meal weighing only 248 g, uncooked and the paleo type meal weighing 718 g.
In each of these two types of meals, the response of the two gut incretin hormones, GIP from the upper intestine K-cells and GLP-1 from the lower intestinal L-cells were very different!
Looking at the bottom of the 3 graphs, it can be seen that GIP from the K-cells (high up in the intestine) was released rapidly and in large amounts in the reference meal — a meal that is quite similar to the Standard Western Diet. Recall that the GIP from the K-cells acts on the pancreas to trigger both insulin release from the beta-cells and to trigger glucagon release from the alpha cells. The insulin results in the body storing glucose from the meal and the glucagon release signals the body to release stored glucose, if the blood sugar falls too low. The rise of GIP in response to the paleo-type meal was very slow and gradual and didn’t rise very high, which means that much less insulin was triggered to be released from the pancreas’ beta-cells and much less glucogon was triggered to be released from the alpha-cells.
What happened to GLP-1 release from the L-cells in the lower intestine in response to these two different types of meals?
The Western-type meal (the reference meal) caused a very short rise in GLP-1 from the lower L-cells, which decreased back to baseline quickly. That means that very little additional insulin was released to move additional glucose into the cells and significantly, there was very little decrease of glucagon which means that appetite was not decreased and there was little to no stimulus to increase satiety (feeling full) and little to no signal to decrease food intake.
The paleo-type meal resulted in significant release of GLP-1, which caused the pancreas to release insulin from the beta-cells and also decreases glucagon release from the alpha-cells of the pancreas — which at the level of the brain, acts to decrease appetite and increase satiety.
This is key; based on this study, a meal based on a Standard Western Diet did not trigger the signal that the body had taken in sufficient food and that appetite could now decrease.
The Effect of Food Texture even Greater than the Effect of Macronutrient Distribution
This next study is very interesting — showing that food texture has an even greater effect on obesity induced from diet than macronutrient content of the diet.

The top graph demonstrates that mice fed a ”high fat diet” — which was really high in both sugar and fat (not just high in fat) gained significantly more weight than mice fed standard mice chow.
The bottom graph shows that if you take the standard mice chow and grind it fine into a powder and feed it to the mice, they gain weight to the same degree as when fed a diet high in fat and sugar. That is, the degree of food processing in the diet has at least as great an effect on obesity as the amount of fat and sugar in the diet itself.
There is something about grinding the food that changes the satiety/hunger signal.
Meal Size and Meal Frequency
Common advice given by nutritionists and Dietitians is that it is better to eat small, frequent meals than large meals less often, but there are some studies that support that it as far as hunger and satiety signalling are concerned, it is better to eat fewer, larger meals due to the effect of the incretin hormones.

[study on right hand side of slide]
After a low-calorie smaller meal, insulin response is proportionately higher compared to a larger meal. That is, a small meal triggers a proportionately greater insulin response that a larger meal, so if one eats small meals frequently, there is an overall greater amount of insulin released than if one eats larger meals less often.
Interestingly, it is the same for those with Type 2 Diabetes. It is possible to modulate the beta-cell sensitivity to glucose by giving obese people and those with Type 2 Diabetes fewer large meals compared to more frequent smaller meals.
Eating Speed
If one eats more slowly the incretin hormones that trigger satiety (feeling full) are released in a more pronounced manner. This holds true even when obese subjects eat calorically dense foods such as ice-cream. More of the satiety hormones are released when people eat slowly.
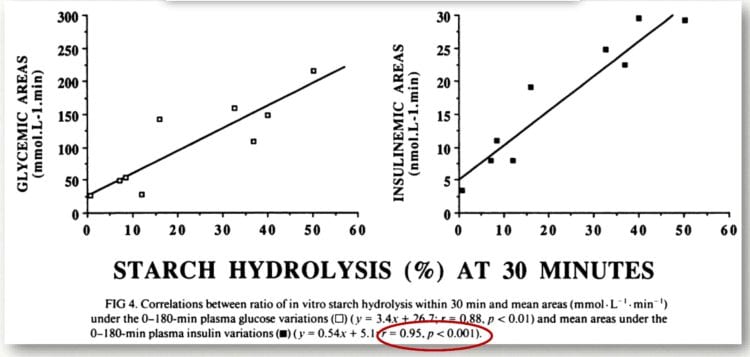
Glycemic Load as a Proxy for the Amount of Carbohydrate Processing
Glycemic Load indicates how a healthy person’s body will respond to amount of carbohydrate in one serving of a food. One usual serving of a food would be considered to have a very high Glycemic Load if it is ≥ 20, a high Glycemic Load if it is between 11-19 and a low Glycemic Load if it is ≤10.

When one compares the Glycemic Load estimated from ancient diets at the time of the Agricultural Revolution (A on the graph) compared with the Industrial Revolution (B on the graph), the Glycemic Load at the Industrial Revolution is approaching 20, and after that point, continues to go up in an almost vertical manner. That is, Glycemic Load is a fairly accurate proxy for the degree of food processing of the diet; the more processed the diet, the higher the Glycemic Load.
Amount of Fiber as a Proxy for the Amount of Carbohydrate Processing
This next graph shows the consumption of total carbohydrate over the last century — from 1909-2000 and the amount of carbohydrate from fiber as a percentage.

As can be seen, at the beginning of the century, the total amount of carbohydrate started off high and gradually decreased until about 1954, leveled off, then began to increase again. The decrease in the fiber content in carbohydrate-based foods is also evident on this graph from ~ 1960 onward.
What happened?
Perhaps it was the introduction of supposedly “healthy” polyunsaturated vegetable oils (industrial seed oils) in the 1960s that contributed to the dramatic increase in the consumption of ultra-refined carbohydrates.
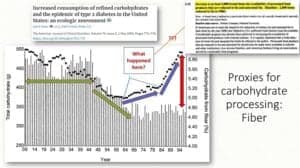
At the very same time that ultra-refined carbohydrate appeared on the scene, so were novel industrial seed oils — ultra-refined fats. Perhaps it is the combination of the two in many processed food products which contributed to carbohydrate content of the diet climbing exponentially — and along with it, obesity and metabolic diseases.
Structure and Speed of Absorption
Recall from Part 1 of this article that there are several nutrient-sensing hormones in the small intestine, but with respect to the effect of food processing, SGLT1 is a glucose sensor and both K-cells and L-cells contain this nutrient-sensing receptor.

In the morbidly obese, intestinal glucose absorption high up in the intestine is accelerated due to SGLT-1 from the K-cells. SGLT-1, along with GIP from the K-cells results in high insulin and high glucagon release, which results in both hyperinsulinemia and hyperglycemia.
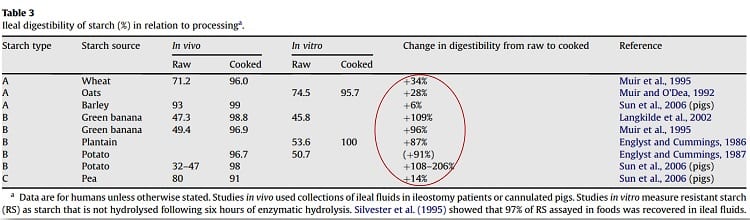
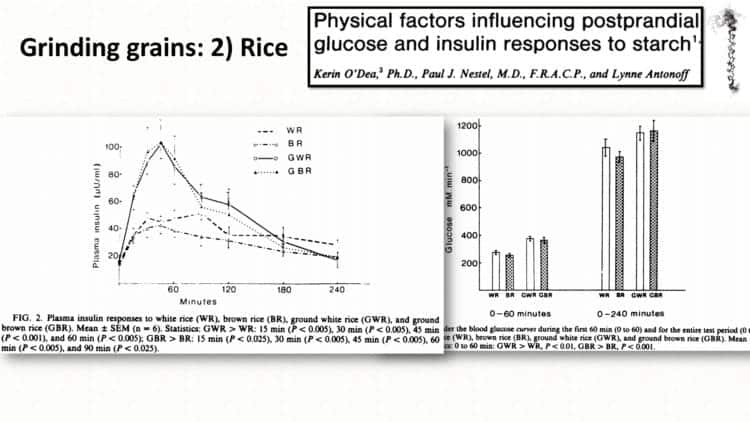
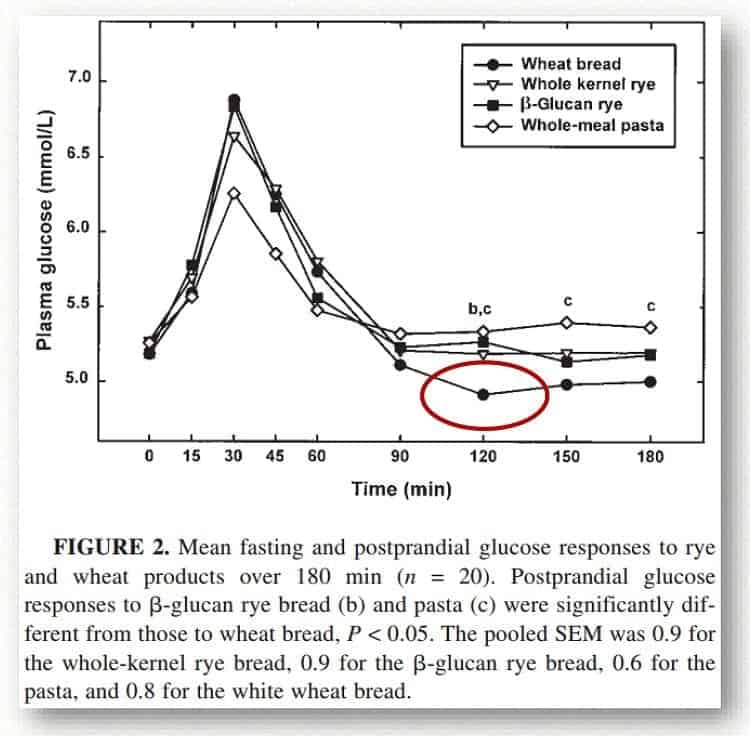
Intact structures in grain are not accessible to the digestive enzyme amylase (which breaks down starch to glucose), so when grain is consumed intact, this delays gastric emptying and creates a barrier to starch digestion. The degree to which grain is intact was found to be more effective in improving glucose metabolism than dietary fiber, irrespective of the type of cereal
Evidence for Why We Get Hungry 3-4 Hours After Eating Refined Carbohydrate
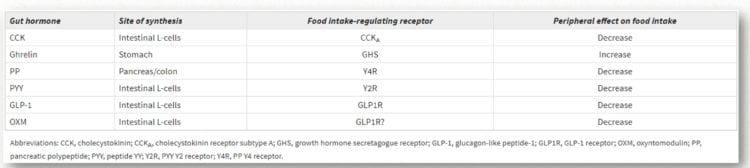
Recall from Part 1, the hormone ghrelin is the only hormone that can increase hunger.

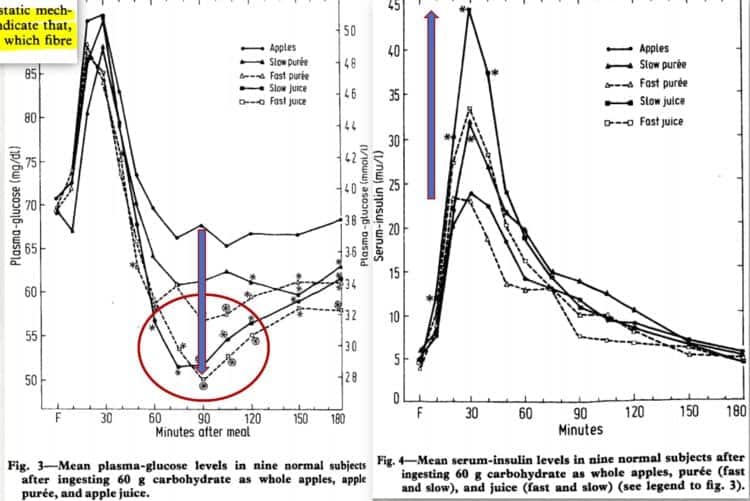
Looking at the graph in the top left, we can see that when one eats carbohydrate, ghrelin decreases at first below baseline for the first two hours (120 minutes), but then begins to rise. It continues to rise, exceeding baseline at three hours (180 minutes) and continues rising until four hours; resulting in significantly increased hunger.
At the same time as ghrelin (the hunger hormone) is increasing between 3 and 4 hours after eating refined carbs, serum glucose has dipped below baseline in response to eating refined carbs (as demonstrated in Part 1 of this article) and from 3 hours to 4 hours (180 minutes – 240 minutes), so that serum glucose remains low.
That is, in response to eating refined carbohydrates alone (without combining them with protein) you end up having low blood sugar and feel hungry 3-4 hours later. Blood glucose only gradually begins to increase until it is returns to baseline again at 6 hours (360 minutes).
This next study is a comparison between normal weight and obese people.

On the right-hand side, at the top one can see that normal weight people have normal signalling. Satiety (feeling full) goes up and one can see that PYY correspondingly goes up, hunger goes down and correspondingly, ghrelin goes down.
Below that, one can see that in the morbidly obese, their signalling for hunger and satiety is dysregulated. Satiety is going down even after they’ve eaten and correspondingly, PYY shows this dysregulation in that it also goes down. While hunger goes down and the hormone ghrelin also goes down, it is to a much lesser degree that in normal subjects.
So, the obese individuals may feel slightly less hungry, but they don’t feel satiated. This holds true whether obese individuals eat carbohydrate, protein or fat but it is especially pronounced when carbohydrate is eaten. That is, signalling is largely preserved in the morbidly obese when it comes to protein and fat, but it is lost when it comes to carbohydrate.
Obese people should avoid eating diets high in refined carbohydrate because their hunger and satiety signals are dysfunctional and they don’t receive signals that they have eaten.
Here is another study showing that in obese Chinese men, a high protein meal or a high fat meal produces more satiety and better appetite hormonal response after eating than a high carbohydrate meal.

In another study, different conditions were looked at such as whether it made a difference in the hunger hormone, ghrelin, if the carbohydrate food was eaten first or last. It turned out that it is best to eat carbs last, as ghrelin continues to decrease for 2 ½ hours (150 minutes) after eating carbohydrate.
This next illustration shows that there is positive feedback mechanism between insulin and GIP.

Insulin drives GIP expression but requires glucose to do it. When you eat food with carbohydrate, GIP in the upper intestines is released, resulting in insulin being released. If you keep eating carb-based foods, there is lots of glucose present, which continues to drive the release of more and more GIP, triggering more and more insulin to be released.
This next slide shows a study with two kinds of sugar, sucrose which is ordinary table sugar and isomaltulose, which is made up of the exact same molecules of fructose and glucose, just attached together in a different configuration.

As can be seen, sucrose causes a huge spike in plasma GIP secreted from the K-cells high up in the intestine compared to isomaltulose which triggers high insulin and high glucagon release and which results in both hyperinsulinemia and hyperglycemia. Sucrose also results in much lower release of GLP-1 from the L-cells, lower down in the intestine which results in some release of insulin, but a much smaller decreases glucagon so that at the level of the brain, there is less of a decrease in appetite and less of an increase satiety (feeling full). As a result, eating foods sweetened with sucrose results in higher glucose, higher insulin, very little decrease in appetite, less feeling full and less decreased food intake, compared with isomaltulose.
As a result, sustained feeding with sucrose in mice results in insulin resistance and fatty liver.

If these sugars are eaten with a meal, instead of alone, the effect on blood glucose and insulin is removed, but GIP release is still triggered to be released to a large extent compared with isomaltulose, and fatty liver persists in the mice in the sucrose group.
The Effect of Combining Refined Carbohydrates with Fat
As can be seen from the graph on the left hand side at the bottom, when refined carbs are combined with fat, there is a huge response of GIP.

Eating boiled potato and low-fat veal didn’t result in this effect but the addition of butter to the potato dramatically changed this.
From an evolutionary perspective it makes sense, because there are no naturally occurring cases where a food has both high carbohydrates and high fat at the same time. Our body’s have not evolved to see these two macronutrients together.
The following is from a recent overview from May 2018 which provides a summary of GIP actions in response to a high Glycemic Index meal.
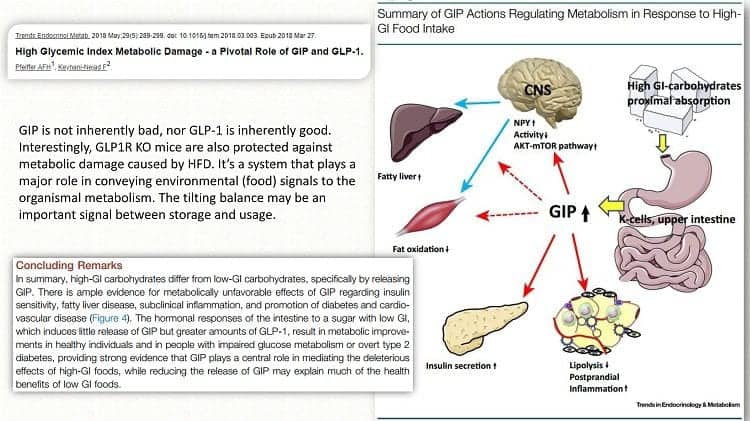
When high GI carbohydrate food is eaten and passes through digestion in the stomach and then as it enters the upper small intestine, the K-cells release GIP which has several actions, including decreasing lipolysis, increasing insulin secretion in the pancreas, decreasing fat oxidation, increasing the AKT-mTOR pathway in the brain, and increasing fat storage in the liver.
How Does Bariatric Surgery / Gastric Bypass Work
Many people assume that the reason gastric bypass works is because the stomach is made smaller, so that the person cannot overeat, but this is not primarily what makes it effective.

But what occurs within a week of the Roux-en-Y gastric bypass surgery is that there is a dramatic change in the balance of the incretin hormones.

After only a week, GIP release is ½ what it was before the surgery and GLP-1 is almost doubled.
These changes in only a week are not a result of weight loss, but of the surgery’s impact on correcting the imbalance in the incretin hormones — essentially causing an opposite imbalance’ which corrects the defect cause by the Type 2 Diabetes and overeating of ultra-refined carbs.
There are other types of surgical interventions, such as the Duodenal-Jejunal bypass liner tube that impact incretin hormones, as well as numerous medications. There are selective sodium-dependent glucose transporter 1 inhibitors that block glucose absorption and impair GIP release in the same way that a roux-en-Y gastric bypass does.

There are also numerous other medications such as sodium-glucose co-transporter 2 inhibitors, Glucagon-like Peptide 1 Agonists, and Dipeptidyl Peptidase 4 Inhibitors that impact the incretin hormones to varying degrees (and even some that claim to and do nothing!).

…and there are low carbohydrate diets that significantly reduce the release of GIP from the K-cells, because there are low levels of carbohydrate consumed at any one time to trigger it’s release. As a result, significantly less insulin is release, which is how LCHF diets followed over time lower insulin resistance.

Summary of Part 1 and Part 2 of the Perils of Food Processing
- Speed and location of intestinal nutrient absorption is crucial in determining metabolic response to a food
- The greatest effect in incretin hormone response is seen with carbohydrate rich plant processing, therefore retaining the plant or grain structure as much as possible is crucial
- Diets high in ultra-refined, quick absorbing food plausibly results in altered intestinal hormonal profile, altered hunger / satiety signalling and as a result higher food intake and increased meal frequency
- The above effect is exaggerated when ultra-processed carbohydrates are consumed in combination with significant amounts of fat (the ”doughnut effect”).
- GIP may be part of a ”thrifty mechanism” in mammals; easily digestible, high energy density foods overstimulate it (think ”honey” to hunter-gatherers).
Practical ”Takeaways”
- Processing of food that are high in fat and protein has little effect on intestinal hormone levels, so prioritize food items in terms of desired amount of macronutrients
- Plant or grain foods (carbohydrate containing) should be carefully selected based on their most dense, undisturbed structure. Processing, whether grinding, pureeing or cooking disrupts the plant / grain structure and accelerates absorption of the carbohydrate, which triggers an intestinal hormonal response which results in reduced satiety. Excluding most carbohydrate-based foods also solves this problem
- Consume carbohydrate foods at the end of the meal (after protein and fat foods)
- Have fewer, larger meals vs small, frequent ones. Avoid ”snacking” between meals
- Eat meals slowly to maximize the satiety effect and increase the release of the lower intestinal hormones.
Technical summary
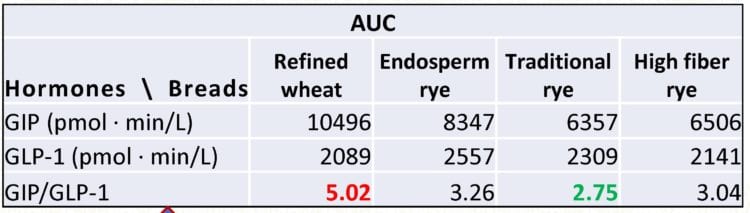
- Refined carbs trigger huge amounts of GIP, although the decreased GIP:GLP-1 ratio may be more important than the GIP AUC alone.
- Refined carbs increase GIP response to fat and proteins, and the effect of glucose and long chain fatty acids are additive.
- Fats and proteins both trigger large amounts of GIP, depending on the context
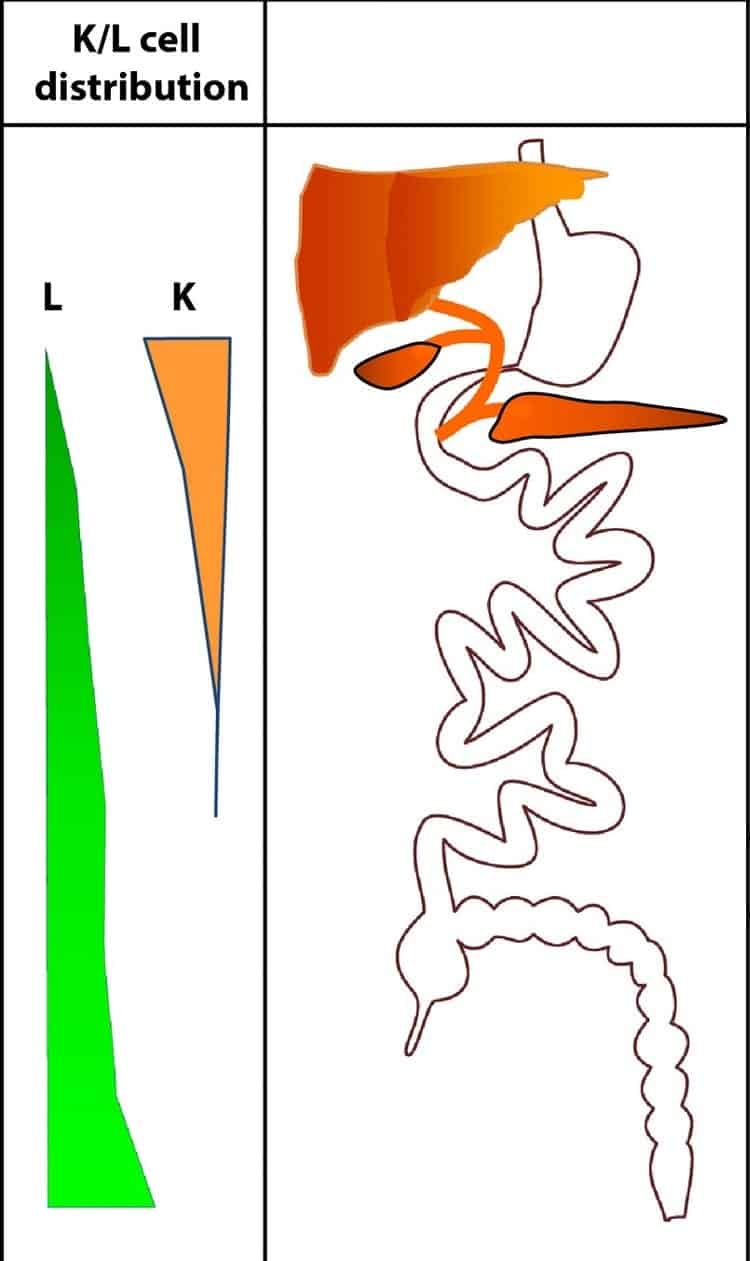
- Refined carbs does not trigger GLP-1 (does it impair it?). GLP-1 secreting L cells have an hour-glass like distribution in the small and large intestine. Duodenal GLP-1 has an important role in the so-called cephalic phase of insulin response.
- Everything triggers GLP-1, just the pattern and amount differs based on intestinal stimulation by food.
- Quick-digesting carbs are absorbed mainly in the proximal small intestins and fail to induce gastric retention. If carbs are eaten first, a huge amount of GIP is created (i.e. balance between the incretin hormones is tilted in favour of GIP release).
- Roughage, protein and fat delay gastric emptying and even out glucose release profile along the small intestine. That is, if carbs are eaten last, GLP-1 is slowly released to counter the effect of GIP.
Perhaps you wonder what all this information means for you. How should this information change the way you eat and what you eat? What does this mean in practical terms when planning dinner, or eating dinner – especially if you have Type 2 Diabetes or insulin resistance and also if you are well now, but have a family history with many common metabolic disorders. How can you change how you eat to stay well?
I can help.
Please send me a note using the “Contact Me” form located on the tab above to find out information about the services I offer (in-person or via Distance Consultation using telephone or Skype) and I will reply shortly.
To your good health!
Joy
You can follow me at:
![]() https://www.facebook.com/lchfRD/
https://www.facebook.com/lchfRD/
The full lecture can be watched here:
References
(continued from Part 1)
16. Carrel, G., L. Egli, C. Tran, P. Schneiter, V. Giusti, D. D’Alessio, and L. Tappy. ”Contributions of Fat and Protein to the Incretin Effect of a Mixed Meal.” American Journal of Clinical Nutrition 94, no. 4 (2011):
997—1003.
17. Bligh, H. Frances J., Ian F. Godsland, Gary Frost, Karl J. Hunter, Peter Murray, Katrina MacAulay, Della Hyliands, et al. ”Plant-Rich Mixed Meals Based on Paleolithic Diet Principles Have a Dramatic Impact on
Incretin, Peptide YY and Satiety Response, but Show Little Effect on Glucose and Insulin Homeostasis: An Acute-Effects Randomized Study.” British Journal of Nutrition 113, no. 04 (2015): 574—84.
18. Desmarchelier, Charles, Tobias Ludwig, Ronny Scheundel, Nadine Rink, Bernhard L. Bader, Martin Klingenspor, and Hannelore Daniel. ”Diet-Induced Obesity in Ad Libitum-Fed Mice: Food Texture Overrides the Effect of Macronutrient Composition.” British Journal of Nutrition 109, no. 08 (2013): 1518—27.
19. Vilsbí¸ll, T., T. Krarup, J. Sonne, S. Madsbad, A. Ví¸lund, A. G. Juul, and J. J. Holst. ”Incretin Secretion in Relation to Meal Size and Body Weight in Healthy Subjects and People with Type 1 and Type 2 Diabetes
Mellitus.” The Journal of Clinical Endocrinology & Metabolism 88, no. 6 (2003): 2706—13.
20. Alsalim, Wathik, Bilal Omar, Giovanni Pacini, Roberto Bizzotto, Andrea Mari, and Bo Ahrén. ”Incretin and Islet Hormone Responses to Meals of Increasing Size in Healthy Subjects.” The Journal of Clinical
Endocrinology & Metabolism 100, no. 2 (2015): 561—68.
21. Koopman, Karin E., Matthan W.A. Caan, Aart J. Nederveen, Anouk Pels, Mariette T. Ackermans, Eric Fliers, Susanne E. la Fleur, and Mireille J. Serlie. ”Hypercaloric Diets with Increased Meal Frequency, but Not Meal Size, Increase Intrahepatic Triglycerides: A Randomized Controlled Trial.” Hepatology 60, no. 2 (2014): 545—53.
22. Stote, Kim S., David J. Baer, Karen Spears, David R. Paul, G. Keith Harris, William V. Rumpler, Pilar Strycula, et al. ”A Controlled Trial of Reduced Meal Frequency without Caloric Restriction in Healthy, Normal-Weight, Middle-Aged Adults.” The American Journal of Clinical Nutrition 85, no. 4 (April 1, 2007): 981—88.
23. McQuaid, S. E., L. Hodson, M. J. Neville, A. L. Dennis, J. Cheeseman, S. M. Humphreys, T. Ruge, et al. ”Downregulation of Adipose Tissue Fatty Acid Trafficking in Obesity: A Driver for Ectopic Fat Deposition?” Diabetes 60, no. 1 (2010): 47—55.
24. Kokkinos, Alexander, Le Roux, Carel W, Kleopatra Alexiadou, Nicholas Tentolouris, Royce P. Vincent, Despoina Kyriaki, et al. ”Eating Slowly Increases the Postprandial Response of the Anorexigenic Gut
Hormones, Peptide YY and Glucagon-Like Peptide-1.” The Journal of Clinical Endocrinology & Metabolism 95, no. 1 (January 1, 2010): 333—37.
25. Rigamonti, A. E., F. Agosti, E. Compri, M. Giunta, N. Marazzi, E. E. Muller, S. G. Cella, and A. Sartorio. ”Anorexigenic Postprandial Responses of PYY and GLP1 to Slow Ice Cream Consumption: Preservation in
Obese Adolescents, but Not in Obese Adults.” European Journal of Endocrinology 168, no. 3 (March 1, 2013): 429—36.
26. Llewellyn, Clare H., Van Jaarsveld, Cornelia Hm, David Boniface, Susan Carnell, and Jane Wardle. ”Eating Rate Is a Heritable Phenotype Related to Weight in Children.” The American Journal of Clinical Nutrition
88, no. 6 (December 1, 2008): 1560—66.
27. Chapter 1. in ”Sweeteners and Sugar Alternatives in Food Technology”, 2nd Edition Kay O’Donnell (Editor), Malcolm Kearsley (Editor) ISBN: 978-1-118-37397-2 Jul 2012
28. Wiley-Blackwell Gross, Lee S., Li Li, Earl S. Ford, and Simin Liu. ”Increased Consumption of Refined Carbohydrates and
the Epidemic of Type 2 Diabetes in the United States: An Ecologic Assessment.” The American Journal of Clinical Nutrition 79, no. 5 (2004): 774—779.
29. Scazzina, Francesca, Susanne Siebenhandl-Ehn, and Nicoletta Pellegrini. ”The Effect of Dietary Fibre on Reducing the Glycaemic Index of Bread.” British Journal of Nutrition 109, no. 07 (2013): 1163—74.
https://doi.org/10.1017/S0007114513000032.
30. Nguyen, Nam Q., Tamara L. Debreceni, Jenna E. Bambrick, Bridgette Chia, Judith Wishart, Adam M. Deane, Chris K. Rayner, Michael Horowitz, and Richard L. Young. ”Accelerated Intestinal Glucose Absorption in Morbidly Obese Humans: Relationship to Glucose Transporters, Incretin Hormones, and Glycemia.” The Journal of Clinical Endocrinology & Metabolism 100, no. 3 (2015): 968—76.
31. Foster-Schubert, Karen E., Joost Overduin, Catherine E. Prudom, Jianhua Liu, Holly S. Callahan, Bruce D. Gaylinn, Michael O. Thorner, and David E. Cummings. ”Acyl and Total Ghrelin Are Suppressed Strongly by Ingested Proteins, Weakly by Lipids, and Biphasically by Carbohydrates.” The Journal of Clinical Endocrinology & Metabolism 93, no. 5 (2008): 1971—79.
32. Lomenick, Jefferson P., Maria S. Melguizo, Sabrina L. Mitchell, Marshall L. Summar, and James W. Anderson. ”Effects of Meals High in Carbohydrate, Protein, and Fat on Ghrelin and Peptide YY Secretion in
Prepubertal Children.” The Journal of Clinical Endocrinology & Metabolism 94, no. 11 (2009): 4463—71.
33. Rizi, Ehsan Parvaresh, Tze Ping Loh, Sonia Baig, Vanna Chhay, Shiqi Huang, Jonathan Caleb Quek, E. Shyong Tai, Sue-Anne Toh, and Chin Meng Khoo. ”A High Carbohydrate, but Not Fat or Protein Meal Attenuates Postprandial Ghrelin, PYY and GLP-1 Responses in Chinese Men.” PLOS ONE 13, no. 1 (January 31, 2018): e0191609.
34. Shukla, Alpana P., Elizabeth Mauer, Leon I. Igel, Wanda Truong, Anthony Casper, Rekha B. Kumar, Katherine H. Saunders, and Louis J. Aronne. ”Effect of Food Order on Ghrelin Suppression.” Diabetes
Care, 2018, dc172244.
35. Hí¤gele, Franziska A, Franziska Bí¼sing, Alessa Nas, Julian Aschoff, Lena Gní¤dinger, Ralf Schweiggert, Reinhold Carle, and Anja Bosy-Westphal. ”High Orange Juice Consumption with or In-between Three
Meals a Day Differently Affects Energy Balance in Healthy Subjects.” Nutrition & Diabetes 8, no. 1 (2018).
https://doi.org/10.1038/s41387-018-0031-3.
36. García-Martínez, Jose Manuel, Ana Chocarro-Calvo, Antonio De la Vieja, and Custodia García-Jiménez. ”Insulin Drives Glucose-Dependent Insulinotropic Peptide Expression via Glucose-Dependent Regulation of
FoxO1 and LEF1/β-Catenin.” Biochimica et Biophysica Acta (BBA) – Gene Regulatory Mechanisms 1839, no. 11 (November 1, 2014): 1141—50.
37. Pfeiffer, Andreas F.H., and Farnaz Keyhani-Nejad. ”High Glycemic Index Metabolic Damage — a Pivotal
Role of GIP and GLP-1.” Trends in Endocrinology & Metabolism, 2018.
38. Collier, G., and K. O’Dea. ”The Effect of Coingestion of Fat on the Glucose, Insulin, and Gastric Inhibitory Polypeptide Responses to Carbohydrate and Protein.” The American Journal of Clinical Nutrition 37, no. 6 (June 1, 1983): 941—44.
39. McClean, P. L., N. Irwin, R. S. Cassidy, J. J. Holst, V. A. Gault, and P. R. Flatt. ”GIP Receptor Antagonism Reverses Obesity, Insulin Resistance, and Associated Metabolic Disturbances Induced in Mice by Prolonged
Consumption of High-Fat Diet.” AJP: Endocrinology and Metabolism 293, no. 6 (October 23, 2007):E1746—55.
40. Ceperuelo-Mallafré, Victí²ria, Xavier Duran, Gisela Pachón, Kelly Roche, Lourdes Garrido-Sánchez, Nuria Vilarrasa, Francisco J. Tinahones, et al. ”Disruption of GIP/GIPR Axis in Human Adipose Tissue Is Linked
to Obesity and Insulin Resistance.” The Journal of Clinical Endocrinology & Metabolism 99, no. 5 (May 2014): E908—19.
41. Gí¶gebakan, í–zlem, Martin A. Osterhoff, Rita Schí¼ler, Olga Pivovarova, Michael Kruse, Anne-Cathrin Seltmann, Alexander S. Mosig, Natalia Rudovich, Michael Nauck, and Andreas F. H. Pfeiffer. ”GIP Increases Adipose Tissue Expression and Blood Levels of MCP-1 in Humans and Links High Energy Diets to Inflammation: A Randomised Trial.” Diabetologia 58, no. 8 (August 2015): 1759—68.
42. Mohammad, S., R. T. Patel, J. Bruno, M. S. Panhwar, J. Wen, and T. E. McGraw. ”A Naturally Occurring GIP Receptor Variant Undergoes Enhanced Agonist-Induced Desensitization, Which Impairs GIP Control of
Adipose Insulin Sensitivity.” Molecular and Cellular Biology 34, no. 19 (2014): 3618—29.
43. Nie, Y., R. C. Ma, J. C. N. Chan, H. Xu, and G. Xu. ”Glucose-Dependent Insulinotropic Peptide Impairs Insulin Signaling via Inducing Adipocyte Inflammation in Glucose-Dependent Insulinotropic Peptide
Receptor-Overexpressing Adipocytes.” The FASEB Journal 26, no. 6 (2012): 2383—93.
44. Timper, K., J. Grisouard, N. S. Sauter, T. Herzog-Radimerski, K. Dembinski, R. Peterli, D. M. Frey, et al. ”Glucose-Dependent Insulinotropic Polypeptide Induces Cytokine Expression, Lipolysis, and Insulin
Resistance in Human Adipocytes.” AJP: Endocrinology and Metabolism 304, no. 1 (2012): E1—13.
45. Miyawaki, Kazumasa, Yuichiro Yamada, Nobuhiro Ban, Yu Ihara, Katsushi Tsukiyama, Heying Zhou, Shimpei Fujimoto, et al. ”Inhibition of Gastric Inhibitory Polypeptide Signaling Prevents Obesity.” Nature
Medicine 8, no. 7 (2002): 738—42.
46. Boylan, Michael O., Patricia A. Glazebrook, Milos Tatalovic, and M. Michael Wolfe. ”Gastric Inhibitory Polypeptide Immunoneutralization Attenuates Development of Obesity in Mice.” American Journal of
Physiology – Endocrinology And Metabolism 309, no. 12 (2015): E1008—18.
47. Nasteska, D., N. Harada, K. Suzuki, S. Yamane, A. Hamasaki, E. Joo, K. Iwasaki, K. Shibue, T. Harada, and N. Inagaki. ”Chronic Reduction of GIP Secretion Alleviates Obesity and Insulin Resistance Under High-Fat
Diet Conditions.” Diabetes 63, no. 7 (2014): 2332—43.
48. Althage, M. C., E. L. Ford, S. Wang, P. Tso, K. S. Polonsky, and B. M. Wice. ”Targeted Ablation of Glucose-Dependent Insulinotropic Polypeptide-Producing Cells in Transgenic Mice Reduces Obesity and
Insulin Resistance Induced by a High Fat Diet.” Journal of Biological Chemistry 283, no. 26 (2008): 18365—76.
49. Calanna, S., F. Urbano, S. Piro, R. M. Zagami, A. Di Pino, L. Spadaro, F. Purrello, and A. M. Rabuazzo. ”Elevated Plasma Glucose-Dependent Insulinotropic Polypeptide Associates with Hyperinsulinemia in
Metabolic Syndrome.” European Journal of Endocrinology 166, no. 5 (2012): 917—22.
50. Chia, Chee W., Juliana O. Odetunde, Wook Kim, Olga D. Carlson, Luigi Ferrucci, and Josephine M. Egan. ”GIP Contributes to Islet Trihormonal Abnormalities in Type 2 Diabetes.” The Journal of Clinical Endocrinology & Metabolism 99, no. 7 (July 2014): 2477—85.
51. Chen, Shu, Fumiaki Okahara, Noriko Osaki, and Akira Shimotoyodome. ”Increased GIP Signaling Induces Adipose Inflammation via a HIF-1α-Dependent Pathway and Impairs Insulin Sensitivity in Mice.” American
Journal of Physiology-Endocrinology and Metabolism 308, no. 5 (December 23, 2014): E414—25.
52. Cavin, Jean-Baptiste, André Bado, and Maude Le Gall. ”Intestinal Adaptations after Bariatric Surgery: Consequences on Glucose Homeostasis.” Trends in Endocrinology & Metabolism 28, no. 5 (May 2017):
354—64.
53. Xiong, Shao-Wei, Jing Cao, Xian-Ming Liu, Xing-Ming Deng, Zeng Liu, and Fang-Ting Zhang. ”Effect of Modified Roux-En-Y Gastric Bypass Surgery on GLP-1, GIP in Patients with Type 2 Diabetes Mellitus.”
Gastroenterology Research and Practice 2015 (2015): 1—4.
54. Falkén, Y., P. M. Hellstrí¶m, J. J. Holst, and E. Ní¤slund. ”Changes in Glucose Homeostasis after Roux-En-Y Gastric Bypass Surgery for Obesity at Day Three, Two Months, and One Year after Surgery: Role of Gut
Peptides.” The Journal of Clinical Endocrinology & Metabolism 96, no. 7 (July 1, 2011): 2227—35.
55. Salinari, S., A. Bertuzzi, S. Asnaghi, C. Guidone, M. Manco, and G. Mingrone. ”First-Phase Insulin Secretion Restoration and Differential Response to Glucose Load Depending on the Route of Administration
in Type 2 Diabetic Subjects After Bariatric Surgery.” Diabetes Care 32, no. 3 (March 1, 2009): 375—80.
56. Jirapinyo, Pichamol, Andrea V. Haas, and Christopher C. Thompson. ”Effect of the Duodenal-Jejunal Bypass Liner on Glycemic Control in Patients With Type 2 Diabetes With Obesity: A Meta-Analysis With
Secondary Analysis on Weight Loss and Hormonal Changes.” Diabetes Care 41, no. 5 (May 1, 2018):1106—15.
57. Narita, T., H. Yokoyama, R. Yamashita, T. Sato, M. Hosoba, T. Morii, H. Fujita, K. Tsukiyama, and Y. Yamada. ”Comparisons of the Effects of 12-Week Administration of Miglitol and Voglibose on the Responses of Plasma Incretins after a Mixed Meal in Japanese Type 2 Diabetic Patients.” Diabetes, Obesity and Metabolism 14, no. 3 (2012): 283—87.
58. Dobbins, Robert L., Frank L. Greenway, Lihong Chen, Yaping Liu, Sharon L. Breed, Susan M. Andrews, Jeffrey A. Wald, Ann Walker, and Chari D. Smith. ”Selective Sodium-Dependent Glucose Transporter 1
Inhibitors Block Glucose Absorption and Impair Glucose-Dependent Insulinotropic Peptide Release.” American Journal of Physiology-Gastrointestinal and Liver Physiology 308, no. 11 (2015): G946—54.
59. Zheng, Sean L., Alistair J. Roddick, Rochan Aghar-Jaffar, Matthew J. Shun-Shin, Darrel Francis, Nick Oliver, and Karim Meeran. ”Association Between Use of Sodium-Glucose Cotransporter 2 Inhibitors,
Glucagon-like Peptide 1 Agonists, and Dipeptidyl Peptidase 4 Inhibitors With All-Cause Mortality in Patients With Type 2 Diabetes.” JAMA 319, no. 15 (2018): 1580.
60. Lin, Po-Ju, and Katarina T. Borer. ”Third Exposure to a Reduced Carbohydrate Meal Lowers Evening Postprandial Insulin and GIP Responses and HOMA-IR Estimate of Insulin Resistance.” PLOS ONE 11, no.
10 (2016): e0165378.
Copyright ©2018 The LCHF-Dietitian (a division of BetterByDesign Nutrition Ltd.)
LEGAL NOTICE: The contents of this blog, including text, images and cited statistics as well as all other material contained here (the ”content”) are for information purposes only. The content is not intended to be a substitute for professional advice, medical diagnosis and/or treatment and is not suitable for self-administration without the knowledge of your physician and regular monitoring by your physician. Do not disregard medical advice and always consult your physician with any questions you may have regarding a medical condition or before implementing anything you have read or heard in our content.