
The introduction to this article (Part 1: What is Insulin Resistance) explains what insulin resistance is, the conventional treatment for it and the drawbacks to that treatment: https://www.lchf-rd.com/2017/07/26/what-is-insulin-resistance/
INTRO: There are a number of tools available for measuring insulin resistance, most of which are more suited to a research setting, including the Quantitative Insulin Sensitivity Check Index (QUICKI) and the Matsuda Index. Others, such as the McAuley -, Belfiore -, Cederholm -, Avignon – and Stumvoll Index are better suited for epidemiological (population) research studies and are often compared to the ”gold standard” for the measurement of insulin sensitivity, the Hyperinsulinemic Euglycemic Clamp (HEC).
The homeostasis model assessment (HOMA-IR) method is suitable for individuals to use with their doctors or Dietitians to assess insulin resistance, and is useful for using over time to measure the impact of dietary and lifestyle changes in lowering insulin resistance.
Visualizing Insulin Resistance
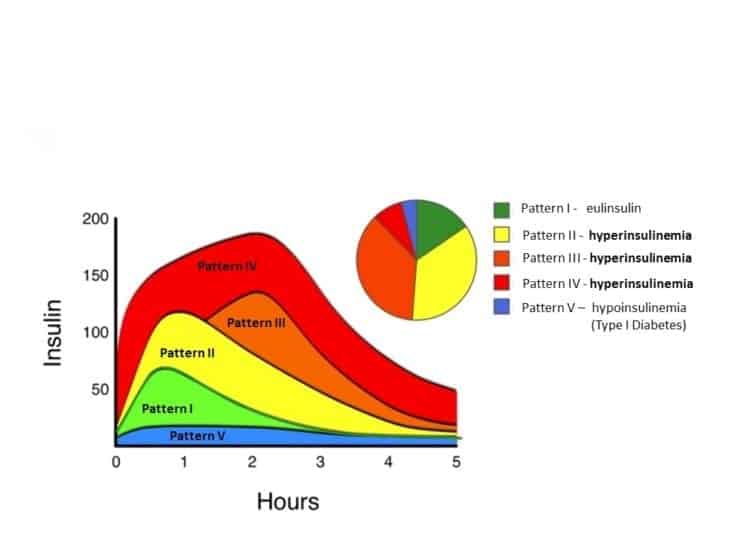
Insulin resistance can be determined by measuring insulin response to a standard glucose load over a 5 hour period and plotting the Insulin Response curves – which is precisely what Dr. Joseph R. Kraft MD, who was Chairman of the Department of Clinical Pathology and Nuclear Medicine, St. Joseph Hospital, Chicago, until his retirement.
Dr. Kraft spent more than a quarter century devoted to the study of glucose metabolism and blood insulin levels – collecting data in almost 15,000 people, aged 3 to 90 years old. Between 1972 and 1998, Dr. Kraft measured the Insulin Response and data from 10,829 of these subjects indicated that 75% of subjects were insulin resistant.
Compiling this data, five distinct Insulin Response Patterns emerged.
Pattern I
The light green curve below, is what a normal insulin response should look like. Insulin levels should rise steadily in the first 45 minutes (in response to the standard glucose load) to no higher than ~60 mIU/L (430.5 pmol/L) and then decrease steadily until baseline by 3 hours.
PATTERN II
People who are in the early stages of insulin resistance (Pattern II, represented by the yellow curve) release considerably more insulin in response to the exact same glucose load. Insulin levels rise to ~ 115 mIU/L (825 pmol/L) in the first hour and then take considerably longer (5 hrs) to drop back down to baseline, than the normal response.
PATTERN III
People who have progressed in insulin resistance to Pattern III have insulin levels that keep rising for the first 2 hours and then drop off more sharply, back down to baseline.
PATTERN IV
Those with Type 2 Diabetes / very high insulin resistance (Pattern IV) release huge amounts of insulin almost immediately, reaching levels of ~ 150 mIU/L (1076 pmol/L) at 1 hour. Then for the next 2 hours, insulin continues to climb, before it begins to decline to baseline. Even at 5 hours, insulin levels never decrease to normal values.
PATTERN V
Is what is seen in Type I Diabetes (T1D), when there is insufficient insulin production.
Please see Significance of Insulin Resistance for more details on Dr. Kraft’s findings: https://www.lchf-rd.com/2017/03/22/featured-significance-of-insulin-resistance/
While a 5 hour glucose tolerance test is not available at most labs, a 2 hour glucose tolerance test (2hrGTT) will indicate whether or not a person is insulin resistant or Type 2 Diabetic.
However, once a person is already diagnosed as Type 2 Diabetic, most medical plans will not cover the cost of having the test re-performed in order to determine if insulin response has changed in response to diet and lifestyle changes.
This is where the the homeostasis model assessment of insulin resistance (HOMA-IR) comes in – a tool easily used by clinicians and relying on standard blood tests.
Homeostasis model assessment of insulin resistance (HOMA1-IR) – Matthew’s Equations (1985)
The homeostasis model assessment was first developed in 1985 by David Matthews et al and is method used which quantifies insulin resistance and β-cell function of the pancreas from fasting blood glucose and either fasting insulin or C-peptide concentrations.
Pancreatic β-cells are responsible for insulin secretion in response to increasing glucose concentrations, so when there is decreased function of the pancreas’ β-cells, there will be a reduced response of β-cell to glucose-stimulated insulin secretion.
In addition, glucose concentrations are regulated by insulin-mediated glucose production in the liver, so insulin resistance is reflected by reduced suppression of hepatic glucose production, stemming from the effect of insulin.
The HOMA-IR model describes this glucose-insulin homeostasis using a simple equation, based on fasting blood glucose and fasting insulin. The equation uses the product of fasting plasma insulin (FPI) x fasting plasma glucose (FPI), divided by a constant of 22.5, providing an index of hepatic insulin resistance:
HOMA1-IR = FPI (mu/I) x FBG (mmol/L) / 22.5
The “Blood Code” book is based on these 1985 equations. The problem with the Matthew’s Equations is that they underestimate Insulin Sensitivity (%S) and overestimate % β-cell function.
Homeostasis model assessment of insulin resistance (HOMA2-IR)
Oxford University, Centre for Diabetes, Endocrinology and Metabolism in the UK, has designed a HOMA2-IR model (2013) that estimates β-cell function (%B) and insulin sensitivity (%S) for an individual from simultaneously measured fasting plasma glucose (FPG) and fasting plasma insulin (FPI) values. It also can be used with fasting specific insulin or C-peptide values, instead of fasting RIA insulin.
The HOMA2-IR calculator provides % β-cell function (% B ) and % Insulin Sensitivity (%S): https://www.dtu.ox.ac.uk/homacalculator/download.php.
It is important to note that HOMA-IR values vary by ethnic group, but looking at humans as one, a normal HOMA-IR value for a healthy person ranges from 0.5-1.4
- Less than 1.0 means you are insulin-sensitive which is optimal.
- Above 1.9 indicates early insulin resistance.
- Above 2.9 indicates significant insulin resistance.
Use of Tools
While these tools are primarily used by clinicians, knowing about them is useful in being proactive in managing one’s own health. For example, if you have already started making the dietary and lifestyle changes to lower insulin resistance, having your fasting insulin measured along with your fasting blood glucose, will enable your doctor or myself to calculate your progress, as well as recommend adjustments in your plan.
Have questions?
Why not send me a note using the “Contact Us” form at the top of this web page.
To our good health!
Joy
you can follow me at:
![]() https://www.facebook.com/lchfRD/
https://www.facebook.com/lchfRD/
References
Gutch, M, Kumar, S, Razi, SM, et al, Assessment of Insulin Sensitivity / Resistance, Indian J Endocrinol Metab. 2015 Jan-Feb; 19(1): 160—164.
HOMA Calculator©, University of Oxford, Diabetes Trials Unit, Oxford Centre for Diabetes, Endocrinology and Metabolism: https://www.dtu.ox.ac.uk/homacalculator/download.php
![]() https://twitter.com/joykiddieRD
https://twitter.com/joykiddieRD
![]() https://www.facebook.com/lchfRD/
https://www.facebook.com/lchfRD/
Note: Everyone's results following a LCHF lifestyle will differ as there is no one-size-fits-all approach and everybody's nutritional needs and health status is different. If you want to adopt this kind of lifestyle, please discuss it with your doctor, first.
Copyright ©2017 The LCHF-Dietitian (a division of BetterByDesign Nutrition Ltd.)
LEGAL NOTICE: The contents of this blog, including text, images and cited statistics as well as all other material contained here (the ”content”) are for information purposes only. The content is not intended to be a substitute for professional advice, medical diagnosis and/or treatment and is not suitable for self-administration without the knowledge of your physician and regular monitoring by your physician. Do not disregard medical advice and always consult your physician with any questions you may have regarding a medical condition or before implementing anything you have read or heard in our content.