Food as Medicine; dramatically lower blood sugar – a Dietitian’s Journey

I am not one for popular remedies for health issues.  I don’t believe in “cleanses” and I don’t “eat clean” – or do I? If not eating any dairy is “clean” then I eat “dirty” because I use cream in my coffee, but if not eating gluten or grains is “clean”, then my eating is pristine.

The problem with popular beliefs around food and eating and word-of-mouth remedies is there is no standardized means to define them or evaluate their effectiveness.

Folk Remedies

Folk remedies, on the other hand, are in a different category. These practices, on which many nutraceuticals and even pharmaceuticals are based have GRAS standing (“Generally Recognized As Safe”) and have been used by cultures around the world for hundreds, if not thousands of years.

Here’s are two examples of folk-remedies in this category;

Swallow’s Nest

The Chinese have made soup out of the nest of a particular swallow which builds its home on high cliffs. This “bird’s nest soup” is highly prized and very expensive to make, but considered to have restorative properties for those with breathing difficulties.  As it turns out, this particular swallow’s nest is high in theophilline, a compound that has come to be used in Western medicine as therapy for respiratory diseases such as chronic obstructive pulmonary disease (COPD) and asthma. Bird’s nest from this swallow has a GRAS standing and can legally be purchased in traditional Chinese medicine stores. One can take medication or food containing the same active substance, and in both cases one’s symptoms improve.

Bitter Melon

Bitter melon or bitter gourdkarela is widely grown in Asia, Africa and the Caribbean – both for food (prized for its bitter taste) and for its medicinal properties. In both Ayurveda, the traditional medicine (Hindu) of India and in Traditional Chinese Medicine (TCM) different parts of the bitter melon plant are brewed as a beverage and taken as a treatment for Diabetes. As it turns out, bitter melon, which has GRAS standing, contains polypeptide-p which is an insulin analogue.

Apple Cider Vinegar

I’ve been hearing about the use of apple cider vinegar (ACV) since I first started reading about low carb high fat diets in early 2015, from Dr. Jason Fung, a nephrologist (kidney specialist) from Toronto. He recommended that 1 Tbsp. of unpasteurized ACV be taken in a glass of water prior to meals and that it be add it to broths, soups and marinades. He’d said that it inactivates the production of digestive enzymes and slows down the rate of digestion, stabilizing blood sugar levels. Since the recommendation to use ACV at the time did not come with any scientific evidence, I summarily dismissed the idea of using it.

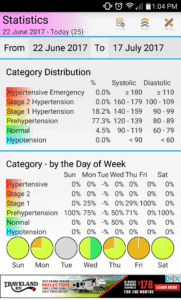
Persistently High Fasting Blood Glucose

For those who have been following my own progress following a Low Carb High Fat style of eating over the past 6 months (posted on the tab “A Dietitian’s Journey”) you know that despite losing weight, significantly lowering both my triglycerides and LDL cholesterol and my overall blood sugar levels coming down significantly, I had two ongoing problems;

(1) my morning fasting blood glucose (FBG) remained high, and

(2) my blood glucose would only drop into the 5-point-something mmol/ L range (~94 mg/dl) or to the 4-point-something mmol/ L range (76 mg/dl) range after an entire day of intermittent fasting.

Since there are physiological risks associated with high blood glucose, I was very motivated to find out why they were high in the morning and to do something about them.

I decided to keep detailed food records for 3 weeks to see if there was a patter, and ruled out diet. 

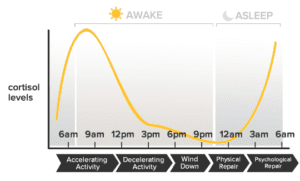
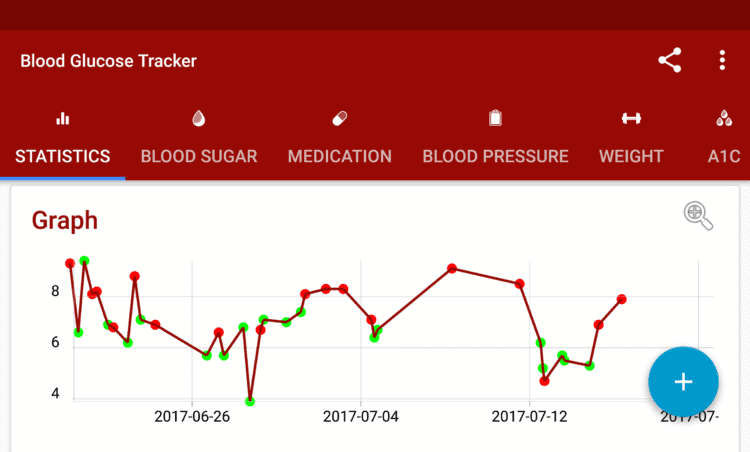
Then, I decided to take my blood sugar several times each night, from midnight until 8 am, over several days, to see when it rose. As it turned out, it would drop nicely after supper (as it would after eating at any other time of the day), to 7-point-something mmol/l (~130 mg/dl) after an hour or so, and then to 6-point-something mmol/L (121 mg/dl) around midnight, and then it would gradually begin to rise from ~2 am, reaching its highest point around 8 am, following the circadian rhythm of cortisol.

Since it seemed that my high morning blood sugar was due to cortisol rising after went to bed until 8 am, and since cortisol can be affected by many things including stress, I took up going for a walk after supper. It did help!  My morning blood sugars were in the mid-6-point-something mmol/L (~117 mg/dl), which was a far-cry from the 8.0 mmol/L (144 mg/dl) level it had been!

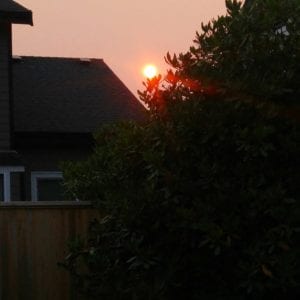
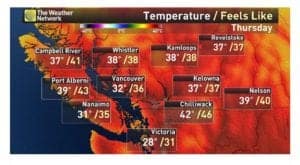
The evening walks, however, were short lived due to a shift in the winds and the raging forest fires in and around the Lower Mainland which caused the skies to fill with Fine Particulate Matter, know as PM2.5 (as the are 2.5 micrometers or less, in size).  Since these can enter the lungs and the blood stream resulting in ill-effects, my walks stopped. In fact, if I did have to go out, it was with a vented N-95 mask. The smoke briefly cleared being replaced by stifling heat in the mid- to high-30 Celsius (100 F) for 10 days, followed by more smoke, so I began to look for something- anything that might lower my morning blood sugars, which at this point were hovering in the 7.6 mmol/L mmol/L (137 mg/dl) range!

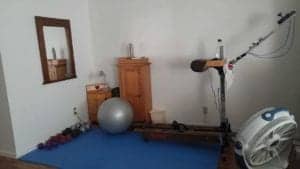
At first I tried doing a short workout on my Nordic-track or using my “step” before bed, but it didn’t do much for my blood sugars and made me far too awake to fall asleep.

Having some unpasteurized, unfiltered ACV in the house, I decided to try it.  It tasted terrible!! I tried adding it to water and it was still awful! I couldn’t bring myself to drink it!!

From Masking the Taste to Food as Medicine

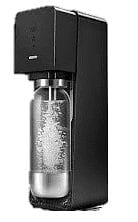
A few years ago, in an effort to drink more water each day, I began drinking Club Soda / Selzer and then purchased a Sodastream machine, to carbonate my own (filtered) water.

I usually drink it plain, but have been known to put a twist of fresh lemon or lime in it.


ACV Ginger-aid

I tried adding 1 Tbsp of unpasteurized ACV to 1 litre (quart) of carbonated water but I still couldn’t drink it! All I tasted was sour!

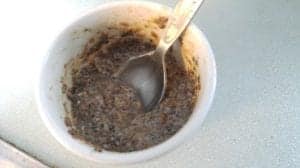
Needing to mask the taste, I decided to grate a bit of fresh ginger root into it and “ACV Gingeraid” was born!


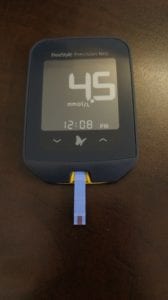
The first time, I drank a litre (~ quart) of “ACV Gingeraid” mid-morning, and my blood sugar dropped from 7.3 mmol/L  (132 mg/dl) to 6.6 mmol/L (119 mg/dl) in an hour. I thought to myself that maybe it would have dropped the same amount if I had done nothing.

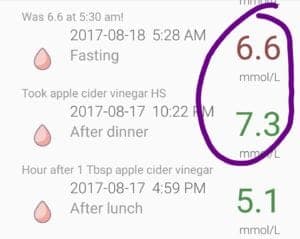
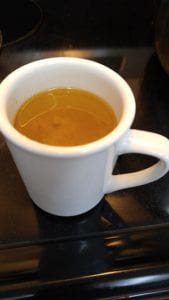
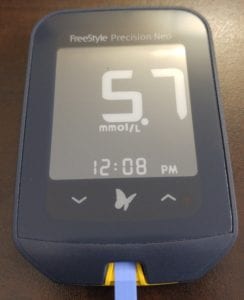
I hadn’t had anything to eat or drink (except a coffee with only cream in the morning) but presumably under the effect of cortisol and my body’s own making of glucose from fat stores, my blood sugar continued to rise from 6.6 mmol/L (119 mg/dl) at 5:30 AM, to 7.7 mmol/L (139 mg/dl) just before 10 AM.

That was just too high – and I hadn’t eaten! 

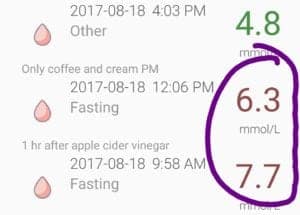
So, I made and drank a second bottle of ACV Ginger-aid and in 1.5 hrs, my blood sugar had dropped to 6.3 mmol/L (114 mg/dl). Then by 4:00 PM, and drinking no additional ACV Ginger-aid, it was 4.8 mmol/L (86 mg/dl).

I would previously only get to those kinds of numbers just before dinner, when I was on an intermittent fast day.  This was 2-2.5 hours earlier.

That couldn’t be, I thought…

Several days in a row, the same thing would happen, with only slightly different numbers, some of them lower.

My blood sugar would be around 7.3 mmol/L (137 mg/dl) 2 hours after dinner and I would drink most of a bottle of ACV Ginger-aid before bed, and in the morning my FBG would be in the 6’s mmol/L (~119 mg/dl). Could it be because of the drink?

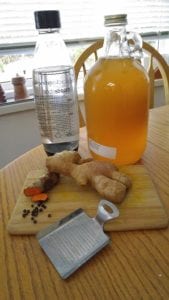
One day, quite by chance, I had some fresh turmeric root in the house (because I use it in cooking and because I like the taste). As well, is a potent antioxidant and the curcumin (the active compound in turmeric) has been demonstrated to have anti-carcinogenic properties).

I decided to add a little bit of grated turmeric root because I thought the turmeric would taste good with the ginger (it did!).

I also added a bit of freshly ground black pepper to the Turmeric-ACV Ginger-aid, because I had read that black pepper makes the curcumin in the fresh turmeric root 2000 times more bio-available.

Turmeric ACV Ginger-aid

The drink tasted delicious!

But what happened to my blood sugars was quite surprising.

It became evident that for me, using “food as medicine” has had some very impressive results!


Just 3 days earlier, I was impressed because by 4:00 PM my blood glucose was 4.8 mmol/L (86 mg/dl) – which was a good 2.5 hours earlier than usual.

Since adding the turmeric to the ACV Ginger-aid, I was getting numbers in the mid-4 mmol/L (i.e. 4.6 mmol/L / 84 mg/dl) by 2:30 in the afternoon!

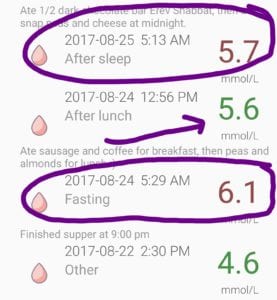
By drinking the Turmeric-ACV Ginger-aid  before bed, my morning FBG is consistently in the low 6’s mmol/L (~110 mg/dl) and on a few occasions, ”ve been getting numbers in the high-5s mmol/L (103 mg/dl). I was considering Metformin to get these kinds of results!

This is by consuming ordinary food found in my kitchen!

I continue to eat LCHF and I usually intermittent fast breakfast, as I’ve never been much of a “breakfast person”. I occasionally don’t eat until mid-day as that is when I usually first feel hungry.

My blood sugars are the best they’ve been since I started measuring them.

Now, 2 hours after meals my blood sugar is usually in the low 6’s mmol/l (~110 mg/dl) and the ONLY change has been adding this beverage before bed and occasionally one plain ACV Ginger-aid through the day.

Just to be a ‘good scientist’, last night I deliberately ate 1/2 a dark chocolate bar (72% cocoa) and drank 3/4 of a bottle of plain AVC Ginger-aid (no turmeric) and tested my blood glucose this morning. It was 6.6 mmol/L (119 mg/dl).  That’s crazy! I was expecting 10 or 11 mmol/L.  That’s what it used to be just a few weeks ago, when I’d eat a little bit of dark chocolate!

NOTE:  I wanted to see what would happen if I ate the same way but discontinued the beverage. My blood sugar went up to 8.8 mmol/L the first morning after not having any the previous day and was 8.6 mmol/L the following morning. The third day, I drank only one bottle in the afternoon and on at night before bed and the following morning, my fbg was 7.2 mmol/L (still way too high, but much lower). I anticipate it will continue to drop as I have 2-3 bottles of the mixture per day.

Even thought I am NOT exercising (first because of the smokey conditions outside and because I fell back into old “bad-habits” of getting up early and working at my desk with my coffee), my blood glucose is what I would have anticipated would have occurred if I had taken Metformin.

Keep in mind, I am “a sample-set of one”. There’s no saying that others will have the same, or even similar results. In addition, I do NOT encourage people to make any changes in the amount of medication that a doctor prescribed without being told by that doctor.  This drink is NOT a substitute for medication that has been prescribed!  That being said, for those who are not taking medication but have persistently high blood sugar readings does it not make good sense to consider trying such food as medicine?

NOTE: I decided to find out if there was any scientific evidence for the anti-glycemic properties of ACV and did find a 2015 study, suggesting that it increases insulin-stimulated glucose uptake in those with Type 2 Diabetes (T2D), which I have. I then decided to look and see if ginger had anti-glycemic properties and found a 2015 study that reported that ginger significantly reduced FBG as well as HbA1c, along with Apo B, Apo B/Apo A-I, MDA and increased the level of Apo A-I in T2D patients. Naturally, I looked to see if turmeric was known to have anti-glycemic properties and sure enough, it did!  I found a 2013 publication that indicated it is well-known that turmeric has a stimulatory action on pancreatic β-cells, and that this may be the mechanism by which it lowers blood sugar in those with T2D. Whether these substances used together have a far greater effect on blood sugar than any of them used separately would certainly make for an interesting study!

WARNING: Given the possibility of these ordinary foods resulting in a dramatic drop in blood sugar, if you have Type 2 Diabetes or pre-diabetes, first discuss incorporating these foods into your diet with your doctor. As well, be sure to monitor your high blood sugar often if you drink these.

ACV Gingeraid Recipe

Click on the link under “Recipes” for ACV Gingeraid with Variations – food as medicine. Enjoy!


you can follow me at:

 https://twitter.com/lchfRD

  https://www.facebook.com/lchfRD/

References

Mitrou P, Petsiou E, Papakonstantinou E, et al. Vinegar Consumption Increases Insulin-Stimulated Glucose Uptake by the Forearm Muscle in Humans with Type 2 Diabetes. Journal of Diabetes Research. 2015;2015:175204. doi:10.1155/2015/175204.

Khandouzi N, Shidfar F, Rajab A, Rahideh T, Hosseini P, Mir Taheri M. The Effects of Ginger on Fasting Blood Sugar, Hemoglobin A1c, Apolipoprotein B, Apolipoprotein A-I and Malondialdehyde in Type 2 Diabetic Patients. Iranian Journal of Pharmaceutical Research”¯: IJPR. 2015;14(1):131-140.

Zhang D, Fu M, Gao S-H, Liu J-L. Curcumin and Diabetes: A Systematic Review. Evidence-based Complementary and Alternative Medicine”¯: eCAM. 2013;2013:636053. doi:10.1155/2013/636053.

 https://twitter.com/joykiddieRD

  https://www.facebook.com/lchfRD/

Note: Everyone's results following a LCHF lifestyle will differ as there is no one-size-fits-all approach and everybody's nutritional needs and health status is different. If you want to adopt this kind of lifestyle, please discuss it with your doctor, first.

Copyright ©2017 The LCHF-Dietitian (a division of BetterByDesign Nutrition Ltd.) 

LEGAL NOTICE: The contents of this blog, including text, images and cited statistics as well as all other material contained here (the ”content”) are for information purposes only.  The content is not intended to be a substitute for professional advice, medical diagnosis and/or treatment and is not suitable for self-administration without the knowledge of your physician and regular monitoring by your physician. Do not disregard medical advice and always consult your physician with any questions you may have regarding a medical condition or before implementing anything  you have read or heard in our content.

Surprising ways to get adequate fiber eating LCHF

When people think of getting enough “fiber” they often imagine foods like “bran” and prunes – foods not usually eaten when one is following a LCHF style of eating. But what is fiber and how do we get enough when we don’t generally eat grains or legumes?

Fiber – soluble and insoluble

There are two kinds of fiber, insoluble and soluble.

Insoluble fiber is what most people think about when they think of “roughage” needed to form stool and prevent constipation. It helps form the bulk of the stool. Insoluble fiber is naturally present in the outside of grains, such as whole grain wheat, un-milled brown rice and the outside of oats. It is also found in fruit, legumes (or pulses) such as dried beans, lentils, or peas, some vegetables and in nuts and seeds.

Soluble fiber forms a ‘gel’ in the intestine and binds with fatty acids. It slows stomach emptying and helps to make people feel fuller for longer, as well as slow the rate that blood sugar rises, after eating. Soluble fiber absorbs water in the gut, and helps to form a pliable stool. Soluble fiber is found on the inside of certain grains, such as oats, chia seeds or psyillium, as well as the inside of certain kinds of fruit such as apple and pear.

Dietary Recommendations for dietary fiber intake varies with age and gender. Men under the age of 50 years are recommended to take in 38 gm / day of dietary fiber, and men over 50 years to take in 30 gm / day. Women under 50 years old are recommended to take in 25 gm of fiber per day and over 50 years, 21 gm per day.

[Reference: Government of Canada, nutrients in food, https://www.canada.ca/en/health-canada/services/nutrients/fibre.html]

Both kinds of fiber are needed and most Canadians eating a conventional diet are getting half of what is recommended.

For those eating a Low Carb High Fat Diet, even though grains and legumes are generally not eaten, getting enough fiber is not that difficult.

Avocado – Surprisingly, avocado which is an excellent source of vegetable fat, is also high in fiber, having more than 10 gm fiber per cup (250 ml). Avocado grown in Florida which are the bright green, smooth-skinned variety have more insoluble fiber than California avocado, which are the smaller, darker green, dimpled variety.

Berries – Berries such as blackberries and raspberries are fruit that I encourage people to use sprinkled on salads, as they are an excellent source of antioxidants, but also have 8 gm fiber per cup (250 ml).

Coconut – Fresh coconut meat has 6 gm of net carbs per 100 grams of coconut, but also packs a whopping 9 gms of fiber and is a very rich source of fat (33 gms per 100 gm coconut). It can be purchased peeled, grated and sold frozen in many ethnic stores or in the ethnic section of regular grocery stores.

Artichoke – Artichoke is a low-carbohydrate vegetable that is delicious boiled and it’s leaves dipped in seasoned butter. Surprisingly, one medium artichoke has over 10 gm of fiber.

Okra – Okra, or ‘lady fingers’ is a staple vegetable in the South Asian diet and is commonly eaten in the Southern US. Just one cup of okra contains more than 8 gm of fiber.

Brussels Sprouts – These low-carb cruciferous vegetables are not just for Thanksgiving and Christmas dinner.  Split and grilled on the BBQ with garlic, they are a sweet, nutty addition to any meal, packing almost 8 gm of fiber per cup.

Turnip – Turnip, the small white vegetable with a hint of purple is not to be confused with the pale beige, larger rutabaga. Turnip contains almost 10 gm of fiber per cup. It is delicious pickled with a single beet, and eaten with Middle Eastern foods.

Constipation

Even though passing stool is as natural a part of the process as eating is, most feel awkward discussing it. Many don’t know what “normal” is in that regard, or even if there is such a thing. Is once every few days okay, is it detrimental if it is only once a week?  Should it be every day and if so, is more than once a day too much? Does texture matter or is it only frequency?

Frequency and Texture

Many physicians consider normal bowel movement (BM) frequency from 3/day to every 3 days whereas I tend to lean towards daily to every two days as preferable. Even if BM frequency is in this range, hard, painful to pass stools are problematic and would be categorized as constipation.

Since the mid-1990s there is a standardized method to classify the texture of stools, called the Bristol Stool Chart based on research which indicated that stool is a useful surrogate measure of how long feces (stool) takes to go through the large intestine (called “colon transit time”).

Bristol Stool Chart

While Type 3-7 are considered valid for diagnosing diarrhea, Type 1 and Type 2 stool can have normal “transit time”, but be compact and hard due to lack of fluid / water.

The fact is, many, if not most people either have a lack of fiber or a lack of sufficient fluid or both and are constipated to a greater or lesser degree. They eat every day, but they don’t pass stool often and when they do, it is hard and compact. Their bodily waste sits in their colon for several days before finally being eliminated – and when it is, it is hard, dry and compact and often painful to pass.

Constipation is usually due to two factors;

(1) not taking in foods with enough fiber and

(2) not drinking enough water

Sometimes, despite eating the foods mentioned above, people find it isn’t sufficient. This is where what I have dubbed “birdseed” comes in.  Of course, I don’t mean actual birdseed!

What I call “birdseed” is a mixture of 1 tbsp. freshly ground whole flax seed (3 gm fiber per tbsp.) to which 1 tbsp. of chia seed is added (5.5 gm fiber per tbsp.).


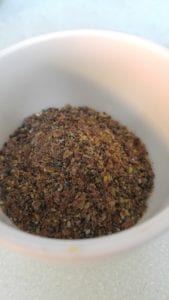
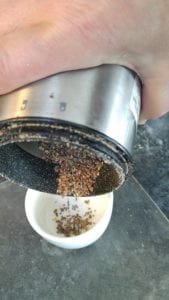
The chia seeds are ground a little bit with the previously ground flax seed, and then the two ground seeds are placed in a small bowl.

An added portion of psyllium husk (1 tbsp.) is optional.


Drinking “Birdseed”

To drink this mixture, diluted coconut milk can be added, the mixture briefly stirred and then drunk quickly, followed by a good amount of water (I recommend at least 2 cups (500 ml).


Eating “birdseed”

For even more fiber and a delicious taste, 2 tbsp. of tahini (ground sesame paste) can be added and the mixture eaten with a spoon.

Tahini has 0 net carbs, and almost 4 gm of fiber for 2 tbsp.


Note: people often ask if they can make “chia pudding” to which they add ground flax seed, but the idea here is to have the flax and chia seeds do their magic in the intestines, not in a container, beforehand.

Water – how much is sufficient?

Dehydration is another factor that contributes to constipation. Often people simply don’t drink enough water to form a bulky, pliable stool.

The Reference Daily Intake (RDI) for water for men over 18 years is 3.7 liters per day and for women over 18 years, 2.7 liters per day and this is from all water, including that contained in beverages.

Fiber and water together

Drinking one liter of water or club soda / seltzer with each batch of “birdseed” is a good idea, because the last thing we want is to have all this insoluble and soluble fiber this in our intestines, with insufficient water. In the worse case scenario, this can result in an intestinal blockage, so be sure to drink sufficient water when taking “birdseed”.

I usually recommend that people start off with having 1 tbsp of flax seed and 1 tbsp of chia seed once a day – increasing after a few days if needed to twice (or if needed, three times) a day – making sure to drink a liter of water immediately afterwards.

What about carbs in “birdseed”?

While flax seed, chia seed and psyllium are grains, they have very few net carbs.

1 tsp of whole flax seed (3.4 gm) is so high in fiber that it has no net carbs.

1 tsp of whole chia seed has only .3 gm of net carbs.

Even if you add 1 tsp of psyllium husk, that adds only 1 gram of carbs.

“Birdseed” can be drunk as described above, eaten with sesame paste (also very high in fiber and a good source of healthy fat), or sprinkled on salads or omelettes.

…and remember to drink a liter or so of water each time you take “birdseed”, so that passing stools daily, just like eating daily, will be the norm.

To your good health!

Joy


you can follow me at:

 https://twitter.com/lchfRD

  https://www.facebook.com/lchfRD/

Note: Everyone’s results following a LCHF lifestyle will differ as there is no one-size-fits-all approach and everybody’s nutritional needs and health status is different. If you want to adopt this kind of lifestyle, please discuss it with your doctor, first.

Copyright ©2017 The LCHF-Dietitian (a division of BetterByDesign Nutrition Ltd.) 

LEGAL NOTICE: The contents of this blog, including text, images and cited statistics as well as all other material contained here (the ”content”) are for information purposes only.  The content is not intended to be a substitute for professional advice, medical diagnosis and/or treatment and is not suitable for self-administration without the knowledge of your physician and regular monitoring by your physician. Do not disregard medical advice and always consult your physician with any questions you may have regarding a medical condition or before implementing anything  you have read or heard in our content.


A Dietitian’s Journey – the 25 week breakthrough

Finally!  Like anyone else who’s been working long and hard towards achieving their health goals, I’m so excited that I’ve finally made a significant ‘breakthrough’! I didn’t think it would take this long, but when I think that it has taken me close to 20 years to become this insulin resistant, it only makes sense that it is going to take some time to become insulin sensitive again!

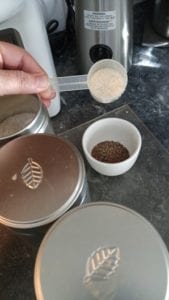
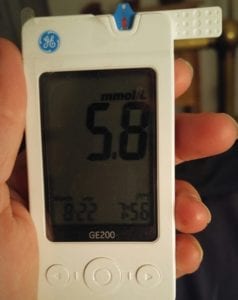
Last night, for the first time since I was diagnosed with Type 2 Diabetes (T2D) ten years ago, my 2 hour post-prandial blood glucose (i.e. two hours after a meal) was 5.8 mmol/L (105 mg/dl).

To put that in context for someone without Diabetes, blood glucose taken two hours after meals should be less than 7.8 mmol/L (140 mg/dl) – so my blood sugar after supper was not only in the non-Diabetic range, it was much better than that!

This means that the delaying the time between meals that I have been doing each weekday is starting to have its effect.

‘Hearing’ for the first time

When insulin was released after I ate dinner last night, my cells responded to insulin’s signal and took up the glucose from my blood, into my cells! This is what is supposed to happen, but from years and years of eating a diet that had far to many carbs (mostly as “healthy” fruit and milk), my cells had become non-responsive to insulin’s signal. The glucose (the blood sugar produced after food is digested) would stay at high levels in my blood because even though sufficient insulin was being produced and released by the βeta-cells of my pancreas, my cells had become insensitive to its signal. My cells had become insulin resistant – they were ‘deaf’ to insulin’s signal.

Last night, for the first time that I’ve observed, my cells responded to insulin properly!  Like a hearing-impaired person hearing for the first time, my cells could ‘hear’!

Still “hearing-impaired”

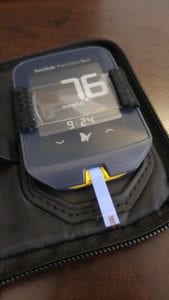
My cells aren’t yet ‘healed’. They and my liver are still insulin resistant which is evidenced by the fact that even though I haven’t eaten anything since dinner last night, my blood glucose is high.

As it is supposed to do in response to both a low-carb diet and intermittent fasting, my body is breaking down my fat stores for energy (lipolysis) and the free fatty acids that are released are being used to produce glucose for my blood (in a process called gluconeogenesis) and ketones for my other organs, including my brain.

My blood glucose should increase from the gluconeogenesis, but it shouldn’t stay high! 

In a perfect world, my blood glucose should be maintained around 4.0 mmol/L (72 mg/dl) when I am intermittent fasting, but it is much higher than that.  The VERY good news is, it is falling to these ideal levels earlier and earlier each day, as I continue to intermittently fast Monday to Friday.

Intermittent Fasting – the missing ‘key’

It used to be late in the afternoon before my blood glucose would finally fall to 3.9 – 4.2 mmol/L, but over the six days it has been falling to these levels earlier and earlier each day.

blood glucose readings July 25 – August 23, 2017


Last Thursday, while checking my blood glucose every 2 hours, it dropped to 3.2 mmol/L at 1:55 PM and I immediately ate some carb-containing food, but the next day, late in the afternoon it only reached 4.8 mmol/L at 4:00 PM, despite me delaying the time between meals, both days. As someone with Type 2 Diabetes, I have to monitor my blood sugars every few hours when I am delaying meals, to be sure my blood sugar is being maintained by my body breaking down fat.

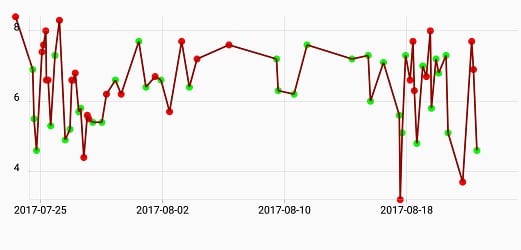
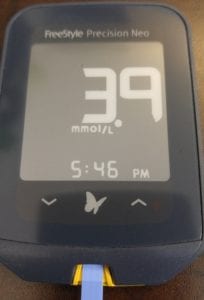
Monday, my blood glucose was 3.7 mmol/L (67 mg/dl) at 4:00 PM and yes, I ate something immediately.

Tuesday it was 4.6 mmol/L (83 mg/dl) at 2:30 PM

Today (Wednesday) it was 4.5 mmol/L (81 mg/dl) at noon!

Best of all was that last night, 2 hours after eating, my blood glucose was only 5.8 mmol/L (105 mg/dl) – not just ‘normal’, but well below the non-Diabetic cutoffs! This is what I have been waiting for!

Tracking Ketosis

Ketones (also called ‘ketone bodies’) are naturally occurring molecules (acetoacetate, βeta-hydroxybutyrate, and their spontaneous breakdown product, acetone) that are produced for energy while people are sleeping, or when they haven’t eaten for a while. Ketone production is natural and normal and occurs to everyone – otherwise we would need to get up at night to eat!

Ketones are picked up the body’s tissues and converted into something called ‘acetyl-CoA’ which then enters the citric acid cycle and is burned in the cell’s mitochondria (the ‘powerhouse’ of each cell) for energy. When we are sleeping, or are eating low-carb high health fat or simply not eating for a while, this is what our body uses as fuel instead of glucose. When eating low carb over an extended period of time, the body makes the little bit of glucose it needs for our brain and blood from fat and uses ketones for the rest.

A Ketostix® urine test strip (from several weeks ago)

Ketones can be easily  and inexpensively detected in urine using a test strip, such as Ketostix®.

When people are at a low level of ketosis, they produce both acetoacetate and βeta-hydroxybutyrate in approximately equal quantities. These ketones are used by the muscle cells for energy. Ketostix® only measures the amount of acetoacetate in the urine.

For those that choose to eat very low carb and remain in ketosis for a while, their body’s will take the acetoacetate and convert it to βeta-hydroxybutyrate. Since Ketostix® only measures acetoacetate, the strips may become lighter and lighter because there is less acetoacetate in then urine. This is when blood ketone strips becomes helpful.

Abbott Laboratories® produce a small serum monitoring system that can test either blood glucose levels or serum β-ketone levels, using different test strips. The glucose strips cost about the same as glucose test strips used with other glucometers, but the β-ketone test strips are quite costly, costing between $3-$5 each, depending on where they are purchased.  I don’t use them very often – only to make sure I don’t let my ketones get too high.

Note: I take a rather conservative approach to low carb eating and don't see any need to lower carbs to such a point as people are producing large amounts of ketones. I encourage insulin-resistant clients who are eating low carb to monitor both their blood sugar and ketone production often and to discuss their results with their doctors.

The β-ketone test strips measure the amount of βeta-hydroxybutyrate in the blood.

β-Ketone test strip, measures βeta-hydroxybutyrate in blood sample

This morning, about an hour after I measured my fasting blood glucose at 7.8 mmol/L, I measured my fasting β-ketones (which measures the amount of βeta-hyroxybuterate in my blood) at 1.6 mmol/L.

A low level of serum βeta-hyroxybuterate is considered 0.34 mmol/L and a mid-range level of serum βeta-hyroxybuterate  is considered 2.36 mmol/L, so I was in the low-mid range level, which is the highest level that I go. I am also monitoring my blood sugar every two hours to make sure that my blood sugar level is being maintained adequately.


Note: as they say on TV “don’t try this at home”.  Be sure to discuss following a low carb diet with your doctor first and also discuss whether there are any health reasons to avoid remaining in mild ketosis for any period of time.

At these levels, my body is happily breaking down my own fat stores for energy and the free fatty acids that are being released are being used to produce glucose for my blood (via gluconeogenesis). This is evident by my blood glucose being 7.8 mmol/L around 9:30 AM today.

This morning’s workout ‘selfie’

My body produces ketones (as evident by my βeta-hyroxybuterate being 1.6 mmol/L) an hour later and these ketones are being picked up my body’s tissues and are being converted into acetyl-CoA, which is being burned by my cells mitochondria for energy.  These ketones not only fuel my brain, so I can work, they also fuel my body so I can exercise.

Yes! I aim to do some kind of exercise for 30-45 minutes most days.

This is the BIG difference between “starving” and “fasting”. I’m fat-adapted and I have plenty of fat stores to burn, so my body is really quite happy burning my own fat stores for energy while maintaining my blood sugar using the carbs in my diet and the glucose synthesized from my fat.

‘Getting moving’ and occasionally ‘breaking a sweat’

When I speak of ‘exercise’, it’s not crazy intense, but it is my getting my body ‘moving’.

All my morning walks (with and without Nordic poles) – from the very first one 5 1/2 months ago, have been done fasting.

Yesterday I did 15 minutes of aerobic exercise and 30 minutes of lower body resistance training – not in a gym, but at home. I was fasting…and continued to fast until late in the afternoon. Remember, my body is breaking down my fat stores for energy and I have plenty of those!

all the “gym” I need!

I’m not a member of a gym.

I have a corner of one room set up with my Nordic Track ski-machine, a few free-weights (2#, 5#, 10# and for the future 20#), a floor mat, 3 levels of resistance bands, and a “step”.

If I use my Nordic Track, I listen to music while I work out, and have a water bottle with homemade club soda (seltzer) close at hand. I have a Sodastream® machine, so I always have a steady supply.

I am using the “step” or doing aerobics of some kind, I use some videos I found on You-Tube of a TV show I used to exercise to years ago. I always liked them because they gave lots of instructions so that only one muscle group at a time is being worked.  That way, only one part of my body needs to recover, and I can work other parts the following day.

If I am doing my free weights, I follow the routine I learned from a kinesiologist friend, when I took off the first part of the weight 5 years ago.

I keep it simple and simply make part of every day doing something that requires me to ‘get moving’ and 3 times a week I aim to make that activity something that ‘breaks a sweat’.

I don’t exercise to ‘lose weight’ – I’m active because it’s part of a healthy lifestyle.  It’s good for my heart, for reducing stress and to increase muscle tone – and it makes me feel terrific.

Sure, I still have a long way to go but a each week and each month passes, I am closer to my goal that I was the week or month before.  I am certainly closer than had I never started!

Here’s some more proof…

These three photos were taken on this date (August 23) in 2015, shortly after I had heard about low carb high fat eating from a retired physician-friend, last year in 2016 and today 2017. While there isn’t a huge difference weight-wise between last year and this year (14 pounds), the difference one can’t see is becoming evident.

Me – August 23 2015, 2016 and today 2017

Yes, the progress it is painfully slow and it would be easy to get discouraged except that I have read the studies and seen the results that other clinicians have obtained with their patients. It’s twenty-five weeks since I started – just about 1/2 a year, but my hard work and determination to ‘stick with it’ is paying off.  Last night, for the first time since I was diagnosed as having Type 2 Diabetes, my cells provided evidence that they are beginning to respond to the signals from insulin the way they are supposed to.

This afternoon, they did it all again!  

This was my blood glucose 3 hours after lunch (which I decided to eat today, because I felt hungry). As mentioned above, 4.5 mmol/L (81 mg/dl) is well below the ‘normal’, non-Diabetic post prandial glucose level of 7.8 mmol/L (140 mg/dl)

This was even better than after dinner, yesterday!

It took longer than I expect, but it’s happening!

So, one day at a time, one week at time, the weeks add up to months and the months to half a year and in half a year, I have measurable progress!

Oh, did I forget to mention that my weight is down again?  I am seeing “numbers” I haven’t seen since I gave birth to my children!

Slow, yes – but very sure.

Now let’s see what I’ll accomplish in the second half of this year!

Have questions?

Want to know how I can help you accomplish your health goals? Why not send me a note using the “Contact Us” form above.

To our good health!

Joy


you can follow me at:

 https://twitter.com/lchfRD

  https://www.facebook.com/lchfRD/

Note: I am a “sample-set of 1” – meaning that my results may or may not be like any others who follow a similar lifestyle. If you are considering eating “low carb” and are taking medication to control your blood sugar or blood pressure, please discuss it with your doctor, first.

Copyright ©2017 The LCHF-Dietitian (a division of BetterByDesign Nutrition Ltd.) 

LEGAL NOTICE: The contents of this blog, including text, images and cited statistics as well as all other material contained here (the ”content”) are for information purposes only.  The content is not intended to be a substitute for professional advice, medical diagnosis and/or treatment and is not suitable for self-administration without the knowledge of your physician and regular monitoring by your physician. Do not disregard medical advice and always consult your physician with any questions you may have regarding a medical condition or before implementing anything  you have read or heard in our content.

Caffeine Substantially Increases Plasma Ketones in Healthy Adults

INTRODUCTION: This recent Canadian study reports that the caffeine contained in 1  1/2 to 3 cups of unsweetened coffee is sufficient to increase plasma levels of ketones, including β-hydroxybuterate, for several hours.


A pilot Canadian study conducted at the Université de Sherbrooke in Sherbrooke, Quebec and published in the Canadian Journal of Physiology and Pharmacology on November 25, 2016 evaluated the effect of caffeine on the production of ketones in healthy adults. Researchers were interested in caffeine as a ketogenic agent based on its ability to increase lypolysis (the breaking down of fat for fuel).

Method of the Study

Two different doses of caffeine were administered to 10 healthy adults who had fasted for 12 hours and who then ate a breakfast that containing 85 gm carbohydrate, 9.5 gm fat and 14 gm of protein.

Subjects were either given;

(1) no caffeine

(2) a cup and a half of regular drip coffee

(3) three cups of regular drip coffee

The subjects plasma caffeine levels were measured over the next 4 hours and it was found that those that drank 1  1/2 cups of coffee had~ 2.5 mg caffeine per kilogram of body weight and those that drank 3 cups of coffee had ~ 5.0 mg caffeine per kilogram of body weight.

Plasma caffeine over time

Results – the effect of caffeine on ketone production

Subjects that had 1  1/2 cups of coffee (2.5 mg of caffeine per kilogram)  had 88% higher ketone production than subjects that had no caffeine.

Subjects that drank 3 cups of coffee (5.0 mg caffeine per kilogram of body weight) had 116% higher ketone production over subjects that had no caffeine.

β-hydroxybuterate per hour

Expressed as the amount of β-hydroxybuterate in μmol/L, it is evident that this ketone rises significantly in response to caffeine, and rises in a dose-dependent manner. That is, the more caffeine consumed the more β-hydroxybuterate was produced.

Amount of β-hydroxybuterate produced in response to caffeine dose

Researchers reported that the level of ketones found in the blood after 3 cups of coffee was approximately twice that produced after an overnight fast.

This increase in plasma ketones obtained with these doses of caffeine could, at least in the short term (a few hours) contribute to ~5-6% of brain energy needs.

Mechanism

The increase in free fatty acids as well as β-hydroxybuterate is explained by caffeine blocking phosphodiesterase (PDE), preventing the inactivation of cyclic adenosine monophosphate (cAMP) – with increased caffeine leading to higher levels of cAMP.

Cyclic adenosine monophosphate (cAMP) is a cellular messenger that is involved with transferring hormones such as glucogon, which is the main catabolic hormone of the body and which functions to raise both the concentration of glucose and fat in the bloodstream and has the opposite effect of insulin).

Glucagon needs cAMP in order to pass through the plasma membrane, so as a result cAMP serves to regulate glucose, fats and glycogen.

cAMP activates hormone sensitive lipase, an enzyme which breaks down fat (lypolysis). This increased breaking down of fat, increases free fatty acids (FFAs), which can then be converted in the liver to the ketones acetoacetate and β-hydroxybuterate.

Final Thoughts…

While this is a small study, the data supports that a few cups of regular, unsweetened coffee (without any butter or coconut oil added) increases the amount of ketones produced for several hours.

If you are following a low carb diet and are monitoring your blood or urine ketones, be aware that having coffee can increase the amount of ketones your body is producing.

you can follow me at:

 https://twitter.com/lchfRD

  https://www.facebook.com/lchfRD/

References

Vandenberghe C, St-Pierre V, Courchesne-Loye A, et al, Caffeine intake increases plasma ketones: an acute metabolic study in humans, Canadian Journal of Physiology and Pharmacology, 2017, Vol. 95, No. 4 : pp. 455-458 
Dr. David Perlmutter, MD (www.drperlmutter.com/caffeine-ketosis-friend-or-foe)

Note: Everyone’s results following a LCHF lifestyle will differ as there is no one-size-fits-all approach and everybody’s nutritional needs and health status is different. If you want to adopt this kind of lifestyle, please discuss it with your doctor, first.

Copyright ©2017 The LCHF-Dietitian (a division of BetterByDesign Nutrition Ltd.) 

LEGAL NOTICE: The contents of this blog, including text, images and cited statistics as well as all other material contained here (the ”content”) are for information purposes only.  The content is not intended to be a substitute for professional advice, medical diagnosis and/or treatment and is not suitable for self-administration without the knowledge of your physician and regular monitoring by your physician. Do not disregard medical advice and always consult your physician with any questions you may have regarding a medical condition or before implementing anything  you have read or heard in our content.

Increasing the Time Between Meals: Intermittent Fasting

When people think of “fasting” what comes to mind is an almost-intolerable short period of time without food, and with nothing to drink (except maybe water) and where people usually spend most of the time counting until they can eat again. This is the case when we are used to burning carbs as our fuel source and then just stop eating. Our body slows its metabolism in response to the severe calorie restriction in an effort to spare energy.  We feel cold, tired, lethargic and we find it difficult to concentrate because our body is in starvation mode.

When we are fat-adapted, we use the fat in our diet (dietary fat) and our own fat stores (endogenous fat) as our fuel source. When we “fast”, we stop supplying our body with dietary fat, so our body relies solely on our fat stores to supply its energy needs.  Most of us who are following a low carb high fat diet have plenty of endogenous fat, so when we aren’t eating, we don’t feel hungry, tired or cold because our body has a plentiful source of energy! Our basal metabolism doesn’t drop.  Rather than feeling cold and tired and finding it difficult to think, we are able to think clearly using ketones produced from fat to fuel our body, rather than glucose.

“Intermittent fasting” is simply increasing the amount of time between meals.  Fasting is not eating or rather, not eating now. It’s different than “starving” because our basal metabolic rate is being maintained through our fat stores. When we are in starvation mode, our basal metabolism drops significantly in order to spare energy – that’s why we feel cold and tired, because our body is saving calories for our brain and our heart to function. Fasting also doesn’t mean that we can’t consume anything! There are plenty of things we can have during the delay before our next meal. The most natural “intermittent fast” is the one between after supper and breakfast the next morning.  Yes, that is why it is called “breakfast”.

Why Fast?

When we eat, insulin is released in response to the presence of carbs in the food we eat and functions to (a) move glucose out of the blood and to (b) store the glucose that is not immediately needed for energy, as fat.

When we are accustomed (as most of us have been) to eating three meals a day plus having a couple of snacks, insulin is released every few hours. If we have been “grazing”, we have been constantly releasing insulin. As a result of this, our cells have become insensitive to insulin – something known as “insulin resistance“, or insulin tolerant.  To conceptualize this, think of going into a room with loud music.  At first your ears buzz and your auditory system is overwhelmed, but after a bit of time, your body adapts. It’s similar with smell.  When you’re exposed to a pungent odor, at first that’s all your can concentrate on, but after time passes, your brain starts to “tune out” the signals from your nose and you become less aware of the smell.  It’s not that the odor decreases, but our response to the odor, decreases as we become “tolerant” to that molecule bound to our olfactory receptors.

The difference with “insulin resistance” is that it is more than our body becoming “tolerant” of the circulating insulin, it actually responds less to it.

Think of someone that drinks considerable amounts of alcohol.  They can have 3 or 4 drinks and not feel intoxicated, because they have a “high tolerance” to the ethanol in the drink.  It takes more and more alcohol for them to respond. When someone is “insulin tolerant” (also called “insulin resistant”), the same amount of insulin has less and less effect, so to adapt, to be able to move the glucose out of the blood and store the excess energy as fat, the body needs to release more and more insulin. From years and years of eating 3 carb-based meals plus a couple of carb-laden snacks each day, our insulin levels simply don’t fall to baseline.

When someone is not insulin resistant, delaying the time before the next meal enables their insulin levels to fall to baseline (10-30 pMol) in approximately  12 hours, so if they don’t eat anything after dinner and their first meal of the day is breakfast the next morning, that time period is usually close to 12 hours. However, for people who are insulin resistant,  a longer time period is often needed for their insulin levels to fall to baseline. Just as insulin resistance developed over time, gradually, a new lower baseline can be set over time by increasing the length of time that one intermittently fasts.

Twelve-Hour Fast

A twelve-hour fast is the easiest one for most people to do, because during most of it, they’re asleep!

This is the one I suggest to my clients once they’re fat-adapted (usually after ~4 weeks of eating low carb high fat) as all it entails is not eating anything after supper until breakfast the next morning.

That’s it.

So, say they finish dinner at 6:30 PM, then the next time they eat is breakfast the next morning at 6:30 AM. This simple, short 12-hour “fast” is just enough to enable their insulin to fall to baseline. Doing this often, if not daily is the goal. This is entirely do-able and an important first step in restoring insulin sensitivity and it is certainly not something “radical”. Years ago, people didn’t eat after supper!

People who have Type 2 Diabetes should check with their doctor before beginning doing any form of Intermittent Fasting – and definitely should do so if they are on any kind of medication to manage their blood sugar, blood pressure or cholesterol, without having their doctors oversee it.  Medication will often need to be adjusted downward (and sometimes eventually discontinued entirely) as insulin sensitivity returns, so don’t do this without involving your doctor, first!

Eighteen Hour Fast

Once people have become used to not eating from supper until breakfast, they may want to wait to eat their first meal until noon the next day, especially if they don’t feel particularly hungry in the morning. Some people are not “breakfast” people and if they eat well the night before, they may not want to eat in the morning. An eighteen hour “fast” is from after someone has finished dinner (say, at 6:00 PM) until noon the next day.

Many do want their cup of coffee, which is totally fine provided it is unsweetened. I don’t recommend that people use sugar substitutes, especially the sugar alcohols such as sorbitol, mannitol or xylitol which have the same number of carbs per teaspoon as ordinary table sugar.

Cappuccino foamed with 1/2 oz of cream diluted with 1 oz of cold, filtered water

Cream can certainly be added to drip coffee and there’s no need to give up your morning latte or cappuccino – just a little creativity to replace the milk (which has almost as many carbs per cup as a slice of bread!).

My trick is to foam 1/2 an ounce of cream with an ounce or ounce and a half of cold, filtered water.

This makes fasting until lunch entirely possible!!

Twenty-four Hour Fast

Note: I don’t do these and I don’t recommend that my clients do these unless they are being very closely monitored by their doctor, however I want to describe them, so people know what they are.

twenty-four hour “fast” is from the end of supper one day, until the start of supper the following day (technically it is a 23-hour fast unless you add the extra hour  😯). As with the eighteen-hour fast, one can have unsweetened coffee or tea with a drop of cream, club soda (seltzer) with a twist of lime or lemon, or “bone broth”. “Bone broth” can be made from any kind of meat, fish or poultry bones, but for me, when I think of “bone broth”, I think of a wonderful, rich broth made from beef marrow bones, that is gently simmered overnight on the stove, ready to be sipped as desired, on a fast day.

To avoid getting constipated, many people will take psillium fiber with water each morning and which can be added to cups of “bone broth” or dissolved in a little bit of diluted coconut milk.

Ingredients for “bone broth” – beef marrow bones, ox feet, onion, garlic and fresh peppercorns


cup of beef “bone broth” – made from ingredients above

What’s not to love about sipping this when “fasting”?


The main purpose of delaying the time between meals (“intermittent fasting”) is to restore insulin sensitivity. When we aren’t eating, we aren’t releasing insulin – and as we continue eating low carb high fat and delaying the time between meals, our insulin receptors become sensitive to insulin once again.

Normalized blood sugar levels (both fasting blood glucose and HbA1C) is a natural byproduct, not the goal.  The goal is releasing less and less insulin in response to the food we eat and our body’s sensitivity to the insulin that we do release, being restored.

Weight loss is another added benefit!

Have questions about how I can help you? Please send me a note using the “Contact Us” form on the tab above.

you can follow me at:

 https://twitter.com/lchfRD

  https://www.facebook.com/lchfRD/

Note: Everyone’s results following a LCHF lifestyle will differ as there is no one-size-fits-all approach and everybody’s nutritional needs and health status is different. If you want to adopt this kind of lifestyle, please discuss it with your doctor, first.

Copyright ©2017 The LCHF-Dietitian (a division of BetterByDesign Nutrition Ltd.) 

LEGAL NOTICE: The contents of this blog, including text, images and cited statistics as well as all other material contained here (the ”content”) are for information purposes only.  The content is not intended to be a substitute for professional advice, medical diagnosis and/or treatment and is not suitable for self-administration without the knowledge of your physician and regular monitoring by your physician. Do not disregard medical advice and always consult your physician with any questions you may have regarding a medical condition or before implementing anything  you have read or heard in our content.


A Dietitian’s Journey – visibly evident progress after 5 months

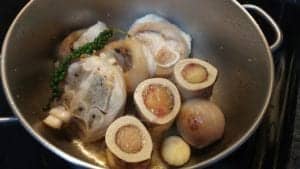
For the last 2 weeks, the Lower Mainland has been covered in smoke due to hundreds of wildfires in the area.  The very poor air quality had made going for a walk impossible.

Everywhere I went, I needed to wear an N95 mask to filter out the particulate matter and with the excessive heat and reddish-yellow skies, I had no desire to be out any longer than I needed to.

Over the weekend, cool marine finally air arrived and the air cleared for the first time in weeks. Finally it didn’t look like I was living on Tatooine.

When I woke up yesterday, the first thing I wanted to do was go for a morning walk. I walked 3 km around the local track and today I went again and decided to make a short video. When I went to upload it, I noticed how very different my face looked than from my first walk, 5 months ago (March 16 2017).

LEFT: March 16, 2017 | RIGHT: August 15 2017

I’ve only lost 13 pounds in the last 5 months since I began eating Low Carb High Healthy Fat, but the difference in how I look and how I feel is quite evident.  As I’ve covered in previous “A Dietitian’s Journey” blogs, my blood work has certainly reflected the change.

I don’t really do any exercise outside of walking and even then, I only started doing it regularly 7 weeks ago (June 22, 2017) and not for the last 2 weeks (due to the air quality advisory). Five weeks of walking has helped me tone my muscles a bit and lower my overall blood sugar, but not had any significant impact my weight loss. While for the last 8 weeks, I’ve delayed the start of my first meal (intermittent fasting) which has impacted my fasting blood sugar, it hasn’t really impacted my weight, as I consume the same amount of protein, fat and carbs per day, just over a shorter period.

My weight loss has really only been accomplished by doing what I have been teaching my professional clients to do over the last 2 years;  eating low carb and high healthy fat. I was tired of being the “fat Dietitian”! Now I’m now “practicing what I preach”.

Is it hard?  Not at all! This has to be the easiest way to eat and requires little, if no culinary skill. Sure, one can get pretty creative making all kinds of exciting ethnic foods if they know how to cook, but it is certainly not required!

The difference in how I feel is truly all the motivation to keep doing it! Losing weight is a bonus.

Want to know how I can help you achieve your own health and nutrition goals? Why not send me a note using the “Contact Us” form above.

To our good health!

Joy

you can follow me at:

 https://twitter.com/lchfRD

  https://www.facebook.com/lchfRD/

Here is the short video that I made today:

Note: I am a "sample-set of 1" - meaning that my results may or may not be like any others who follow a similar lifestyle. If you are considering eating "low carb" and are taking medication to control your blood sugar or blood pressure, please discuss it with your doctor, first.

Copyright ©2017 The LCHF-Dietitian (a division of BetterByDesign Nutrition Ltd.) 

LEGAL NOTICE: The contents of this blog, including text, images and cited statistics as well as all other material contained here (the ”content”) are for information purposes only.  The content is not intended to be a substitute for professional advice, medical diagnosis and/or treatment and is not suitable for self-administration without the knowledge of your physician and regular monitoring by your physician. Do not disregard medical advice and always consult your physician with any questions you may have regarding a medical condition or before implementing anything  you have read or heard in our content.


A Dietitian’s Journey – living on Tatooine

For the last two weeks, I have been living on Tatooine.  Not really, but it certainly has felt like that – with smoky, red sunrises and sunsets, inhospitable heat and high levels of ground-level ozone.  British Columbia, where I live, remains under a state of emergency as 148 wildfires continue to burn across the province, with this being BC’s worst fire season in almost sixty years. As a result, the air quality in many communities, including mine, has deteriorated to dangerous levels.

This is what the sunrise has looked like from my backyard the last two weeks:

There have been high concentrations of fine particulate matter known as PM2.5  in the air, which are solid or liquid droplets with a diameter of ≤2.5µm (micrometres). Due to their small size, these particles easily penetrate indoors, even when windows are closed and are small enough to pass from the lungs into the bloodstream – putting people with lung or heart disease, Diabetes or asthma at risk.

In addition to the smoky air, temperatures each day have been in the low- to mid-thirties Celcius (90-95 degrees Fahrenheit) which is highly unusual. Here in the Greater Vancouver area, we’ll get a few days in a row like that once or twice each summer, but not for two weeks solid!  Thankfully I have air conditioning, but it has been brutal to be outdoors.

Concentrations of ground-level ozone have reached and stayed at advisory levels.  This is formed when pollutants given off by the forest fires and compounds from the solvents used to put out the fires react in the air, in the presence of sunlight.

Even wearing an N95 mask outside which is designed to filter out the small smoke particles, I have found my breathing very laboured.

Needless to say, my morning and after-dinner walks have been impossible. I tried exercising indoors, but my lungs were simply too irritated from the small smoke particles.

I have continued with delaying the time between meals (referred to as “intermittent fasting”)but for shorter periods of time as my body is under physiological stress and I continue to eat a low carb high fat diet. My weight has dropped another pound over these last two weeks, despite no exercise at all. My blood sugar on the other hand is considerably higher without the walks.

An air quality analyst with Metro Vancouver has reported that the weather is expected to shift this coming weekend, allowing some of the smoke to begin to dissipate. Until then, part of taking care of my health is not to exercise. 

Reporting from Tatooine, British Columbia, I’m Joy Kiddie, practicing what I preach.

you can follow me at:

 https://twitter.com/lchfRD

  https://www.facebook.com/lchfRD/

Note: I am a “sample-set of 1” – meaning that my results may or may not be like any others who follow a similar lifestyle. If you are considering eating “low carb” and are taking medication to control your blood sugar or blood pressure, please discuss it with your doctor, first.

Copyright ©2017 The LCHF-Dietitian (a division of BetterByDesign Nutrition Ltd.) 

LEGAL NOTICE: The contents of this blog, including text, images and cited statistics as well as all other material contained here (the ”content”) are for information purposes only.  The content is not intended to be a substitute for professional advice, medical diagnosis and/or treatment and is not suitable for self-administration without the knowledge of your physician and regular monitoring by your physician. Do not disregard medical advice and always consult your physician with any questions you may have regarding a medical condition or before implementing anything  you have read or heard in our content.

Low Carb Beer Batter Fish

This recipe is posted as a courtesy to those following a variety of low-carb and ketogenic diets (not necessarily Meal Plans designed by me). This recipe may or may not be appropriate for you.

I have been asked so many times for this recipe, that I’ve decided to post it and while this isn’t everyday fare for me, one of my sons would eat it as often as I would make it. There is a local fish and chips place right on the Pacific Ocean and I’ve been told this easily rivals theirs.

Have a look:

Low Carb Beer Batter Fish

The batter is light and crispy – like the best tempura batter.

In fact, when I make fish this way, I dip slices of zucchini in the leftover batter, and make a deep fried side to go with it. I mean, why not?  Once you’re frying, might as well, right?

This is definitely not “everyday food” but “sometimes food”, but oh, is it good!

Low Carb Beer Batter Fish and Zucchini

I fry in cold-expressed virgin coconut oil, as it has a high smoke point and unlike commercial refined seed oils like grapeseed, soybean, sunflower,  safflower  and corn oil, cold-expressed virgin coconut oil doesn’t produce  Advanced Glycation End-Products (AGEs), which can cause oxidative damage to cells in the body.

I heat the coconut oil to between 160-170 °C or 320-340 °F, which is hot enough that a piece of batter dipped vegetable begins to puff and get golden quickly, but still allows some frying time for the internal parts to be fully cooked.

My favorite fish to fry this way is fresh Pacific Cod loins, but even defrosted Haddock Loins come out pretty good, if defrosted in the fridge until ~80% thawed, then pressed dry with a paper towel prior to dipping in batter, to get the excess water out.

Okay, enough background…here’s the recipe.


Low Carb Fish and Vegetable Beer Batter
  • 11 Tbsp unflavoured Whey Protein Isolate powder
  • 1 1/2 tsp baking powder
  • 1 tsp baking soda
  • 1 tsp pink Himalayan salt, ground
  • 1 tsp guar gum (or xanthan gum)
  • 3 eggs, large, free-range, beaten well
  • 3 Tbsp low carb beer (such as Sleeman Clear 2.0) or sparkling water (Club Soda, Seltzer)
Cooking Instructions
  1. Slice 6 cod or haddock loins in half and pat dry well with a paper towel.
  2. Cut one or two firm slender zucchini into 1/8″ (1/3 cm) slices.
  3. Heat the coconut oil in a heavy pot until between 320-340 °F. (160-170 °C).  Make sure there it is deep enough that the thickest piece of battered fish can float.
  4. Mix all the batter ingredients together in a wide, shallow bowl and whisk well for a minute or two, to make sure there are no lumps. (You can’t toughen the batter, as there is no gluten!)  The batter should be a light creamy yellow.
  5. When the coconut oil is hot enough, dip your zucchini (and/or other vegetables) and fry first on one side and then the other and set aside on a plate lined with several paper lunch bags, to absorb the excess fat. Don’t over cook. Be sure to whisk your batter back together for 20 seconds or so before dipping the fish to ensure the perfect consistency.
  6. Dip your dried, cut fish loins in the batter and coat well on both sides, and fry in the coconut oil until the batter is golden brown on the first side. Flip each piece over gently and fry on the second side, until the fish is cooked in the middle and a golden and crisp.*Don’t overcrowd the pot, as it will cause the oil temperature to decrease to much, and your fish will be greasy. I fry two pieces at a time in a 10″ (25 cm) pot.
  7. Transfer each piece to a plate lined with paper lunch bags, to absorb the excess oil.

Enjoy!

If you would like more information about the services I provide please have a look under the Services tab. If you have questions, please feel free to send me a note using the Contact Me form above, and I will reply as soon as I can.

You can follow me on:

Twitter: https://twitter.com/lchfRD
Facebook: https://www.facebook.com/lchfRD/
Instagram: https://www.instagram.com/lchf_rd
Fipboard: http://flip.it/ynX-a


A Dietitian’s Journey – 5 month update

It’s been 5 months since I began my own weight-loss journey, following a low carb high healthy fat diet and here is a short update.

Fasting Blood Glucose

When I began this journey at the beginning of March, my fasting blood glucose was averaging 12 mmol/L. Four months into eating low carb high fat, my fasting blood sugar was averaging 8.5 mmol/L.

July 25th, it was measured at the lab and on my home glucometer as 8.0 mmol/L – still way above the cutoffs for those with Type 2 Diabetes of 6.0 mmol/L, and way above the normal levels of 4.5-5.5 mmol/L.

It is highest is in the morning, I believe due to cortisol’s effect (see 4 month update, for details).

2 hour Post-Prandial Blood Glucose

I’ve been tracking my blood glucose regularly since I started implementing the dietary and lifestyle changes 5 months ago, and my 2 hr post prandial (after a meal) glucose had been averaging ~7.2 mmol/L, which is much better than the 7.7 – 8.6 mmol/L which is what it was at the beginning of March, but still no where good enough!

…but I noticed that after I go for my brisk 3-4 km each morning, it is 5.4 mmol/L. This gave me an idea (see below).

Blood Glucose through the night – effects of Cortisol

For about a week, I measured my blood glucose at 1 AM and 4 AM and 6 AM (in the interest of science, of course!) with a brand new glucometer that I standardized at the lab, when I had my fasting blood glucose and fasting insulin done on July 25th. My morning fasting blood glucose would rise to ~6.6 – 6.8 mmol/L (119 – 123 mg/dl) from the 5.4 mmol/L it was when I went to bed, even though I hadn’t eating or had anything to drink.  This had to be the effect of cortisol!

Fasting Cortisol

I had my fasting cortisol assessed the same day that I had my fasting blood glucose assessed (July 25 2017) and it was, as I suspected, high: 421 (125-536) nmol/L

…and this is with walking 4 km / day and sleeping 8 hours (restful sleep).

I need to come up with some additional strategies for lowering stress.

Fasting Insulin & Calculating Insulin Resistance

I also had my fasting insulin assessed the same day that I had my fasting blood glucose and fasting cortisol assessed (July 25 2017).

Based on the July 25th lab work, I calculated my Insulin Resistance using both Matthews (1985) Equations (HOMA1-IR), as well as using Oxford University Center for Diabetes, Endocrinology and Metabolism  homeostasis model assessment (HOMA2-IR)  calculator (2013).

From when my fasting insulin and fasting blood glucose was last tested 2 years ago in August 10, 2015, my insulin resistance  calculated by HOMA2-IR had gone down from 3.06 to 2.77, but it’s still too high because my fasting blood glucose remains high.

Average Insulin Resistance – in the normal population

One study reported that the average HOMA2-IR in the general (non-Diabetic) population is 2.1 +/- 2.2 (Diabetes Care, Volume 24, Number 3, March 2001), so I am guessing that a HOMA2-IR of 1.00 would be a healthy target – one that will likely take me a year to approximate.

Whether that will be possible with diet and lifestyle change alone, has yet to be seen.

That is my goal.

High Morning Glucose – assessing the problem

I believe the reason that my blood glucose remains high in the morning is due to a combination of residual hepatic (liver) insulin resistance (from years of eating way too many carbs) and high cortisol that is stimulating an overproduction of waking glucose.

Effect of Walking

The last 5 months, my fasting blood glucose has been consistently high at 8.0 – 8.5 mmol/L (144 – 153 mg/dl) and my 2 hour postprandial is fine for a Type 2 Diabetic at ~7.2 mmol/L – but a far cry from the non-Diabetic range I am seeking.

…but I noticed that after I go for my brisk 3-4 km walk each morning, my fasting blood glucose is 5.4 mmol/L (yes, I go fasting).

The effect of moderate exercise seems substantial, so I decided to see what effect there would be on my early morning fasting blood glucose levels if if I took a short walk after dinner.

The results were dramatic!

For the last week and a half, my blood glucose drops to ~5.2 – 5.4 mmol/L (94-97 mg/dl) after a very leisurely 15-20 minute walk around my neighbourhood.

High Morning Glucose – assessing the solution

Based on my high fasting blood glucose of 8.0 mmol/L on July 25th, my physician’s colleague naturally recommended that I go on Metformin, but I have decided to hold off on introducing it for 3 months provided that;

(1) I continue the dietary and lifestyle changes I have been doing for the last 5 months and…

(2) I add a 20-minute walk after dinner.

Plan to Reassess in Three Months

I am requesting that my physician provide me with a requisition to have my fasting insulin and FBG re-run in October, when I update my HbA1c, so I can recalculate my HOMA2-IR again and see how much less insulin resistant I am by then.

I want to know the magnitude of the insulin levels dropping, not just the fasting blood glucose, which I expect, will drop…after all, the goal is to lower the very high levels of insulin. High blood glucose is a symptom – the cause is too much insulin being released, due to insulin resistance.

Blood Pressure

As mentioned previously, I asked to be started on a very low dose of Ramipril (Altace) about 6 weeks ago, as my blood pressure had begun to creep up again. When I saw 160/90 mmHg two days in a row, I went to see my doctor.

10% of the time I am â‰¤ 119 / 79 mmHg, considered normal blood pressure

64% of the time I am â‰¤ 120/80 mmHg, categorized as “Prehypertension”.

…and 26% of the time, measured before I take my medication, I am â‰¤ 138/90 mmHg, categorized as “Stage 1 Hypertension”.

I will continue to take the blood pressure medication as a temporary measure to offer some protection against heart attack, stroke and kidney damage until I lose some more weight, and my blood pressure stays down on its own.

Weight

Overall, in the last 5 months, I have lost 12 pounds and ~3 inches off my waist. I’ve lost about the same number of inches off my neck circumference  (3 inches) which has had a dramatic effect on how I look.  I have a neck and ONE chin.

I’ve lost overall about an inch off my mid-arm, an inch off on my thighs (gaining muscle and losing fat, at the same time) and lost around an inch off my chest.

Lowering Stress, Lowering Insulin

I need to get my cortisol levels down, as these are driving my high morning fasting blood glucose levels. Walking in the morning has been good, adding the short evening walk even better. Now I am adding (on alternate days from my 3-4 km walks) a workout with 5 and 10 pound weights and other forms of resistance training. I am even jumping rope (which has gotten much harder since when I last did it at around age 16!).

The goal is to get my insulin levels down, and I am already doing everything that needs to happen for that; eating only the carbs necessary to have a nutritious diet, with no excess protein and extending the time between meals (intermittent fasting) a few days per week.

It is going to take time…

Over the next 3-6 months, I expect fasting insulin will keep falling.

My goal over the next year is to reach a ‘normal’ 2 hour postprandial peak of 60 mIU/L (430.5 pmol/L) as determined by Dr. Kraft’s Insulin Response curves, which should be an Insulin Resistance (HOMA2-IR) of between 1.0 and 2.0.

Over time, the fat in my liver (“hepatic adiposity”) will continue to decrease, and the derangement which took time to develop will resolve.

While the rate of resolution to for me to achieve normal insulin metabolism is unknown, I know if I keep doing what I am doing, it should happen. It doesn’t always occur, but I won’t know if I don’t try.

Have questions?

Want to know how I can help you achieve your health and weight goals? Why not send me a note using the “Contact Us” form, above.

To our good health!

Joy

you can follow me at:

 https://twitter.com/lchfRD

  https://www.facebook.com/lchfRD/

Note: I am a “sample-set of 1” – meaning that my results may or may not be like any others who follow a similar lifestyle. If you are considering eating “low carb” and are taking medication to control your blood sugar or blood pressure, please discuss it with your doctor, first.

Copyright ©2017 The LCHF-Dietitian (a division of BetterByDesign Nutrition Ltd.) 

LEGAL NOTICE: The contents of this blog, including text, images and cited statistics as well as all other material contained here (the ”content”) are for information purposes only.  The content is not intended to be a substitute for professional advice, medical diagnosis and/or treatment and is not suitable for self-administration without the knowledge of your physician and regular monitoring by your physician. Do not disregard medical advice and always consult your physician with any questions you may have regarding a medical condition or before implementing anything  you have read or heard in our content.


What is the Anti-Inflammatory Protocol and what is it used for?

Changing how and what we eat, as well as managing stress and getting enough restful sleep has been shown in research studies to reduce pain and symptoms in people with chronic inflammatory diseases such as Rheumatoid Arthritis, Fibromyalgia, Hashimoto’s Hypothyroidism, Celiac disease, etc.. As well, there is increasing evidence that cardiovascular disease, including heart attack and stroke are inflammatory in nature and that lowering risk is best managed through dietary and lifestyle changes. For those with a strong family history of heart disease, the Anti-Inflammatory Protocol dove-tails perfectly with a low-carb high healthy fat diet.


Knowing which foods promote inflammation and why and which foods are evidence-based to have anti-inflammatory properties  and why is essential for those seeking to reduce pain and symptoms associated with a chronic inflammatory condition. Choosing foods that are nutrient dense, promote gut health, address diet-related disruptions in hormone-regulation and that target immune system regulation are key in the Anti-Inflammatory Protocol.

Nutrient density — Every system in the body, including the immune system requires an array of vitamins, minerals, antioxidants, essential fatty acids, and amino acids to function normally. Micronutrient deficiencies and imbalances are considered key players in the development and progression of autoimmune disease, therefor attention is put on consuming the most nutrient-dense foods available. A nutrient-dense diet provides the building blocks’ that the body needs to heal damaged tissues. The goal is to supply the body with a surplus of micronutrients to correct both deficiencies and imbalances, supporting regulation of the immune system, hormone and neurotransmitter production.

Gut health — It is thought that gut dysbiosis’ (gut microbial imbalance) and leaky gut’ may be key facilitators in the development of autoimmune disease. The foods recommended on the Anti-inflammatory Protocol support the growth of healthy levels and a healthy variety of gut microorganisms. Foods that irritate or damage the lining of the gut are avoided, while foods that help restore gut barrier function and promote healing are encouraged.

Diet-related Disruptions in hormone regulation – What we eat, when we eat, and how much we eat affects a variety of hormones that interact with the immune system. Eating foods with too much sugar or grazing’ throughout the day, rather than eating food at set meals spaced apart deregulate these hormones. As a result, the immune system is typically stimulated. Promoting regulation of these hormones through diet, in turn has a modulating effect on the immune system. As well, dietary hormones that impact the immune system are also profoundly affected by how much sleep we get, how much and what kinds of activity we do, and how well we reduce and manage stress, so looking at diet and lifestyle together, is key.

Immune system regulation — Our intestines are home to millions of bacteria which live in symbiotic relationship with us.  We provide food for them and when in balance, they maintain the integrity of the gut wall, which serves as a protective barrier. When our gut ‘flora’ gets out of balance, having an excess of pathogenic bacteria, this protective barrier becomes compromised, resulting in small ‘holes’ that permit exchange between the inside of our gut and the blood stream.  This is what is called “leaky gut“. Endotoxins produced by the proliferation of “bad” bacteria can get into the blood stream, stimulating the immune system, and resulting in systemic inflammation. What becomes critical is to limit the factors that contribute to excess of the “bad bacteria” and restore a healthy amount and diversity of ”good” gut microorganisms, so that the gut once again functions as a protective barrier, and immune system regulation is achieved.

What is the Anti-Inflammatory Protocol?

The Anti-Inflammatory Protocol identifies foods that promote inflammation from those that research indicates have anti-inflammatory properties. It isn’t simply a list of “eat this” and “don’t eat that”, but explains what about a particular food promotes inflammation or inhibits it. It explains the role of key inflammatory -producing compounds such as lectinssaponins and protease inhibitors, and which foods they are found in, and how eating those foods contribute to “leaky gut”. Which grains can one eat?  Which should be avoided? What about beans and lentils? Are there some better than others?

The Anti-Inflammatory Protocol explains which healthy cooking and eating fats won’t contribute to the production of Advanced Glycation End-Products (AGEs) – and how this compound causes oxidative damage to the cells in the body. Knowing this enables people to know whether oils such as grapeseed for example, are a good choice and if not, why – as well as which other oils would be preferable.

I want people to understand in simple terms how omega 6 (ρ‰-6) fats compete for binding sites and elongation enzymes with omega 3 (ρ‰-3) fats, as this enables them to determine whether foods such as nuts and seeds should be included in an anti-inflammatory diet. If they understand the role of hormones such as insulin and what causes it’s release, they can determine for themselves whether products like agave syrup or coconut sugar are preferable to table sugar when following an anti-inflammatory protocol. I find that once people understand the theory as to why they should eat less of certain foods (explained in ways that don’t require an educational background in science!) and they also understand which types of foods they should aim to eat more of, they are empowered to make dietary choices that contribute to reducing inflammation, as well as symptoms, along with risk factors for other inflammation-related conditions.

I consider my primary role is as an educator. I don’t want to tell someone they need to eat this food on this day and this other food on the next day.  It is far more rewarding and helpful to them, if I help them know how to make these decisions themselves.

Want to know more? Why not send me a note using the “Contact Us” form above.

To our good health,

Joy

you can follow me at:

 https://twitter.com/lchfRD

  https://www.facebook.com/lchfRD/

Note: Everyone’s results following a LCHF lifestyle will differ as there is no one-size-fits-all approach and everybody’s nutritional needs and health status is different. If you want to adopt this kind of lifestyle, please discuss it with your doctor, first.

Copyright ©2017 The LCHF-Dietitian (a division of BetterByDesign Nutrition Ltd.) 

LEGAL NOTICE: The contents of this blog, including text, images and cited statistics as well as all other material contained here (the ”content”) are for information purposes only.  The content is not intended to be a substitute for professional advice, medical diagnosis and/or treatment and is not suitable for self-administration without the knowledge of your physician and regular monitoring by your physician. Do not disregard medical advice and always consult your physician with any questions you may have regarding a medical condition or before implementing anything  you have read or heard in our content.

Part 2: How is Insulin Resistance Measured?

The introduction to this article (Part 1: What is Insulin Resistance)  explains what insulin resistance is, the conventional treatment for it and the drawbacks to that treatment: https://www.lchf-rd.com/2017/07/26/what-is-insulin-resistance/

INTRO: There are a number of tools available for measuring insulin resistance, most of which are more suited to a research setting, including the Quantitative Insulin Sensitivity Check Index (QUICKI) and the Matsuda Index.  Others, such as the McAuley -, Belfiore -, Cederholm -, Avignon – and Stumvoll Index are better suited for epidemiological (population) research studies and are often compared to the ”gold standard” for the measurement of insulin sensitivity, the Hyperinsulinemic Euglycemic Clamp (HEC).

The homeostasis model assessment (HOMA-IR) method is suitable for individuals to use with their doctors or Dietitians to assess insulin resistance, and is useful for using over time to measure the impact of dietary and lifestyle changes in lowering insulin resistance.


Visualizing Insulin Resistance

Insulin resistance can be determined by measuring insulin response to a standard glucose load over a 5 hour period and plotting the Insulin Response curves – which is precisely what Dr. Joseph R. Kraft MD, who was Chairman of the Department of Clinical Pathology and Nuclear Medicine, St. Joseph Hospital, Chicago, until his retirement.

Dr. Kraft spent more than a quarter century devoted to the study of glucose metabolism and blood insulin levels – collecting data in almost 15,000 people, aged 3 to 90 years old. Between 1972 and 1998, Dr. Kraft measured the Insulin Response and data from 10,829 of these subjects indicated that 75% of subjects were insulin resistant.

Compiling this data, five distinct Insulin Response Patterns emerged.

Pattern I

The light green curve below, is what a normal insulin response should look like. Insulin levels should rise steadily in the first 45 minutes (in response to the standard glucose load) to no higher than ~60 mIU/L (430.5 pmol/L) and then decrease steadily until baseline by 3 hours.

PATTERN II

People who are in the early stages of insulin resistance (Pattern II, represented by the yellow curve) release considerably more insulin in response to the exact same glucose load. Insulin levels rise to ~ 115 mIU/L (825 pmol/L) in the first hour and then take considerably longer (5 hrs) to drop back down to baseline, than the normal response.

PATTERN III

People who have progressed in insulin resistance to Pattern III have insulin levels that keep rising for the first 2 hours and then drop off more sharply, back down to baseline.

PATTERN IV

Those with Type 2 Diabetes / very high insulin resistance (Pattern IV) release huge amounts of insulin almost immediately, reaching levels of ~ 150 mIU/L (1076 pmol/L) at 1 hour.  Then for the next 2 hours, insulin continues to climb, before it begins to decline to baseline.  Even at 5 hours, insulin levels never decrease to normal values.

PATTERN V

Is what is seen in Type I Diabetes (T1D), when there is insufficient insulin production.

Please see Significance of Insulin Resistance for more details on Dr. Kraft’s findings: https://www.lchf-rd.com/2017/03/22/featured-significance-of-insulin-resistance/

While a 5 hour glucose tolerance test is not available at most labs, a 2 hour glucose tolerance test (2hrGTT) will indicate whether or not a person is insulin resistant or Type 2 Diabetic. 

However, once a person is already diagnosed as Type 2 Diabetic, most medical plans will not cover the cost of having the test re-performed in order to determine if insulin response has changed in response to diet and lifestyle changes.

This is where the the homeostasis model assessment of insulin resistance (HOMA-IR) comes in – a tool easily used by clinicians and relying on standard blood tests.

Homeostasis model assessment of insulin resistance (HOMA1-IR) – Matthew’s Equations (1985)

The homeostasis model assessment was first developed in 1985 by David Matthews et al and is method used which quantifies insulin resistance and β-cell function of the pancreas from fasting blood glucose and either fasting insulin or C-peptide concentrations.

Pancreatic β-cells are responsible for insulin secretion in response to increasing glucose concentrations, so when there is decreased function of the pancreas’ β-cells, there will be a reduced response of β-cell to glucose-stimulated insulin secretion.

In addition, glucose concentrations are regulated by insulin-mediated glucose production in the liver, so insulin resistance is reflected by reduced suppression of hepatic glucose production, stemming from the effect of insulin.

The HOMA-IR model describes this glucose-insulin homeostasis using a simple equation, based on fasting blood glucose and fasting insulin. The equation uses the product of fasting plasma insulin (FPI) x fasting plasma glucose (FPI), divided by a constant of 22.5, providing an index of hepatic insulin resistance:

HOMA1-IR = FPI (mu/I) x FBG (mmol/L) / 22.5

The “Blood Code” book is based on these 1985 equations. The problem with the Matthew’s Equations is that they underestimate Insulin Sensitivity (%S) and overestimate % β-cell function.

Homeostasis model assessment of insulin resistance (HOMA2-IR)

Oxford University, Centre for Diabetes, Endocrinology and Metabolism in the UK, has designed a HOMA2-IR model (2013) that estimates β-cell function (%B) and insulin sensitivity (%S) for an individual from simultaneously measured fasting plasma glucose (FPG) and fasting plasma insulin (FPI) values. It also can be used with fasting specific insulin or C-peptide values, instead of fasting RIA insulin.

The HOMA2-IR calculator provides % β-cell function (% B ) and % Insulin Sensitivity (%S): https://www.dtu.ox.ac.uk/homacalculator/download.php.

It is important to note that HOMA-IR values vary by ethnic group, but looking at humans as one, a normal HOMA-IR value for a healthy person ranges from 0.5-1.4

  • Less than 1.0 means you are insulin-sensitive which is optimal.
  • Above 1.9 indicates early insulin resistance.
  • Above 2.9 indicates significant insulin resistance.

Use of Tools

While these tools are primarily used by clinicians, knowing about them is useful in being proactive in managing one’s own health.  For example, if you have already started making the dietary and lifestyle changes to lower insulin resistance, having your fasting insulin measured along with your fasting blood glucose, will enable your doctor or myself to calculate your progress, as well as recommend adjustments in your plan.

Have questions?

Why not send me a note using the “Contact Us” form at the top of this web page.

To our good health!

Joy

you can follow me at:

 https://twitter.com/lchfRD

  https://www.facebook.com/lchfRD/

References

Gutch, M, Kumar, S, Razi, SM, et al,  Assessment of Insulin Sensitivity / Resistance, Indian J Endocrinol Metab. 2015 Jan-Feb; 19(1): 160—164.

HOMA Calculator©, University of Oxford, Diabetes Trials Unit, Oxford Centre for Diabetes, Endocrinology and Metabolism: https://www.dtu.ox.ac.uk/homacalculator/download.php


 https://twitter.com/joykiddieRD

  https://www.facebook.com/lchfRD/


Note: Everyone's results following a LCHF lifestyle will differ as there is no one-size-fits-all approach and everybody's nutritional needs and health status is different. If you want to adopt this kind of lifestyle, please discuss it with your doctor, first.

Copyright ©2017 The LCHF-Dietitian (a division of BetterByDesign Nutrition Ltd.) 

LEGAL NOTICE: The contents of this blog, including text, images and cited statistics as well as all other material contained here (the ”content”) are for information purposes only.  The content is not intended to be a substitute for professional advice, medical diagnosis and/or treatment and is not suitable for self-administration without the knowledge of your physician and regular monitoring by your physician. Do not disregard medical advice and always consult your physician with any questions you may have regarding a medical condition or before implementing anything  you have read or heard in our content.

Part 1: What is Insulin Resistance?

The hormone insulin plays a number of roles, one of which is to help move the glucose that is produced from the digestion of food – from the blood and into the cells for energy. Insulin resistance is where the body isn’t responding to insulin’s signals to take up glucose, so blood glucose remains high, despite normal or high levels of insulin.

Type 2 Diabetes (T2D) is essentially a state of very high insulin resistance.

Insulin normally goes up when we eat foods that contain carbohydrate (breads, pasta, rice, fruit, milk products, etc.) and acts on the liver to help store the incoming food energy – first as glycogen and when liver and muscle glycogen stores are “full”, it acts to store the excess energy as fat (de novo lipogenesis).

When we haven’t eaten for a while or are sleeping, the hormone glucagon acts to break down the glycogen in our muscles and liver (glycogenolysis) in order to supply our brain and cells with glucose. Insulin acts to inhibit glucagon’s action, which signals the body to stop making new glucose from its glycogen stores. When our glycogen stores run out (such as when we are fasting), the body turns to non-carbohydrate sources such as fat to make the glucose it needs for essential functions (gluconeogenesis).

When we are insulin resistant, insulin continues to act on the liver to signal it to store energy. When glycogen stores are “full”, it stores the excess energy as fat. When fat stores are “full”, the body starts storing the excess fat that the liver keeps making, inside the liver itself.  There shouldn’t be fat in the liver, but when we are insulin resistant, such as in Type 2 Diabetes excess fat gets stored in the liver in a condition known as “fatty liver disease”.

In insulin resistance, the liver becomes more sensitive to insulin’s signal to make fat (and as a result keeps making more and more fat) yet at the same time, the liver becomes less sensitive to insulin’s inhibition of glucagon – resulting in more and more glucose being produced and released in the blood.

High levels of glucose remain in the blood despite adequate insulin, and it is this high level of blood glucose that is the hallmark symptom of Type 2 Diabetes. For the same quantity of insulin released, the body moves less and less glucose into the cell. 

What does the body do to compensate? It makes more insulin!

KEY POINT: Insulin resistance results in the increased production of insulin. Increasing blood sugar CAN a symptom, caused by the insulin resistance, but blood glucose can be normal and one can still be insulin resistant (see Featured Article on Insulin Resistance).

When we are insulin resistant and keep eating a carb-based diet, the body requires more and more insulin in order to move the same amount of glucose into the cell.

The main issue then becomes too much insulin (hyperinsulinemia).

Defining the Problem Defines the Treatment

In Type 2 Diabetes (which is in essence, very high insulin resistance), the symptom is high levels of glucose in the blood. That is not the cause. It is the symptom.

High levels of glucose in the blood resulting from uncontrolled Type 2 Diabetes, results in proteins in the body becoming “glycosylated”. Glucose, is a highly reactive molecule and easily accepts (or “shares”) electrons from other molecules – especially from the amino acid Lysine, which is found in virtually every protein in the body. When Lysine and glucose share an electron, it creates an irreversible chemical bond between the glucose molecule and the protein – and that protein is said to have become glycosylated. It is this glycosylation that lies behind the complications found in Diabetes.

To reduce the glucose in the blood and the glycosylation of the body’s proteins, current treatment for Type 2 Diabetes involves medications that move glucose from the blood into the cells. This doesn’t really remove the excess glucose from the body, it simply moves it to a different location in the body. While these medications can be very helpful in the short term (until people begin to address the underlying dietary causes), over time these medications become less and less effective at removing glucose from the blood. In a sense, we become “medication resistant”, so additional medications are added.  Once the various combinations of medications loose their effectiveness, people with Type 2 Diabetes are prescribed insulin as a treatment – because insulin moves excess glucose into the cells. But the cells are already overflowing with too much glucose!

Insulin is added as a treatment when the body is already producing too much insulin.  The problem is the cells aren’t responding to the signal from insulin. The body doesn’t need more insulin – it needs the cells that are sensitive to respond to insulin’s signal.

Diabetes as a “chronic, progressive disease”

Type 2 Diabetes is described as a “chronic, progressive disease” because with current medication treatment, people eventually get worse. When they no longer respond to the initial medications  prescribed that help move excess glucose from the blood into the cells, they are prescribed insulin which they take by injection – in order to force more glucose into already over-full cells.  While people’s blood glucose gets better (i.e. the symptom improves), they gain weight as a result of the insulin injections and develop complications such as heart disease, stroke, kidney disease, blindness etc..

In the end, they don’t get better, but worse, fulfilling the belief that T2D is a chronic, progressive disease.

Redefining the Problem, Redefines the Solution

Rather than looking at the symptom (high blood glucose) as something that needs to be “fixed” with medications and later with insulin (when the medications are no longer effective), when we define insulin resistance and Type 2 Diabetes as a problem of excess insulin, we approach addressing the problem differently.

By changing what we eat, we can lower the amount of glucose in the body, which in turn causes the body to produce less insulin.  With less insulin being produced, the cells begin to respond to normal amounts of insulin  – reversing insulin resistance and yes, reversing the symptoms of Type 2 Diabetes.

Eating a low carb high fat diet and extending the amount of time between meals (intermittent fasting) lowers the production of insulin, resulting in the cells become more sensitive to its signal. Rather than addressing the symptom (which is high blood glucose) we are addressing the problem of too much insulin.

Have questions? Would like to know how I could help you?

Why not send me a note using the “Contact Us” form on the tab above.

To our good health!

Joy

you can follow me at:

 https://twitter.com/lchfRD

  https://www.facebook.com/lchfRD/

In Part 2, I will explain how insulin resistance is measured and how we can track insulin sensitivity returning, as we continue to eat a low carb diet and increase the time between meals.

Copyright ©2017 BetterByDesign Nutrition Ltd.  LEGAL NOTICE: The contents of this blog, including text, images and cited statistics as well as all other material contained here (the ”content”) are for information purposes only.  The content is not intended to be a substitute for professional advice, medical diagnosis and/or treatment and is not suitable for self-administration without regular monitoring by a Registered Dietitian and with the knowledge of your physician. Do not disregard medical advice and always consult your physician with any questions you may have regarding a medical condition or before implementing something you have read or heard in our content. 


Fasting Blood Glucose – the evening walk

As I’ve made it a habit to do each weekday, this morning I went out for my walk, using Nordic poles.  I had an appointment to keep, so I kept it to 3 km at a brisk pace, around that beautiful lake that I’ve previously posted a video update from.

Despite eating quite low carb and delaying the amount of time between meals each weekday, my fasting blood sugars remain high.  I’ve noticed that after I walk in the morning, they come down significantly, so I’ve decided to integrate a short walk around my neighbourhood after dinner, to see if my fasting blood glucose lowers.  It should, which leaves me to determine how long a walk is ideal. I don’t want to make it a “workout”, as that can interfere with sleep, but I also don’t want to make it so short that it doesn’t have any effect.  Today I started with a 15 minute walk at a comfortably brisk pace.  Tomorrow, I’ll try longer, to see if it changes the results in the morning, and if so by how much.

As I began my walk, I realized that I’ve lived in this neighbourhood for several years, yet never walk around it.  I guess it’s time I get to take in the beauty that is all around me.

Practicing what I preach!

Joy

UPDATE

It turns out, that a leisurely 20 minute walk after dinner results in my blood glucose dropping to ~5.2 – 5.4 mmol/L  (94-97 mg/dl) and staying that way through the night (measured at 1 AM and 4 AM and 6 AM in the interest of science, of course!).

This is now part of my routine!

you can follow me at:

 https://twitter.com/lchfRD

  https://www.facebook.com/lchfRD/

Note: Everyone’s results following a LCHF lifestyle will differ as there is no one-size-fits-all approach and everybody’s nutritional needs and health status is different. If you want to adopt this kind of lifestyle, please discuss it with your doctor, first.

Copyright ©2017 The LCHF-Dietitian (a division of BetterByDesign Nutrition Ltd.) 

LEGAL NOTICE: The contents of this blog, including text, images and cited statistics as well as all other material contained here (the ”content”) are for information purposes only.  The content is not intended to be a substitute for professional advice, medical diagnosis and/or treatment and is not suitable for self-administration without the knowledge of your physician and regular monitoring by your physician. Do not disregard medical advice and always consult your physician with any questions you may have regarding a medical condition or before implementing anything  you have read or heard in our content.

A Dietitian’s Journey – what’s that on the floor?

This morning, as I was getting ready to go out for my walk, I noticed something on the floor.  As I started to bend down to pick it up, I realized it was my own toes! There they were – peeking out from under my shrinking abdomen! It shouldn’t be that the sight of one’s own toes while standing elicits such a surprised reaction, but it did.

As usual, I went walking this morning – something that has become a routine, since I fractured a rib 5 weeks ago (washing a bathtub, of all things!).  It was supposed to reduce the associated muscle pain (which it did) and after a few weeks, I realized I was really enjoying this “me” time, walking around a local lake. This week, I started Nordic walking (using Trek poles) and have really enjoyed the full-body exercise.  Even the drizzle wasn’t going to stop me today. After all, that’s what rain shells are for.  In fact, the one I grabbed this morning was the one I bought two years ago online, but that was too small, but today I put it on and zipped it right up. Finally, my body is changing! After 4 months of seeing very slow progress, the progress is becoming more and more evident.

Three weeks ago, at the encouragement of a local area physician whose practice focuses on low carb eating, I decided to take some body measurements, to track my progress.  I measured mid arm circumference  (between the point of my elbow and the pointy part of my shoulder blade), the my midpoint on my neck, my chest (where a brassiere would sit), my thigh (midway between my knee and my hip, at the widest part) and my abdomen at my umbilicus (or belly button) – which I have been tracking from the beginning.

[I don’t bother tracking my “waist” because this is smaller than the umbilicus, and what I want to assess is abdominal fat, which is better measured at the belly button.]

In the last three weeks, I’ve lost:

1/2 inch off my mid-arm

2 inches off my neck (yes I checked and rechecked this one!)

1 inch off my chest

1 inch off my umbilicus circumference

and gained 1/2 inch (of muscle) on my thighs.

Also during the last 3 weeks, I’ve lost 2 1/2 pounds and my fat percent has dropped 1.2%.

And today, I saw my toes!!

Yes, I have a long way to go, but I am not focusing on the destination but on the journey.  

I am enjoying eating real food and not feeling uncomfortably full afterwards (something absent since I gave up eat carb-based foods!).

I enjoy being able to delay the time between meals (intermittent fasting) without feeling hungry, tired, grumpy or deprived). Since I’m a Dietitian, I talk or write about food all day during the work week and most days I eat only supper.  Today I was hungry, so I ate a meal at 11am – but I still had a 16 hour ‘fast’ from supper last night until I ate today, where I hadn’t eaten anything. This time is so important, to enable my insulin levels to fall, and lower my insulin resistance that had been created by me previously eating 3 meals and 2-3 snacks per day, all centered around complex carbs – for years.

I like the feeling of being active; having gone from being totally sedentary (inactive) to being moderately active (45 minutes 5 days / week). I don’t exercise in order to lose weight, but because it is good for my heart and brain and it lowers my stress level (lowering cortisol).  This in turn is good for my blood pressure and for overall health. I enjoy doing it early in the morning and enjoying the feeling of well-being and satisfaction all day long.

For the first time in many years, I don’t eat because I am craving something, I eat because I am hungry!  In fact, I don’t crave anything!  I eat a small amount of dark chocolate each day (for health, of course) and even while intermittent fasting, I can walk through a bakery section of a store and not be the slightest bit interested in any of it.  My body is happily burning my own fat (which I have plenty of!) so I’m good.  I’m always drinking sparkling water (which I make at home) and usually finish 2 litres (a little less than 2 quarts) by the time I return from my morning Nordic walk.

I am sleeping so much better than I have in many years and have discontinued the prescription that I would keep on hand for the frequent nights I was unable to fall asleep. I still wake up sometimes because of my healing fractured rib (if I roll over) but other than that I wake up rested.  What a thought – waking up rested AND seeing my toes! I can get used to this.

Have questions?

Want to know how I can help you achieve your own health goals?  Why not send me a note using the “Contact Us” tab above.

To our good health!

Joy

you can follow me at:

 https://twitter.com/lchfRD

  https://www.facebook.com/lchfRD/

Note: I am a “sample-set of 1” – meaning that my results may or may not be like any others who follow a similar lifestyle. If you are considering eating “low carb” and are taking medication to control your blood sugar or blood pressure, please discuss it with your doctor, first.

Copyright ©2017 The LCHF-Dietitian (a division of BetterByDesign Nutrition Ltd.) 

LEGAL NOTICE: The contents of this blog, including text, images and cited statistics as well as all other material contained here (the ”content”) are for information purposes only.  The content is not intended to be a substitute for professional advice, medical diagnosis and/or treatment and is not suitable for self-administration without the knowledge of your physician and regular monitoring by your physician. Do not disregard medical advice and always consult your physician with any questions you may have regarding a medical condition or before implementing anything  you have read or heard in our content.

A Dietitian’s Journey – four month update (with lab test results)

It’s been 4 months since I began my own weight-loss journey, following a low carb high healthy fat diet and I’ve been to the lab and had my blood tests.  Here is an update on my progress to date.

Blood sugar

Fasting blood sugar

When I began this journey at the beginning of March, my fasting blood glucose was averaging 12 mmol/L – and this was when I was eating the ‘standard recommended diet’ for someone with Type 2 Diabetes. My diet was high in complex carbs, and low in saturated fat. Also, as has been traditionally recommended for someone with Type 2 Diabetes, I ate 3 meals per day and made sure to have 2 – 3 snacks per day (each with complex carbs and some protein).

Now, four months into eating low carb high fat, my fasting blood sugar is averaging 8.5 mmol/L. It is significantly better, but not what I had hoped which was to be at or below 6.0 mmol/L (below the Diabetic cutoff range) in this time.  There were factors that I was not considering.

Firstly, my blood sugar has been persistently high in the morning since I have been in nutritional ketosis – significantly higher than 2 hours after a meal.  At first, I couldn’t figure out why. I’d been tracking my blood glucose at various times of the day; fasting, before I eat, 2 hours after I eat, before bed etc., but regardless what I ate the night before, it was highest in the morning.  It was then that I began to suspect that the effect of the hormone cortisol might be a factor.

Cortisol is our “fright and flight” hormone and under stressful conditions, such as being chased by someone or something, cortisol  provides the body with an immediate source of glucose by breaking down our glycogen stores in our muscle and liver (a process called glycogenolysis) and uses them to manufacture glucose in the liver (a process known as gluconeogenesis).

All hormones have a natural cycle of rising and falling throughout the day and this is known as a hormone’s circadian rhythm and over the course of the night, cortisol production begins to climb around midnight and reaches and is highest level between 6 am to 8 am.  When I began to track my blood sugar from 10 pm until 8 am, I noticed that it would start going up in the wee hours of the morning and keep rising until 6:30 or 7 am, am when I would take it. It was then that it became evident that my fasting blood sugar was rising with cortisol.

Chan S, Debono M. Replication of cortisol circadian rhythm: new advances in hydrocortisone replacement therapy. Therapeutic Advances in Endocrinology and Metabolism. 2010;1(3):129-138. doi:10.1177/2042018810380214.

When we sleep, our body breaks down the glycogen stored in our muscle and liver and converts it to glucose for our blood – an entirely normal process. Since I am following a low carb high fat diet and have been in nutritional ketosis for while, my body uses ketones as its primary fuel source and make all the glucose it needs for my blood from the protein and fat in my diet. When it runs out of that, it burns my stored fat for fuel – which is exactly what I want it to do! Since I’d been keeping my carbohydrate intake consistent but not very low, when cortisol levels would rise over night, my body would break down my glycogen first, then my own fat stores to make glucose for my blood, which I suspect is the origin of my high fasting blood glucose. That, combined with my liver still being insulin resistant, the glucose has no where to go.

This made sense to me and explained why my fasting blood glucose remained high, despite no carb creep (more carbs than planned for).

Since I’m keeping myself in nutritional ketosis, I’m not concerned about my fasting blood glucose remaining higher, although I may try distributing my carbs differently – with fewer at night. Since my goal is lower insulin resistance, I am going to continue to focus on that. High blood sugar is a symptom.  The problem is insulin resistance.

My blood glucose 2 hours after meals has been getting better. It is now averaging around 6.0 mmol/L (sometimes hovering around 5.5 mmol/L) which is much better than 7.2 – 8.6 mmol/L which is what it was at the beginning of March. My goal is to see it consistently below 5.0 mmol/L after meals by mid-November.

HbA1C – glycosolated Hemoglobin

Glycosolated hemoglobin (HbA1C) is the hemoglobin in our red blood cells that gets sugar molecules attached to it proportional to the amount of sugar in our blood. It is used to measure the three-month average plasma glucose concentration, based on the fact that the lifespan of a red blood cell is four months (120 days). The advantage of this test, is that one does not need to be fasting to have it.

HbA1C is most strongly correlated with fasting blood glucose (as opposed to pre-meal blood sugar or to 2 hour post-meal blood sugar) and since my fasting blood glucose has been consistently high, my HbA1C results naturally reflected this.  Lab tests indicate it is 7.5%, which is above the upper cutoff for Type 2 Diabetics of 7.0% – and higher than what I was aiming for, which was below 6.0%, the Diabetic range cutoff. However, since neither fasting blood glucose nor HbA1C  measure what I am trying to change (which is insulin sensitivity), I’ve decided that in November, I will pay to have my fasting insulin re-assessed.  After all, the goal is to lower insulin – which underlies the high blood sugar!

Lowering Stress

I knew that I needed to get my cortisol levels down, as cortisol drives appetite, which drives eating which in turn, causes insulin to be released. More insulin means my body will be focused on fat storage, not fat burning which is the opposite of what I want. Since my goal is lowering insulin resistance, lowering cortisol makes sense. Since I can’t change cortisol’s natural circadian rhythm, I had to focus on lowering the whole curve!  Lowering stress wasn’t going to happen sitting at my desk working. I had to get moving.  More on that, below.

Blood Pressure

As mentioned in my last update, a month ago I asked to be started on a very low dose of Ramipril (Altace), as my blood pressure had begun to creep up again. When I saw 160/90 mmHg two days in a row, I went to see my doctor.  He wasn’t there, but the locum agreed with my assessment that it was wise to protect my heart, brain and kidneys while I continued to make the dietary and lifestyle changes.  She asked me to delay getting my blood work for a few weeks, to assess my electrolytes (sodium and potassium) level which can be affected by the medication.

Even two years ago, my potassium was at the high end of normal – and this was when I was dutifully eating a diet high in complex carbs and low in saturated fat, as I ate a diet high in potassium-rich foods.

This time my potassium was at the upper normal limit, so I’m tracking my intake of it and keeping it approximately 1/3 to 1/2 of what it was previously.

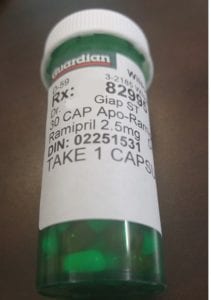
Taking the blood pressure medication is a temporary measure that I decided on in order to offer some protection against heart attack, stroke and kidney damage until I lose more weight, and my blood pressure stays down on its own.

Thankfully, my overall kidney function is now better than it was 2 years ago, although I did need to make a few dietary changes to be sure that I avoid getting kidney stones (something that runs in my family).  When I started exercising regularly a month ago, I didn’t adequately increase my water intake – which I’ve since corrected.  I had also added a calcium supplement when I stopped drinking milk in March and which was binding with certain food components in the veggies and nuts I was eating.  This was probably what was resulting in calcium-oxalate being detectable in my urine. I’m no longer taking the calcium supplement and have added more hard cheese into my diet, instead.

Cholesterol

My LDL was at the high-end cutoff two years ago, but after 4 months on a low carb high healthy fat diet, it is approaching what is considered by the existing / popular standards of “optimal LDL” for someone who is high risk (family history of cardiovascular disease). My LDL is 2.60 mmol/L (1.14 mg/dl), my triglycerides (TG) were 0.64 mmol/L and my HDL was 1.97 mmol/L.

Using more significant measures, my TG:HDL ratio is now 0.32 (with <0.87 considered ideal). According to several studies (that I will go into more detail in an upcoming article), a very low TG:HDL ratio is associated with lots of large, fluffy LDL – the kind associated the lowest risk of cardiovascular disease (CVD) such as heart attack and stroke. It is the higher density, small LDL particles that are associated with CVD.

Walking

A month ago, I began walking every morning during the weekdays.  I had just fractured a rib (slipping washing a bathtub!) and read that walking was good to reduce pain. Since reducing pain was high up on my “to do” list, I started with walking 1 km each morning during the week, before I began my office hours.  I gradually increased it to 2 km. The last week and a half it has been 3 km.

At the beginning of last week, I saw a fellow who was in very good shape using Nordic walking poles, so I asked him why he used them. He explained that as he digs the poles into the dirt on the path and pushes himself off of them, it gives him a good upper body as well as the lower body workout that comes from walking briskly. I decided to get myself some.

I researched what height they needed to be and decided whether I would get adjustable height ones or not, and purchased them on Friday and over the weekend, I read about how to use them properly. It seemed as thought it would be pretty intuitive for me, given that I have (and use) a Nordic Track ski machine when the weather is not conducive to going out to exercise.

Nordic Walking Poles

I was skeptical that using them could actually increase the calories I burned by 30%, for the same distance walked until I tried them this morning.

I am no longer skeptical!

I was very well aware of how much better a workout I had gotten after 2 km, but did another 1 km anyways.  I can’t wait to go again tomorrow.

Getting Even More Serious

Reducing Carbs

A month ago my weight was still ‘stuck’ at its 6 pound weight loss, so I decided to reduce my carbs slightly but consistently and to monitor my intake of nuts and dark chocolate, which could easily cause me to exceed my carb ceiling.

Bingo!

Intermittent Fasting

Monday – Friday I wasn’t hungry in the morning, because I would eat a very satisfying meal the night before (with adequate protein and lots of healthy fats and low carb veggies), so I was and am quite content to have only a coffee and cream for breakfast, and then go for my walk.

When I come home, most days I’m really not hungry, because my body had finally figured out how to burn my own fat stores for energy!

At first when I started exercising (nothing crazy…I was just walking briskly!) and delaying the time between meals, I needed to monitor my blood sugar even more often as it could get quite low in the late afternoon before dinner (+/- 4.0 mmol/L) – at which point I would eat something as I prepared dinner, to raise my blood sugar.

Here is a graph showing my blood glucose since I started walking and intermittent fasting;

Blood glucose since beginning walking and intermittent fasting

Weight Loss

In the last 3 weeks, my weight has dropped another 4 pounds, making it a total weight loss of 10 pounds, in all so far.  I expect as I continue to walk 4 days a week and intermittent fast most weekdays and limit my carbs, that the weight and inches will continue to come off.

I am not suffering in any way!

As a Dietitian, I talk about or write about food all day long and I’m intermittent fasting and feel just fine! I’m not hungry.  As I jokingly posted last week;

“My body has finally figured out how to make glucose from my fat on a low carb high fat diet. I may potentially have found the source of immortality.

Final Thoughts…

I still have at least another 30 pounds to go to get to the “goal weight” that I set at the beginning of this journey, and am now aiming to lose another 40-45 pounds instead in order to reach my ideal (healthiest) waist to height ratio. I clearly won’t accomplish this by mid-November, but if I reach close to my initial goal weight, I will be quite content.

They say a picture speaks a thousand words, so below are two photos. The one on the left, with the blue shirt is me at the beginning of this journey.  The one on the right, with the burgundy shirt is me now. I am starting to see a face I recognize.

Have questions?

Want to know how I can help you reach your own nutrition goals? Please send me a note using the “Contact Us” form above, letting me know how I can help.

To our good health!

Joy

you can follow me at:

 https://twitter.com/lchfRD

  https://www.facebook.com/lchfRD/

Note: I am a “sample-set of 1” – meaning that my results may or may not be like any others who follow a similar lifestyle. If you are considering eating “low carb” and are taking medication to control your blood sugar or blood pressure, please discuss it with your doctor, first.

Copyright ©2017 The LCHF-Dietitian (a division of BetterByDesign Nutrition Ltd.) 

LEGAL NOTICE: The contents of this blog, including text, images and cited statistics as well as all other material contained here (the ”content”) are for information purposes only.  The content is not intended to be a substitute for professional advice, medical diagnosis and/or treatment and is not suitable for self-administration without the knowledge of your physician and regular monitoring by your physician. Do not disregard medical advice and always consult your physician with any questions you may have regarding a medical condition or before implementing anything  you have read or heard in our content.


Insulin and Leptin – very different effects in lean versus overweight people

The hormone insulin (involved in storing fat) and leptin (involved in burning fat) work very differently in lean people than in overweight people. This is why excess fat such as is found in “bullet proof coffee” or “fat bombs” results in overweight (or obese) people that follow a Low Carb High Fat diet gaining weight—whereas lean people will simply burn it off. This article explains the role of these hormones and how they impact lean people and overweight people very differently.

When we eat, the hormone insulin is released which signals our body to do two things; (1) it tells our cells to uptake energy (in the form of glucose) and (2) to store excess energy as fat. Insulin is the major driver of weight gain. If we are lean, when we eat more than usual and increase our body fat stores, the body responds by increasing secretion of a hormone called leptin.  Leptin acts as a negative feedback loop on the hypothalamus area of our brain, reducing our hunger, causing us to eat less and preventing us from gaining too much fat.

The problem occurs when we become insulin resistant.

Insulin Resistance

When we eat a diet that is high in carbs and we eat every few hours (3 meals plus snacks), insulin is released each time we eat (in order to cause our cells to take in energy and store the excess as fat). If we continue to eat this way, over time our body is inundated with insulin, so it sends signals to down-regulate the insulin receptors, making our cells less sensitive to insulin signals. This is called insulin resistance. When we are insulin resistant, our body releases more and more insulin to deal with the same amount of glucose in the blood.

Leptin Resistance

Consistently having high levels of insulin, will also keep stimulating the release of leptin, which normally results in us becoming less hungry and eating less. However, when we are insulin resistant, we keep producing more and more insulin, which results in us producing more and more leptin. Over time, this consistently high leptin level will result in the same type of down-regulation of hormonal receptors that occurred with insulin, resulting in leptin resistance.

Leptin resistance interferes with the negative feed back loop on our hypothalamus which normally reduces our hunger, causing us to eat less. When we are leptin resistance, even when we’ve eaten a great deal of food, we don’t feel satiated — even when our abdomens are straining from feeling full. As a result, we just keep eating, as if there is no “off” switch.

It is this leptin resistance that results in obesity.

Obese people aren’t obese because they lack will-power, but because their body is responding to signals from very powerful hormones produced in response to the types of foods they eat.

Difference between a High Carb Diet and a High Fat Diet

When people consume diets high in carbs it stimulates insulin to be released. In response to all the insulin, energy that is not immediately needed for activity is stored as glycogen in the liver and muscle cells, and the remainder is shipped off to our adipose cells (fat cells), to be stored as fat. When eating a high carb diet, getting excess calories into fat cells is easy, getting the fat out of fat cells, not so much.

When people eat a diet high in fat and low in carbs, the fat is absorbed in the intestines as chylomicrons and is shuttled through the lymphatic system to the thoracic duct, going directly into the blood circulation. From there, the fat is either burned for energy or goes into our fat cells, to be stored. It is important to note that the fat does NOT go to the portal circulation of the liver and as a result, fat needs no help from insulin to be absorbed.

That’s good, but if excess fat gets stored in fat cells, doesn’t eating fat make one fat?

Not for lean people, because lean people are leptin sensitive and obese people are leptin resistant. When overweight or obese people eat excess fat, it is a different matter.

Lean People versus Obese People

If a lean person eats a diet high in fat and low in carbs, the excess fat will be stored in fat cells, but insulin does not go up. So a lean person does not become insulin resistant, as described above.  As their fat mass goes up, leptin also goes up. Since the lean person is sensitive to leptin, the negative feedback loop acts on the brain causing them to stop eating, allowing their body weight to go back down. Even if a lean person deliberately eats more and more fat when they aren’t hungry, what happens is their body’s metabolism goes up, and they burn off the extra calories.

If an overweight or obese person eats a diet high in fat and low in carbs with moderate amounts of protein, insulin levels don’t go up — which is good of course, however from years of eating high carb low fat diets and from eating a carb rich foods every few hours, overweight and obese people are insulin resistant. This means that their blood glucose levels remain high for long periods after they’ve eaten and as importantly, it also means that they are also leptin resistant. In this case, if they eat too much fat – such as drinking “bullet-proof coffee” or having “fat bombs”, they will respond (as the lean person does) by making more leptin, but the problem is, they are not sensitive to leptin! Their brain doesn’t respond to the signals from leptin, so when an obese or overweight person eats excess fat, beyond that which is naturally found in a low carb high fat foods, their appetite doesn’t drop – nor does their metabolism go up to burn off the excess fat being stored in fat cells. They simply get fatter.

Weight Loss

For those that are overweight or obese and insulin resistant, it is important to keep in mind that with insulin resistance comes leptin resistance. Leptin resistance by definition means that the signals to stop eating don’t work.  The “off switch” is defective.  As well, the body doesn’t respond to signals from leptin to up-regulate metabolism, so when an overweight or obese person on a low carb diet eats too much fat, they gain weight.

Since increasing carbs is not an option and increasing protein results in glucose being synthesized from the excess (gluconeogenesis), the way to lower insulin resistance (and thus leptin resistance) is by extending the amount of time between meals.  This is known as intermittent fasting – a topic that will be covered in a future article.

Have questions?

Want to know how I can help you get started on a low carb high healthy fat diet?  Please drop me a note using the “Contact Us” form, located on the tab above.

To our good health!

Joy

you can follow me at:

 https://twitter.com/lchfRD

  https://www.facebook.com/lchfRD/

Copyright ©2017 BetterByDesign Nutrition Ltd.  LEGAL NOTICE: The contents of this blog, including text, images and cited statistics as well as all other material contained here (the ”content”) are for information purposes only.  The content is not intended to be a substitute for professional advice, medical diagnosis and/or treatment and is not suitable for self-administration without regular monitoring by a Registered Dietitian and with the knowledge of your physician. Do not disregard medical advice and always consult your physician with any questions you may have regarding a medical condition or before implementing something you have read in our content. 


References

Ebbeling CB, Swain JF, Feldman HA, et al. Effects of Dietary Composition During Weight Loss Maintenance: A Controlled Feeding Study. JAMA”¯: The journal of the American Medical Association. 2012;307(24):2627-2634. doi:10.1001/jama.2012.6607.

Feinman RD, Fine EJ (2003) Thermodynamics and metabolic advantage of weight loss diets. Metabolic Syndrome and Related Disorders, 1:209-219.

Keto Water – replacing electrolytes

Many people who are accustomed to eating a carb-based diet, restrict their salt intake to avoid blood pressure, but when eating low carb high fat, there is the need to add salt to replace sodium right from the beginning. That is how “keto-water” came to be.

When eating low carb and when intermittent fasting (extending the amount of time between meals) insulin levels fall, and with it so does the kidney’s retention of sodium (salt). The kidneys excrete sodium in a process called naturesis so replacing the missing sodium is important. Sodium and potassium (as well as calcium and magnesium) are used in pairs in a number of systems in the body, so when the kidneys ‘dump’ a lot of sodium, potassium is soon excreted too, in order to balance the two electrolytes. If someone on a low carb diet doesn’t supplement sodium soon enough, their potassium levels could fall too low as a result, which may cause them to have excruciating headaches and/or irregular heart beat (heart palpitations).

It is fairly difficult to meet the Dietary Reference Intake for potassium on a conventional  carb-based diet, but on a low-carb diet – even with a very high non-starchy vegetable intake, it is still challenging as many of the good sources of potassium, such as potato and yams are not part of a low carb high fat diet. Mushrooms and avocado are some of the best sources, so include those foods often.

To be sure to get sufficient sodium and potassium, I make what I call ”keto-water”.

NOTE: People with kidney disease (e.g. CKD) must avoid any salt substitutes or half-salts with potassium. Those taking blood pressure medication such as Ramipril have increased potassium retention and should also not use half-salts containing potassium.

”KETO-WATER”

Keto-water is 1 liter of club soda / seltzer to which 1/8 tsp of “half salt” has been added.

“Half salt” is a half-sodium / half-potassium salt that is sold under a number of brand names, including “Nu Salt” and “no Salt”.

I add a tiny twist of lime or lemon to round out the taste and also to add a source of Vitamin C and voila, ”keto-water”!

Keto-water salts

Unless it is particularly hot out, or one’s needs are increased because they are exercising or have a fever, two liters a day of ”keto-water” is probably sufficient for most people.

Keep in mind that drinking keto-water will result in your body retaining more water along with the sodium, so it may appear as if your ‘weight went up’, but it is only the natural water retention that occurs (and is supposed to occur) when your body has sufficient electrolytes. Remember, weight form most people can fluctuate by as much as 4 – 4 1/2 pounds per day solely from the natural fluctuation in body water, so don’t weigh yourself too much.  I recommend a maximum of once a week, on the same day and at the same time.  When you are replacing the body’s necessary electrolytes (such as sodium and potassium), it is better to judge fat loss by loss of inches around various parts of your body (mid-arm, mid-thigh, neck, abdomen) than by the scale. Even easier, go by how your clothes feel!

Please don’t restrict sodium when eating low-carb for the sake of a number on the scale!  Your body needs the sodium and potassium to function properly.

You can follow me at:

 https://twitter.com/lchfRD

  https://www.facebook.com/lchfRD/


Copyright ©2017 The Low Carb High Fat Dietitian (a divisions of BetterByDesign Nutrition Ltd.) 

LEGAL NOTICE: The contents of this blog, including text, images and cited statistics as well as all other material contained here (the ”content”) are for information purposes only.  The content is not intended to be a substitute for professional advice, medical diagnosis and/or treatment and is not suitable for self-administration without regular monitoring by a Registered Dietitian and with the knowledge of your physician. Do not disregard medical advice and always consult your physician with any questions you may have regarding a medical condition or before implementing something you have read or heard in our content. 


A Dietitian’s Journey – how I got my weight moving again

INTRO: After a seeming endless 6 week plateau with my weight barely budging, I decided to do some serious intermittent fasting and lower my carbs and bingo – my weight is dropping nicely!  Not only that, my fasting blood sugar is the best it has been since I was diagnosed as Diabetic ~10 years ago. Here’s an update.

Yesterday was my third day of intermittent fasting (IF) this week – where I didn’t eat anything after supper at night, until supper the next day.  This is my second week of doing intermittent fasting Monday to Friday and eating a regular, low carb high healthy fat supper at night.

Here’s an example of what I ate on one night, to give you an idea.  It was some Thai chicken thighs that had been marinated in coconut milk, red curry paste and curry and grilled on the barbecue, along with a huge mixed green salad, with some shaved Parmesan, raspberries, pepitas (pumpkin seeds) and homemade raspberry vinaigrette (great thing to do with over ripe berries!) that was made with Dijon mustard, wine vinegar and extra virgin olive oil. To start with, I also ate about a cup of snap peas with ~ 1  1/2 Tbsp of taramasalata (Greek carp roe spread) that didn’t have any of the usual bread in the recipe.

Keeping in mind that I am only a “sample set of 1”, here are my results;

Last week, which was my first week of regular IF, my fasting blood sugar, which had been stuck at the high to mid- 6 mmol/L (117 mg/dL) range for weeks, dropped to the mid- 5 mmol/L range (~99 mg/dL) for several days in row.


Yesterday, which was my third day of IF this week, my blood sugar just before dinner was the lowest it has been since I was diagnosed as Type 2 Diabetic ~10 years ago.

While I felt totally fine and had been working a full clinical day, I knew it was time to eat something!  I ate about 10 salted almonds and went about preparing dinner.

Blood glucose values from June 22nd until June 29th, inclusive

I should add, that last week I also started walking daily ~ 2-3 km (1  1/4 -2 miles) around a local man-made lake (I posted a video below, so you can see it).  The first two days I could only go once around, as I had fractured a rib last Friday and it was still quite painful.  I starting walking daily because it was supposed to be good to alleviate the muscle pain accompanying my injury and I found it helped a lot, so I kept doing it each morning.  Then I realized how great it felt to be walking in such a beautiful place, so now it has become a morning routine.

My blood pressure is doing amazing now.

It had stalled between Stage 1 hypertension and pre-hypertension for about a month, but when it creeped back up to Stage 2 hypertension for two days in a row, I decided to go see my doctor and get prescription for a ‘baby-dose’ of Ramipril (2.5 mg).


There is a strong family risk of heart attack and stroke, and a blood pressure that hit 160/90 was not something to fool around with.

I plan to staying on the meds until I lose another 20 pounds, or until my blood pressure becomes too low – whichever comes first.

Look at my blood pressure now.

The only day that was high (Stage 1) was last Friday, before I started on the lowest dose of Ramipril.

The rest of the time I am in pre-hypertension and one day was totally normal! I am looking forward to seeing the continued dietary changes, bring it down even further.

As I planned to do 3 months after I started eating low carb, I have a requisition for blood work and an appointment for mid-July to have that done.  I will be getting my HbA1C checked and my cholesterol, along with some liver and kidney function tests as well as electrolytes (important on this hypertensive medication).

One of the other dietary changes that I made, besides the intermittent fasting, was that I cut my carbs considerably. I was not doing well on 50 gm of carb per day, my weight loss had been stalled, my blood pressure as well and it had been a month of no significant progress, even though I was in low stage ketosis. I cut my carbs down to 35 gms per day (sometimes a little less), but making sure to have lots of non-starchy vegetables and protein and of course, plenty of healthy fats in the form of olive oil, coconut milk and nuts.

In short, I feel amazing.

The weight is dropping, the inches are dropping, my blood sugar is approaching more normal values and my blood pressure is being kept in check, while I continue this process of eating low carb high healthy fat and daily walks. I’m not hungry during the day even though I am not eating, because my body is happily accessing my own fat stores for energy. I think the limiting factor at this point is that my body is not quite used to synthesizing the enzymes needed for it to make glucose from my stored fat (a process called gluconeogenesis), so I will be monitoring my blood sugar closely, to make sure it doesn’t get too low.

I want to encourage you, that if your weight is staying stable for longer than you’d like, I’ve posted some things on the blog that would be helpful (located under the Food For Thought tab). One article is on tracking carbs, and the next one is on where calories factor in.

If your weight has plateaued, and you’ve been eating low carb high fat and your not losing weight as you’d like to, these two articles should help.

If you’d like to learn more about how I can help you accomplish your own weight loss or insulin-resistance lowering goals, please send me a note using the “Contact Us” form above.

Keep in mind that for the month of July only, I am offering a substantial savings on taking both an assessment package and a weight management package, so please visit the front page to find out more about the Canada Day special.

To our good health!

Joy

If you would like to read well-researched, credible ”Science Made Simple”  articles on the use of a low carb or ketogenic diet for weight loss, as well as to significantly improve and even reverse the symptoms of Type 2 Diabetes, high cholesterol and other metabolic-related symptoms, please  click here.

you can follow me at:

 https://twitter.com/lchfRD

  https://www.facebook.com/lchfRD/

Note: I am a "sample-set of 1" - meaning that my results may or may not be like any others who follow a similar lifestyle. If you are considering eating "low carb" and are taking medication to control your blood sugar or blood pressure, please discuss it with your doctor, first.

Copyright ©2017 The Low Carb High Fat Dietitian (a division of BetterByDesign Nutrition Ltd).  LEGAL NOTICE: The contents of this blog, including text, images and cited statistics as well as all other material contained here (the ”content”) are for information purposes only.  The content is not intended to be a substitute for professional advice, medical diagnosis and/or treatment and is not suitable for self-administration without regular monitoring by a Registered Dietitian and with the knowledge of your physician. Do not disregard medical advice and always consult your physician with any questions you may have regarding a medical condition or before implementing something you have read in our content. 


follow me at:

 https://twitter.com/joykiddieRD

  https://www.facebook.com/lchfRD/


Tracking Carbs Instead of Counting Calories

I have found that people wanting to lose weight simply don’t want to weigh or measure food or count calories – and who can blame them! I design Meal Plans for my clients so they don’t need to. As I will explain in this article, with a Standard Meal Plan (based on a traditional macronutrient distribution), carbohydrate, protein and fat are all laid out, based on the food exchanges. With a Low Carb High Healthy Fat Meal Plan or a Hybrid Meal Plan, carbohydrate percent, protein- and fat percent are also laid out, but for those seeking to lower insulin resistance or lose weight or both, tracking carb intake is important.  In this article, I’ll explain tracking carbs.

Firstly, what is a Meal Plan?

A Meal Plan isn’t a “menu” that tells you what foods you have to eat, but indicates how many servings of each category of food you should aim to eat at each meal. I explain more about what a food category is, below.

The first step in designing a person’s Meal Plan after I’ve done their assessment, is to determine their overall caloric needs based on age, gender, activity level, desired weight loss (or gain), as well as any special considerations such as growth, weight loss, pregnancy or lactation, etc.

More about calories in the next article, but suffice to say here, calories are generally not the focus in Low Carb High Healthy Fat eating, carbs are.

The next step is to set the macronutrient distribution (% of calories from carbohydrate, protein and fat) of the Meal Plan according to what would best suit the person’s clinical needs, goals and lifestyle. This is something I discuss with people during the assessment, and which is ultimately up to them.  The Standard macronutrient distribution is ~45-65% carbohydrate, ~15-20% protein and ~30% fat. Generally speaking, unless there is a compelling clinical reason for using a Standard Meal Plan, I encourage people to consider the benefits of a low carb high healthy fat eating.

The Low Carb High Healthy Fat macronutrient distribution is ~5-10% carbohydrate, ~20% protein and ~65-70% healthy fat, with the Hybrid macronutrient distribution falling somewhere in between.

In the final step, I design a person’s Meal Plan based on the foods that they’ve told me they like, avoiding those they don’t, and factoring in the time of day they either need to (for scheduling reasons) or prefer to eat. Then we meet for me to go over their Meal Plan with them, and for me to teach them how to easily and accurately estimate their portion sizes, using visual measures. More on visual measures, below.

The only thing left for them to decide is what they want to eat!

Food Categories – Standard Meal Plan

In a Standard Meal Plan or Hybrid, categories include Starchy Vegetables and Grains, Fruit, Non-Starchy Vegetables, Meat, Poultry, Meat and Egg or Cheese, and Legumes (pulses). These categories are based on how many grams of carbs are contained in the foods in make up that category.

Take, for example, the Starchy Vegetable and Grain Category.  This group includes all the standard “carbs” such as bread, pasta, rice and cereals as well as “starchy vegetables” such as peas, corn, potatoes, sweet potatoes / yams and winter squash (such as acorn or butternut squash). All foods in this category have 15 gm of carbs per serving (where a serving is 1/2 cup or the equivalent of 1 slice of bread).

So, 1 slice of bread has 15 gms of carb, 1/2 cup of peas has 15 gms of carb, 1/2 cup of rice has 15 gms of carb, 1/2 cup of oatmeal has 15 gms of carb, and 1/2 a hamburger bun has 15 gms of carb.

If a person’s Meal Plan indicates that they can have 2 servings from the Starchy Vegetable and Grain category, that could be 2 pieces of toast, or 1 cup of oatmeal, or 1 cup rice, etc. Their Meal Plan doesn’t tell them what food they have to eat, just how much from each category.

Here is an example of what a Standard Meal Plan looks like;


As you can see, all the calculations have been done.

In this example, this Meal Plan was for an 85 year old man who wanted to gain weight and was based on 45% of his calories coming from carbs, 21% from fat and 34% from fat.

Estimating Portion Sizes

When I’ve taught someone to accurately estimate their serving sizes using visual measures, the amount of macronutrients (carbs, protein, fat and calories) they will take in following their Meal Plan will be what was planned.

What are Visual Measures?

Visual measures are easy and accurate means to estimate serving sizes. For in-person clients, this might be based on the size of their hand or fingers, such as (depending on the size of a person’s hand) a 1/2 a cup (dry measure) may be the amount of something round (like frozen peas) that could be contained in their scooped hand, without rolling out. An ounce (by weight) might be the size of two specific fingers on their hand, or a Tbsp may be the amount of the last digit on their thumb. For Distance Consultation clients, the standard used in teaching visual measures are standard size items, such as the size of a golf ball or four dice stacked up.

Tracking Carbohydrates

Where tracking carbohydrates comes into play is with Low Carb High Healthy Fat Meal Plan or a Hybrid Meal Plan – especially when lowering insulin levels or losing weight is desired. Keeping track of carbohydrates on these kind of Meal Plans is nothing like needing to count calories! It is very easy.

On a Low Carb High Healthy Fat Meal Plans, the macronutrient distribution for carbs is set quite tightly. For men, total carbs would be somewhere between 80-100 grams and for women, it may be set as low as 35 gms carb or as high as 50 gms. It depends on their needs. Naturally, Hybrid Meal Plans will have higher total daily carbs.

Since there are no Starchy Vegetables and Grains and Milk on these Meal Plans (cheese is used, just not milk due to the carb content), the Food Categories on a Low Carb Meal Plan or Hybrid are different than on a Standard (or traditional) Meal Plan).

Food Categories in a Low Carb Meal Plan include Non-Starchy Vegetables, which exclude “Starchy Vegetables” such as peas, corn, potatoes, sweet potatoes / yams and winter squash – with some intake guidelines around root vegetables such as carrots, beets and parsnips. The Fruit category here is specified more narrowly than in a Standard Meal Plan – generally focused on berries and low sugar citrus such as lime and lemon, as well as tomatoes and cucumbers (yes, both are technically ‘fruit’).

Meat, Poultry, Meat and Egg or Cheese is pretty much the same as with a Standard Meal Plan, with an ounce of any of these protein foods being 1 serving and individuals being able to have several servings at each meal (based on their caloric needs, factoring in any weight loss). The fat contained in the Meat, Poultry, Meat and Egg or Cheese is already calculated when the Meal Plan is made, so “Fat” here means added fat. The Fat category includes everything from olive oil, avocado (both the fruit and the oil), coconut oil, butter, olives and nuts and seeds.

Foods in the Meat, Poultry, Meat and Egg or Cheese category have little or no carbs in them and Non-Starchy Vegetables are generally around 5 gm of carb per cup and berries, which are in the Fruit category are roughly 15 gm of carb for 1/2 a cup. A few berries on a salad isn’t usually a problem, but more than that can easily put us over our maximum amount of carbs for the day, which I call the “carb ceiling”.

Where it becomes particularly important to track carbohydrates when one is seeking weight loss is with foods such as nuts and seeds.  It is very easy to eat a handful of nuts and end up exceeding one’s daily maximum number of carbs.

[an article written a month earlier will provide detailed information regarding the carbohydrate content of nuts: https://www.lchf-rd.com/2017/05/23/oh-nuts/]

Carb Creep

“Carb-creep” is when we eat more carbs than we think we are, which results in weight loss slowing, or even stopping. When one reaches a plateau  where they haven’t lost any weight for longer than a week or two, then tracking carbs to see if there is carb creep is advised.

A man’s carb limit may be set to 80-100 gms per day and a woman’s may be as low as 35 gms or as high as 50 gms.  That is not a lot and it is easy to inadvertently exceed this amount of carbs in the course of a day. A few splashes of milk in several cups of coffee, a handful of peanuts walking by the bowl near the photocopier and an ounce or two of 72% dark chocolate (for heart health, of course!) can quickly put us over our carb ceiling. This is where it’s important to evaluate food choices that may be putting your over your carb ceiling.

Want to know more about having a Meal Plan designed for you?

Please send me a note using the “Contact Us” form above and I will reply to you, usually by the next business day.

To our good health!

Joy

you can follow me at:

 https://twitter.com/lchfRD

  https://www.facebook.com/lchfRD/

Copyright ©2017 The Low Carb High Fat Dietitian (a division of BetterByDesign Nutrition Ltd).  LEGAL NOTICE: The contents of this blog, including text, images and cited statistics as well as all other material contained here (the ”content”) are for information purposes only.  The content is not intended to be a substitute for professional advice, medical diagnosis and/or treatment and is not suitable for self-administration without regular monitoring by a Registered Dietitian and with the knowledge of your physician. Do not disregard medical advice and always consult your physician with any questions you may have regarding a medical condition or before implementing something you have read in our content. 


 https://twitter.com/joykiddieRD

  https://www.facebook.com/lchfRD/


A Dietitian’s Journey – a few thoughts on “exercise”

There are two words that I’ve noticed aren’t talked about much in low carb high fat (LCHF) circles; one is “calories” and the other is “exercise”. I think that’s because both have been tied to the old “calories in, calories out” model.

I think it’s important to reframe both of these within a LCHF context, because both have a role to play in us being successful in improving health as well as losing weight, even though the reasons for that are very different than in the “calories in, calories out” model.

In the traditional high carb, low fat paradigm, restricting calories and increasing exercise are seen as the foundation of weight loss – based on the assumption that “calories out” is only the calories we burn in activity.  As explained in this week’s blog on “Do Calories Matter When Eating Low Carb”, there are other demands on the energy we take it (calories) that are higher priority than exercise, such as regulating our body temperature and providing energy to keep our heart pumping.

(You can read about that here: https://www.lchf-rd.com/2017/06/19/do-calories-matter-when-eating-low-carb/)

In the low carb, high fat model, overall calories need to be understood within a diet that is 70% fat and <10% carbohydrate and exercise needs to be understood within the context of lowering stress levels (i.e. cortisol), as well as increasing metabolic rate so that fat stores continue to be burned long after activity ends.

Below is a very short video from my morning walk, with a few thoughts on “exercise”.

To our health!

Joy

you can follow me at:

 https://twitter.com/lchfRD

  https://www.facebook.com/lchfRD/

Copyright ©2017 BetterByDesign Nutrition Ltd.  LEGAL NOTICE: The contents of this blog, including text, images and cited statistics as well as all other material contained here (the ”content”) are for information purposes only.  The content is not intended to be a substitute for professional advice, medical diagnosis and/or treatment and is not suitable for self-administration without regular monitoring by a Registered Dietitian and with the knowledge of your physician. Do not disregard medical advice and always consult your physician with any questions you may have regarding a medical condition or before implementing something you have read or heard in our content. 

One in Two People Will Get Cancer – new report finds

A new report released by the Canadian Cancer Society predicts that almost one in two Canadians will be diagnosed with cancer in their lifetime.

“One half” is a very sobering number!

Currently, cancer is the leading cause of death in Canada, accounting for almost 1/3 of all  of all deaths (30%).

Heart disease is the second leading cause of death, accounting for 1/5 of all deaths (20%).

In an interview with Peter Goffin of the Toronto Star, Dr. Robert Nuttall, Assistant Director of Health Policy at the Canadian Cancer Society attributed this alarming new statistic that 1/2 will get cancer in their lifetime to the “aging population” – not “lifestyle factors”. 

Nutall said;

”The important thing to remember here is that the biggest driver behind this is the aging population. ”Canadians continue to live longer, and cancer is primarily a disease that affects older Canadians.”

Japan has the oldest population in the world, with ~1/3 of people aged over 60.

What do their statistics show?

According to the Institute for Health Metrics and Evaluation, Japan’s leading causes of death (2015) were:

  1. cerebrovascular disease (stroke)
  2. cardiovascular disease (heart disease)
  3. lower respiratory infection
  4. Alzheimer’s disease

Lung cancer was 5th, followed by stomach cancer (6th) and colorectal cancer (7th). In Japan, a country with the oldest population in the world, cancer of any kind wasn’t even in the top four!

Are half of us really going to get cancer because of the “aging population” or is it because of “lifestyle factors”?

Looking at the top 4 Causes of Cancer in Canada:

Ten Most Common Cancers in Canada – projected for 2017
  1. Lung cancer is the number one form of cancer and the Canadian Cancer Society indicates that more than 85% of lung cancer cases in Canada are related to smoking tobacco.

  2. Colorectal cancer is the second leading cause of cancer and the Canadian Cancer Society indicates that risk factors for colorectal cancer include (a) diet , (b) being overweight, (c) physical inactivity and (d) smoking.

  3. Breast cancer (in both men and women) is the third leading cause of cancer. Apart for personal and family history of breast cancer and other genetic factors, the Canadian Cancer Society list the following known risk factors: (a) exposure to ionizing radiation, (b) use of oral contraceptives (c) alcohol and (d) being obese.

  4. Prostrate cancer which only affects men, is the fourth leading cause of cancer and the only known risk according to the Canadian Cancer Society is family history.

Major Risk Factors for the top 4 Causes of Cancer

Here are the major risk factors for the top four leading causes of cancer in Canada;

  1. smoking
  2. diet
  3. being overweight
  4. physical inactivity
  5. exposure to ionizing radiation (x-rays)
  6. use of oral contraceptives
  7. alcohol

Except for use of x-rays, all of these are lifestyle factors!

Diet, being overweight and being inactive are three things that can be changed easily and sustainably!

A low carb approach can be particularly helpful, as it can not only address being overweight, but new studies have found that a number of cancer cells feed exclusively on glucose.  It is thought that a ketogenic lifestyle may play a role in reducing the glucose available for some types of cancer.

We being told that the biggest driver behind the projection that half of us will get cancer in our lifetime is the aging population‘ – when it would seem that the underlying risk factors of these cancers are lifestyle factors.

In fact, the Canadian Cancer Society says themselves that half of the cases are preventable;

“We already know a lot about how to prevent cancer. If we, as a society, put everything we know into practice through healthy lifestyle choices and policies that protect the public, we could prevent about half of all cancers.”

We will all age and this is not preventable, but by addressing lifestyle factors including smoking, diet, overweight and physical inactivity and others, we should be able to prevent almost 1/2 of all cancers.

Have questions on how I can teach you how to eat healthier and work with you to help you tackle being overweight and inactive, then please send me a note using the “Contact Us” form on this web page.

To your good health!

Joy

you can follow me at:

 https://twitter.com/lchfRD

  https://www.facebook.com/lchfRD/

Copyright ©2017 The Low Carb High Fat Dietitian (a division of BetterByDesign Nutrition Ltd).  LEGAL NOTICE: The contents of this blog, including text, images and cited statistics as well as all other material contained here (the ”content”) are for information purposes only.  The content is not intended to be a substitute for professional advice, medical diagnosis and/or treatment and is not suitable for self-administration without regular monitoring by a Registered Dietitian and with the knowledge of your physician. Do not disregard medical advice and always consult your physician with any questions you may have regarding a medical condition or before implementing something you have read in our content. 


References

Canadian Cancer Society, http://www.cancer.ca/en/cancer-information/cancer-type/lung/risks/?region=on#ixzz4kZ5AnNz6

Canadian Cancer Society, http://www.cancer.ca/en/about-us/for-media/media-releases/ontario/2011/not-enough-canadians-being-screened-for-colorectal-cancer-leading-to-many-unnecessary-deaths/?region=on#ixzz4kZ5vSGSS

Canadian Cancer Society, http://www.cancer.ca/en/cancer-information/cancer-type/breast/risks/?region=on#ixzz4kZ8RvXbm

Canadian Cancer Society, http://www.cancer.ca/en/cancer-information/cancer-type/prostate/risks/?region=on#ixzz4kZ9J6o64

Canadian Cancer Society, http://www.cancer.ca/en/cancer-information/cancer-101/cancer-research/prevention/?region=on#ixzz4kZ9jQJwt

Institute for Health Metrics and Evaluation, http://www.healthdata.org/japan

The Toronto Star, Peter Goffin (Staff Reporter), Tue June 20 2017, https://www.thestar.com/news/gta/2017/06/20/half-of-all-canadians-will-get-cancer-in-their-lifetime.html

New Obesity Study Sheds Light on Dietary Recommendations

As mentioned in the previous article, a new study published Monday, June 12, 2017 in the New England Journal of Medicine analyzed data from 68.5 million adults and children in 195 countries and found that 1/3 of people worldwide are overweight or obese and are at increased risk of chronic disease and death, as a result.

Data from one country, China, stood out among all of them due to record high rates of childhood and adult obesity;

  • In 2015, China had the highest incidence of obese children in the world (~10%) along with India.
  • In 2015, China along with the US had the highest incidence of obese adults (>35%).

I wanted to have a look at the Dietary Guidelines for Chinese Residents (Chinese: 中国居民膳食指南) in the years prior to 2015, to determine how they may have contributed to these high rates of overweight and obesity.

The Food Guide Pagoda

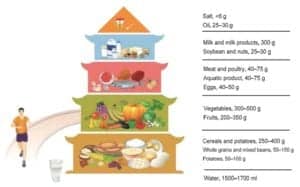
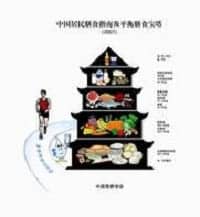
The Chinese Dietary Guidelines, known as the ‘Food Guide Pagoda’ was first published in 1989 and revised in 1997. The 2007 revision was developed in conjunction with a committee from the  Chinese Nutrition Society, in association with the Ministry of Health.  A new revision came out in 2016.

The 2007 Food Guide Pagoda’ (the one that was in effect at the time the 2015 overweight and obesity statistics came out) was divided into five levels of recommended consumption corresponding to the five Chinese food groups.

  1. Cereals – in the form of rice, corn, bread, noodles, crackers and tubers make up the base of the Pagoda.
  2. Vegetables and Fruits – form the second level of the Pagoda
    According to the Chinese Dietary Recommendations, the majority of foods in each meal should be made up of cereals, including rice, corn, bread, noodles, crackers and tubers (such as potatoes), followed by Vegetables and Fruit.
  3. Meat, Poultry, Fish & Seafood and Eggs form the third level, and it is recommended that should be ‘eaten regularly’, but ‘in small quantities’.
  4. Milk & Dairy and Bean & Bean Products – form the fourth level.
  5. Fat, Oil and Salt – form the roof of the Pagoda and are recommended to be eaten in moderation.

Specific Dietary Recommendations (2007-2015)

The main recommendations of the 2007 Chinese Dietary Guidelines were as follows:

  • Eat a variety of foods, mainly cereals, including appropriate amounts of whole grains.
  • Consume plenty of vegetables, fruits and tubers (e.g. potato, taro, yam etc.)
  • Consume milk, beans, or dairy or soybean products every day
  • Consume appropriate amounts of fish, poultry, eggs and lean meat.
  • Reduce the amount of cooking oil
  • Divide the daily food intake among the three meals and choose suitable snacks.

The Results (2005-2015)

1. Leading cause of death

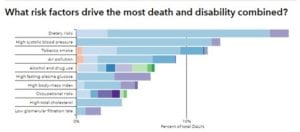
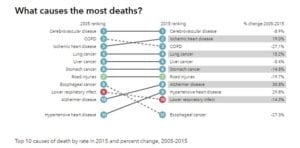
In 2015, heart disease overtook Chronic Obstructive Pulmonary Disease (COPD) as the second leading cause of death, followed by stroke.

In 1990, the leading cause of death in China was Chronic Obstructive Pulmonary Disease (COPD) largely contributed to by smoking, followed by heart disease and diarrhea.


2. Leading cause of premature death

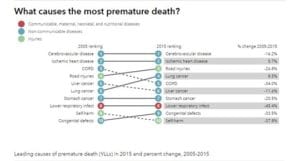
In 2015 as in 2005, stroke was the leading cause of death, followed by heart disease.


3. What caused the most death and disability combined?

In 2015, stroke was leading cause of death in China, followed by heart disease.


Magnitude of the Problem – China compared to the US and Canada

In 2015, for every 100,000 people in China, 2,237 people died from heart disease and 1,672 people died from stroke.

In the US, for every 100,000 people, 457 people died from heart disease and 1,617 died from stroke.

In Canada, for every 100,000 people, 327 people died from heart disease and 1,106 died from stroke.

Rates of stroke in the China and US were quite similar. Both China and the US had the highest number of obese adults (>35%) in the world.

China’s “solution”?

China concluded that “dietary risks drive the most death and disability” – especially stroke and heart disease which were the two leading causes of all forms of death, of premature death and of disability in 2015.

In response to these high rates of stroke and heart disease among Chinese, the Chinese government, with the assistance of the Chinese Nutrition Society produced a revised version of the Chinese Food Pagoda in 2016.

New Dietary Recommendations (2016)

The Chinese have stated that “there have been no significant changes in dietary recommendations” (Wang et al, 2016) when compared with the previous version of the 2007 Food Pagoda and are emphasizing the following recommendations:

Eat a variety of foods, with cereals as the staple – The daily amount of cereals and potatoes consumed for body energy production should be 250—400 g, including 50—150 g of whole grains and mixed beans, and 50—100 g of potatoes. The major characteristic of a balance diet pattern is to eat a variety of foods with cereals as the staple.

Balance eating and exercise to maintain a healthy body weight – this is based on the same “calorie in / calorie out” model that the US and Canadian recommendations have been based on. “Avoiding ingesting excessive food and physical inactivity is the best way to maintain energy balance”.

Consume plenty of vegetables, milk, and soybeans – The daily vegetable intake should be in the range of 300—500 g. Dark vegetables, including spinach, tomato, purple cabbage, pak choy, broccoli, and eggplant, should account for half this amount and should appear in every meal. Fruits should be consumed every day. The daily intake of fresh fruits, excluding fruit juice, should be between 200 and 350 g. A variety of dairy products, equivalent to 300 g of liquid milk, should be consumed per day. Bean products and nuts should be frequently eaten in an appropriate amount for energy and essential oils.

Consume an appropriate amount of fish, poultry, eggs, and lean meat – The consumption of fish, poultry, eggs, and meat should be in moderation. The appropriate weekly intake is set at 280—525 g of fish, 280—525 g of poultry, and 280—350 g of eggs with an accumulated daily intake of 120—200 g on average. Fish and poultry should be chosen preferentially. The yolk should not be discarded when consuming eggs, and less fat and fewer smoked and cured meat products should be eaten.

Final Thoughts…

China now has some of the highest rates of childhood obesity in the world (~10%) and is tied with the US for the highest rate of adult obesity (>35%) yet to address the issue of incredibly high rates of stroke and high rates of heart disease, the 2016 Chinese Dietary Recommendations define a balance diet pattern as a daily adult intake of;

1/2 lb – 1 lb (250-400 gm ) of cereals, grains and potatoes

1/3- 3/4 lb (200 – 350 gm) of fresh fruit

1 1/2 cups of milk

and

1/4 lb – 1/3 lb of fish, poultry or eggs (with meat “in moderation”)

These “new” recommendations seem to be based on the same “calorie in / calorie out” model familiar to us in the West and that fail to take into account how the body compensates on a carbohydrate-based calorie restricted diet diet (see previous blogs).

The Chinese are being told that “the best way to maintain energy balance” (Wang et al, 2016) is to;

  1. exercise more (150 minutes/week plus 6000 steps/day)
  2. eat less fat and animal protein
    and
  3. consume most of their calories as rice, corn, bread, noodles, crackers and potatoes 

Over the last four decades,  Americans and Canadians have reduced their fat consumption from ~40% in the 1970’s to ~30%, increased the amount of carbohydrate as whole grains, fruits and vegetables, are consuming low fat milk, eating more fish and drinking less pop and presently, 2/3 of adults considered overweight or obese.

Should we expect different results in China?

If you are looking to achieve a healthy body weight, lower blood sugar, blood pressure and triglycerides, I can help.

I take a low carb high health fat approach and can teach you how to eat well, without weighing or measuring food, or counting “points”.

Want to know more? Send me a note using the “Contact Us” form, on the tab above.

To our health!

Joy

you can follow me at:

 https://twitter.com/lchfRD

  https://www.facebook.com/lchfRD/

Copyright ©2017 The Low Carb High Fat Dietitian (a division of BetterByDesign Nutrition Ltd).  LEGAL NOTICE: The contents of this blog, including text, images and cited statistics as well as all other material contained here (the ”content”) are for information purposes only.  The content is not intended to be a substitute for professional advice, medical diagnosis and/or treatment and is not suitable for self-administration without regular monitoring by a Registered Dietitian and with the knowledge of your physician. Do not disregard medical advice and always consult your physician with any questions you may have regarding a medical condition or before implementing something you have read in our content. 


You can follow me at:

 https://twitter.com/joykiddieRD

  https://www.facebook.com/lchfRD/


References

Global Burden of Disease (GBD) 2015 Obesity Collaborators, Health Effects of Overweight and Obesity in 195 Countries over 25 Years, N Engl J Med, DOI: 10.1056/NEJMoa1614362

Global Health Data Exchange (GHDx), http://ghdx.healthdata.org/geography/china

Wang S, Lay S, Yu H, Shen S. Dietary Guidelines for Chinese Residents (2016): comments and comparisons. Journal of Zhejiang University Science B. 2016;17(9):649-656. doi:10.1631/jzus.B1600341.


Obesity Pandemic – new study

In the last few years, we’ve heard the term “obesity epidemic“, but a new study published this past Monday, June 12, 2017 in the New England Journal of Medicine seems to indicate that it is now an “obesity pandemic”.

Researchers analyzed data from 68.5 million adults and children in 195 countries to assess (1) the prevalence of overweight and obesity in 2015 and (2) the trends in the prevalence of overweight and obesity between 1980 and 2015.

The “short story” is that a 1/3 of people worldwide are now overweight or obeseput another way, two billion people globally are overweight or obese and are at increased risk of morbidity (chronic diseases) and morbidity (death), as a result.

The Significance

Epidemiological studies (studies of different populations from around the world) have identified high BMI as a risk factor for cardiovascular disease, type 2 Diabetes, hypertension, chronic kidney disease and many types of cancer.

Furthermore, overweight children are at higher risk for the early onset of diseases such as type 2 Diabetes, hypertension and chronic kidney disease.

Body Mass Index (BMI) is the weight in kilograms divided by the square of the height in meters Obesity is defined as having a Body Mass Index (BMI) > 30 kg/(m)2 Overweight is defined as having a BMI between 25 and 29.9 kg/(m)2

Obesity Findings

Data showed that in 2015, there were 603.7 million obese adults worldwide and 107.7 million obese children.

The prevalence of obesity has more than doubled in 70 countries since 1980, and there has been a tripling of obesity in youth and young adults in developing, middle class countries such as China, Brazil, and Indonesia.

Worldwide, the prevalence of obesity is now 5% in children and 12% in adults — findings that mirror global trends in type 2 Diabetes.

Most alarming was that in 2015;

  • high BMI accounted for four million deaths globally
  • almost 40% of deaths resulting from high BMI occurred in people who were overweight, but not obese
  • more than 2/3 of deaths related to high BMI were due to cardiovascular disease

Varying Risk

It is important to note that risk of outcomes related to obesity has not been found to be uniform across populations. For example, it has been reported that at any given level of BMI, Asians have been shown to have a higher absolute risk of Diabetes and hypertension, whereas African Americans have a lower risk of cardiovascular disease than other groups.

Addressing the Problem

To address the problem of overweight and obesity both here and around the world, requires correctly identifying its cause and for the last 40 years, excess dietary fat — especially saturated fat has been blamed as the villain and ostensibly responsible for the “obesity epidemic” and resulting “diabetes epidemic”.

But is it?

When one compares the Dietary Recommendations in both Canada and the United States since 1977 to rates of overweight and obesity in both of these countries, it seems apparent that it has been the promotion of diets high in carbohydrate that lies at the root.

In the next article, I’ll take a look at the Dietary Recommendations of the country with the highest rate of childhood obesity and adult obesity in 2015, as well as some of the highest rates of stroke and heart disease per capita, in the world.

How I can help

If you have eaten a ‘low fat diet’ and counted calories (or points) until you are blue in the face and are tired of doing the same thing over and over again, expecting a different outcome, why not drop me a note using the “Contact Us” form, above. I’d be glad to explain how I can help you achieve a healthy body weight, while normalizing your blood sugar, blood pressure and cholesterol levels.

To your health!

Joy

you can follow me at:

 https://twitter.com/lchfRD

  https://www.facebook.com/lchfRD/

Copyright ©2017 The Low Carb High Fat Dietitian ( a division of BetterByDesign Nutrition Ltd).  LEGAL NOTICE: The contents of this blog, including text, images and cited statistics as well as all other material contained here (the ”content”) are for information purposes only.  The content is not intended to be a substitute for professional advice, medical diagnosis and/or treatment and is not suitable for self-administration without regular monitoring by a Registered Dietitian and with the knowledge of your physician. Do not disregard medical advice and always consult your physician with any questions you may have regarding a medical condition or before implementing something you have read in our content. 


you can follow me at:

 https://twitter.com/joykiddieRD

  https://www.facebook.com/lchfRD/


References

Global Burden of Disease (GBD) 2015 Obesity Collaborators, Health Effects of Overweight and Obesity in 195 Countries over 25 Years, N Engl J Med, DOI: 10.1056/NEJMoa1614362

Gregg EW, Shaw JE, Global Health Effects of Overweight and Obesity, N Engl J Med, doi: 10.1056/NEJMe1706095

Karter AJ, Schillinger D, Adams AS, et al. Elevated rates of diabetes in Pacific Islanders and Asian subgroups: the Diabetes Study of Northern California (DISTANCE). Diabetes Care 2013; 36:574-9

A Dietitian’s Journey – 3 month update

Today marks 3 months since I started my own weight-loss and getting-healthy journey and so I’m posting this short update.

While I’ve only lost 7 pounds, I’ve lost a remarkable 4 inches off my waist, which is greatly encouraging, as I still have another 6 inches to lose (based on my height-to-waist ratio). I know without a doubt that this is entirely ‘doable’!

I look in the mirror and recognize the person looking back. I recently bought new jeans that are a full size smaller and when the weather has been hot, I’ve not only worn shorts, but I’ve wore them out of the house.

My blood pressure is very stable and now fluctuates between stage 1 hypertension and pre-hypertension; a dramatic improvement from the wildly erratic fluctuations between stage 2 and stage 1 hypertension, with a hypertensive emergency thrown in for excitement. It was that crazy high blood pressure which started me on this journey, but what keeps me on it, is how I feel. I feel great!

My blood sugar has been great after meals, but recently has become quite a bit higher several hours after eating, even though I have not eaten or drunk anything except water. From the reading I’ve been doing in the literature, this has been reported in those who previously had what is called “dawn syndrome” (high morning fasting blood glucose – which I had) after they’ve adopted a low carb high fat diet.  It seems that the second of the two stages of insulin release is suppressed in those such as myself,  causing blood glucose to remain higher for a longer period of time. One way of addressing this is via exercise, so it seems I will be doing this more than once in a while to manage this.

This morning it was gorgeous out; clear sky, cool temperatures and the track was beckoning me, and so I went. I haven’t worked out more than 2 or 3 times a month since I began my journey, but despite that, I noticed a huge improvement in my fitness level today. I can only attribute that to the loss of fat around my middle. I did an extra two rounds on the track at a pretty decent clip, with a total distance of 3.2 km (2 miles). I could have done another round (maybe two) but thought I might be too stiff tomorrow, and since my goal is to do this more often to address my second stage insulin suppression, I decided to ‘call it a day’ after 3 km. As I was leaving the track, I decided to take a short video to post along with this 3-month update. Have a look at the video which is posted below, and compare it with the one from 3 months ago. My progress is evident.

Want to know how I can help you accomplish your own health and fitness goals?

Please send me a note using the “Contact Us” form above and I’ll be happy to reply.

To our good health!

Joy

you can follow me at:

 https://twitter.com/lchfRD

  https://www.facebook.com/lchfRD/

Note: I am a “sample-set of 1” – meaning that my results may or may not be like any others who follow a similar lifestyle. If you are considering eating “low carb” and are taking medication to control your blood sugar or blood pressure, please discuss it with your doctor, first.

Copyright ©2017 The Low Carb High Fat Dietitian (a division of BetterByDesign Nutrition Ltd.) 

LEGAL NOTICE: The contents of this blog, including text, images and cited statistics as well as all other material contained here (the ”content”) are for information purposes only.  The content is not intended to be a substitute for professional advice, medical diagnosis and/or treatment and is not suitable for self-administration without the knowledge of your physician and regular monitoring by your physician. Do not disregard medical advice and always consult your physician with any questions you may have regarding a medical condition or before implementing anything  you have read or heard in our content.


Oh Nuts!

One of the challenges with trying to lose weight is reaching a plateau – where one’s weight stays the same for an extended period of time. When eating a low-carb or ketogenic diet, some foods such as nuts are a common pitfall. Despite being a rich source of heart healthy monounsaturated fats, some nuts contain high amounts of carbohydrate.


Carbs Per Serving of Nuts

Serving Size

A serving size* of nuts is generally considered one ounce (1 oz.) which is about a handful of an ‘average-sized hand’. The problem with using this kind of measurement is that not all nuts have the same mass per volume, nor does everybody have the same size hand!

Here are the number of nuts per ounce for common varieties:

  1. Cashew 16-18 nuts per ounce
  2. Pistachio 45-47 nuts per ounce
  3. Almond 22-24 nuts per ounce
  4. Pine Nuts ~3 Tbsp. (160 kernels) per ounce
  5. Hazelnut 10-12 nuts per ounce
  6. Walnut 8-10 halves per ounce
  7. Peanut 27-29 nuts per ounce
  8. Macadamia 10-12 nuts per ounce
  9. Pecan 16-18 halves per ounce
  10. Brazil Nuts 6-8 nuts per ounce

* When eating shelled nuts, many people eat a few palm fulls, so I’m going to indicate the carbs for a 1 oz and 3 oz serving.

Carbs are listed as “net-carbs” (i.e. once fiber (which is not digestible) has been subtracted from the total amount of carbohydrate).

Carbohydrates per Ounce

1. Cashews

Cashews contain the most carbs per serving; a whopping 9 g per 1 oz serving, which is about 16-18 nuts.

2. Pistachio
Pistachios contain 6 gms of carbs per 1 oz serving ~ 46 nuts – that’s 18 gm of carbs in an average 3 handful serving (3 oz) – a little more than a slice of bread.

3. Almonds

Almonds contain 6 gms of carbs per 1 oz serving ~ 22-24 nuts.

4. Pine Nuts

Pine nuts (also called pignolias) contain 3 gms of carbs per oz. (which is about 3 Tbsp.)

5. Hazelnut

Hazelnuts (~11 nuts per ounce) contain ~2 1/2 gms of carbs for a 1 oz serving (~11 nuts) / 7 gms of carbs for 3 oz / 3 average handfuls.

6. Walnut

An ounce of walnuts (9 halves per ounce) contain the same amount of carbs as an ounce of hazelnuts (~2  1/2 gms of carbs for a 1 oz serving / 7 gms of carbs for 3 average handfuls or ~ 27 halves.

7. Peanut

An ounce of peanuts (~28 shelled peanuts per ounce) also contain the same amount of carbs as an ounce of hazelnuts or walnuts (~2  1/2 gms of carbs for a 1 oz serving.

Top three low carb high fat / keto-friendly nuts:

Macadamias, Pecans and Brazil nuts are the 3 most low-carb and keto-friendly nuts – having between 4 and 5 gms of carbs for a 3 oz serving! That’s far better than the 27 gm of carbs for 3 oz of cashews and 18 gm of carbs for 3 oz of pistachios!

8. Macadamia

Macadamias have slightly more than 1  1/2 gms of carbs for a 1 oz serving (~11 nuts) / 5 gms of carbs for a 3 oz serving.

9. Pecans

Pecans have 1.3 gms of carbs for an ounce of nuts (~17 halves) / 4 gms of carbs for a 3 oz serving.

10. Brazil nuts

Brazil Nuts also have only 4 gms of carbs for a 1 oz. serving (~ 7 nuts)

A Tough Nut to Crack

Back in the day, eating nuts meant cracking nuts.

It was common to see living room tables with bowls of nuts in their shell, with nutcrackers and nut-picks readily available for use.

Each house had its preference for the style of nutcrackers they insisted were the best.  Growing up, we had ones like those above.

Nuts and “Carb Creep”

“Carb creep” is when we think we are eating low carb, but hidden sources of carbs are sneaking into our diet without us being aware of it.

When I was pondering why I had reached my own weight plateau, I knew carb creep had to be the reason – but from where?

After analyzing my diet, it seemed that nuts might be the source and it was.

My biggest single downfall was that I like to crack and eat pistachios on the weekend, while working on my foreign language studies – and it is WAY too easy to crack them and eat copious amounts!  In fact, I am somewhat of an expert at shelling them, as my brother and I were placated by our parents with bags of pistachios, on long car trips. To get my “fair share”, I learned to be quite efficient at shelling them and so it seems, I haven’t lost that ‘skill’.

Over the course of several hours I can shell and eat 1/2 to 1 lb of pistachios without really noticing eat, and in the worst case scenario that’s almost 100 gms of hidden carbs!

Add to that a handful or two of almonds a day (another hidden 10 gm of carbs per day) and the source of my “carb creep” became clear.

Portioning

Of course to try to prevent eating too many, nuts can be portioned out in 1 oz or 3 oz ‘servings” and the rest put away for another time, but it is still way too easy for someone who is hungry or tired to mindlessly reach for a handful or two of nuts. It seemed to me that having large containers of shelled nuts that are too easy to reach for, may not be the best solution.

Unshelled Nuts

Replacing shelled nuts with nuts in the shell, like we ate in the “old days”, turns out to be a far more effective solution.

It’s very hard to over eat nuts you have to shell first.

Bingo!

Since pecans are a much lower carb nut than pistachios, they have become my go-to nut from the nut-bowl…and let me assure you, it takes quite a while to shell 17 halves for a mere 1.3 carbs! In fact, I’m pretty sure I expend more energy cracking them, than I take in, eating them.

The Right Tools for the Right Job

Despite having a variety of nutcrackers, I found pecans a “very tough nut to crack” – with them frequently flying out of the standard pinch-style cracker.

I found out that there is a special “pecan cracker” that one can order that apparently does the job very well and looks like this:

…but the little contraption below that I invented in my garage (with a d-clamp and a stick-on felt pad, works great, and I use it for pecans, walnuts and even hazelnuts. Even eating walnuts, which are a higher carb nut – it takes quite a while to shell 9 halves (2  1/2 gms of carbs).

How I can help

For the last 2 years, I have helped my clients lose weight and keep it off using a low-carb approach. More recently, I am ‘practicing what I preach‘ (as you can read about in the blogs titled “A Dietitian’s Journal”). The things I am learning “doing it” adds to what I know academically – which makes me able to coach people much more effectively.

Have questions?

Why not send me a note using the “Contact Us” form on the tab above.

To our good health!

Joy

you can follow me at:

 https://twitter.com/lchfRD

  https://www.facebook.com/lchfRD/

Copyright ©2017 The Low Carb High Fat Dietitian (a division of BetterByDesign Nutrition Ltd).  LEGAL NOTICE: The contents of this blog, including text, images and cited statistics as well as all other material contained here (the ”content”) are for information purposes only.  The content is not intended to be a substitute for professional advice, medical diagnosis and/or treatment and is not suitable for self-administration without regular monitoring by a Registered Dietitian and with the knowledge of your physician. Do not disregard medical advice and always consult your physician with any questions you may have regarding a medical condition or before implementing something you have read in our content.