
In the previous article titled When Normal Fasting Blood Glucose Results Aren’t Necessarily “Fine” I explained how normal results on a fasting blood glucose (FBG) test may simply mask ‘silent Diabetes’ and that even when fasting blood glucose is normal and results from a 2-hour Oral Glucose Tolerance Test (2-hr OGTT) do not indicate glucose intolerance, a person can still have a very abnormal blood sugar response after they eat refined carbohydrates. These spikes’ can be seen between 30 minutes and 60 minutes on 2-hour glucose curves and are reflected by equally abnormal insulin curves. Chronically high circulating levels of insulin (called hyperinsulinemia) result from these blood sugar ‘spikes’ that occur every time the person eats carbohydrate-based foods, which is usually every few hours, for meals and snacks.
Insulin is released in order to take the excess sugar resulting from the digestion of carbs and move it out of the blood and into the cells and even though these people’s blood glucose returns to below the impaired glucose tolerance range by 2 hours, the abnormal glucose response particularly between 30 and 60 minutes drives hyperinsulinemia (chronically high levels of insulin) and is made worse by insulin resistance (which is the ignoring of insulin’s signal by the cells). It is this hyperinsulinemia and insulin resistance that are the essence of carbohydrate intolerance; ; the varying degrees to which people can tolerate carbohydrate without their blood sugar spiking. It is not unlike other food intolerances such lactose intolerance or gluten intolerance which also reflect the body’s inability to handle specific types of carbohydrate in large quantities.
It is the hyperinsulinemia, rather than the high levels of blood sugar that puts people at risk for the serious chronic diseases of cardiovascular disease (heart attack and stroke), high cholesterol and high blood pressure[1] that people usually associate with type 2 diabetes. High blood sugar does have risks of course, including loss of vision, chronic kidney disease and amputation of limbs but if high blood sugar (hyperglycemia) is the “tip of the iceberg”, then high circulating levels of insulin (hyperinsulinemia) is the bigger part of the iceberg that can’t be seen. We can’t see it simply because it is rarely, if ever measured.
Most concerning is that based on a large-scale 2016 study which looked at the blood glucose response and circulating insulin responses from almost 4000 men aged 20 years and older and 3800 women aged 45 years or older during a 5-hour Oral Glucose Tolerance Test, 53% had normal glucose tolerance (normal fasting blood sugar and did not have impaired glucose tolerance (IGT) at 2 hours after the glucose load) but of these people, 75% had abnormal blood sugar results between 30 minutes and 60 minutes (two points in time that are not normally looked at in a standard 2-hour Oral Glucose Tolerance Test (2-hr OGTT).
A normal blood glucose curve represents Carbohydrate Tolerance, and there are 3 Stages of Carbohydrate Intolerance — early, advanced, and severe, with the final stage being a diagnosis of type 2 diabetes (T2D).
Hyperinsulinemia combined with insulin resistance form the heart of Carbohydrate Intolerance.
Insulin Resistance
In the early stages of Carbohydrate Intolerance, receptors in the liver and muscle cells begin to stop responding properly to insulin’s signal. This is called insulin resistance. Insulin resistance can be compared to someone hearing a noise such as their neighbour playing music, but after a while their brain ”tunes out” the noise. Even if the neighbour gradually turns up the volume of the music, the person’s brain compensates by further tuning out the increased noise. This is what happens with the body when it becomes insulin resistant. It no longer responds to insulin’s signal. To compensate for insulin resistance, the β-cells of the pancreas begin producing and releasing more and more insulin resulting in hyperinsulinemia, which is too much insulin in the blood.
Normal Insulin Response
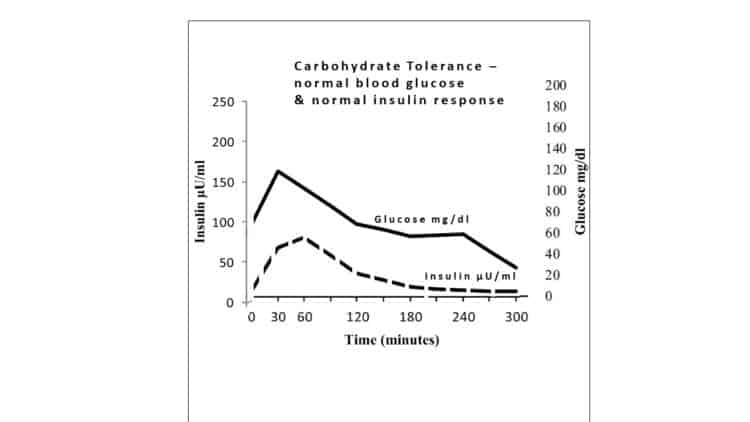
The β-cells of the pancreas of healthy people are constantly making insulin and storing most of it until these cells receive the signal that food containing carbohydrate has been eaten. β-cells also constantly release small amounts of insulin in very small pulses called basal insulin. This basal insulin allows the body to use blood sugar for energy even when the person hasn’t eaten for several hours or longer. The remainder of the insulin stored in the β-cells is only released when blood sugar rises after the person eats foods containing carbohydrate and this insulin is released in two phases; the first-phase insulin response occurs as soon as the person begins to eat and peaks within 30 minutes and can be seen at 30 minutes on the graph below. The amount of the first-phase insulin release is based on how much insulin the body is used to needing each time the person eats. Provided a carbohydrate tolerant person eats approximately the same amount of carbohydrate-based food at each meal day to day, the amount of insulin in the first-phase insulin response will be enough to move the excess glucose from the food into the cells, returning blood sugar to its normal range of ~100 mg/dl (5.5 mmol/L). If there is not enough insulin in the first-phase insulin response, the β-cells will release a smaller amount of insulin within an hour to an hour and a half after the person began to eat.
Below is the Carbohydrate Tolerance curve (i.e. normal glucose curve). The solid black line is unlabeled and is shown along with its corresponding normal insulin curve (dashed line). The insulin response more or less mirrors the glucose response; as glucose rises in the blood, insulin is released mainly as a first-phase insulin response, which results in the blood glucose level falling.
Early Carbohydrate Intolerance
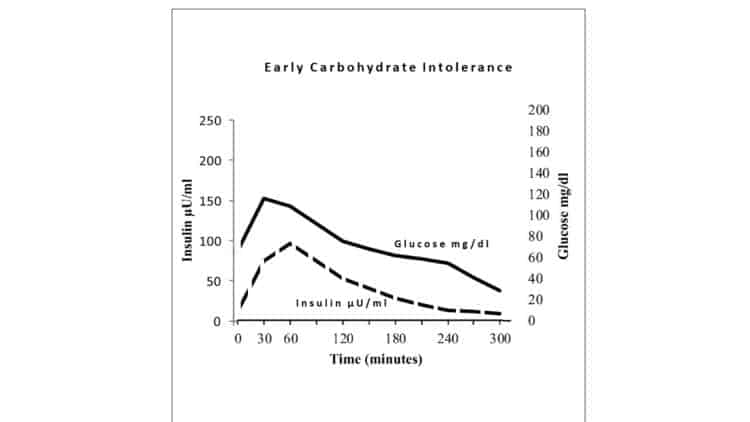
Below is the Early Carbohydrate Intolerance curve and the solid black line (glucose) is shown along with its corresponding abnormal insulin curve (dashed line). As glucose rises in the blood even more insulin is released; initially as a first-phase insulin release and then as a second-phase insulin release. This results in blood glucose level falling but not to baseline (fasting level) by 2 hours afterwards. Notice too that the fall is not as a straight line, but there are two peaks in the glucose curve, before it falls.
It is insulin resistance of the liver and muscle cells which results in the β-cells of the pancreas making more insulin and as can be seen from the graph below it takes more insulin to move the same amount of glucose (carbohydrate) into the cell.
Advanced Carbohydrate Intolerance
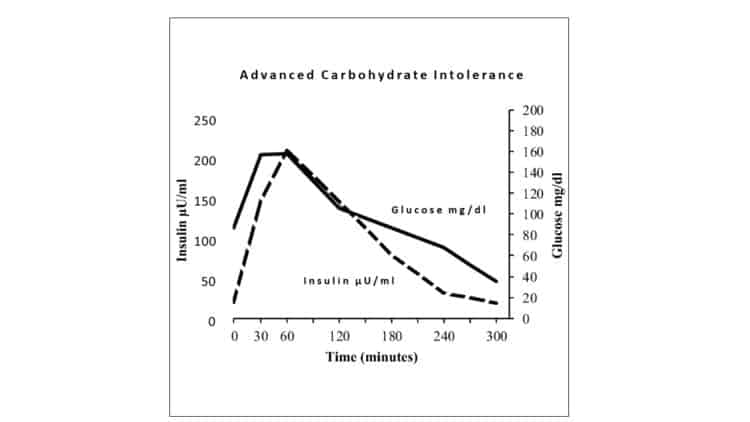
By the time people have progressed to Advanced Carbohydrate Intolerance, the first-phase insulin response won’t produce enough insulin be able to clear the extra blood glucose after a carbohydrate load and even the second-phase insulin response won’t be enough to overcome the insulin resistance of the cells. At this point, the β-cells of the pancreas are unable to make enough insulin to clear the excess glucose from the blood and blood glucose rises well above the normal high peak of 126 mg/dl (7.0 mmol/L). What is also apparent is that even with all the insulin release, blood sugar levels begin rising sooner and rise to much higher levels.
With ongoing high intake of carbohydrate every few hours, especially refined and processed carbohydrate such as bread, pasta and rice which are broken down quickly to glucose, the amount of insulin that must be released from the β-cells of the pancreas to handle a steady intake of carbohydrate-based foods increases substantially. The dashed black line on the graph below shows the insulin curve of Advanced Carbohydrate Intolerance. While the Early Carbohydrate Intolerance glucose curve (above) doesn’t look significantly different then the Advanced Carbohydrate Intolerance curve (below), it’s easy to see that the insulin curves are very different.
The hyperinsulinemia (high levels of circulating insulin) present in Advanced Carbohydrate Intolerance is what makes these two states different.
This high insulin response occurs every time these people eat significant amounts of refined carbohydrate and puts them at increased risk of the chronic diseases associated with chronic hyperinsulinemia including heart attack and stroke, hypertension (high blood pressure), elevated cholesterol and triglycerides, non-alcoholic fatty liver (NAFLD), Poly Cystic Ovarian Syndrome (PCOS), Alzheimer’s disease and other forms of dementia, as well as certain forms of cancer including breast and colon cancer [1].
A standard 2-hour OGTT would not show the significant abnormality in terms of how the body is able (or rather, not able) to process carbohydrate because standard blood tests do not test either glucose or insulin at 30 and 60 minutes. It’s not that there aren’t abnormalities, it is just that they are not measured!
Severe Carbohydrate Intolerance
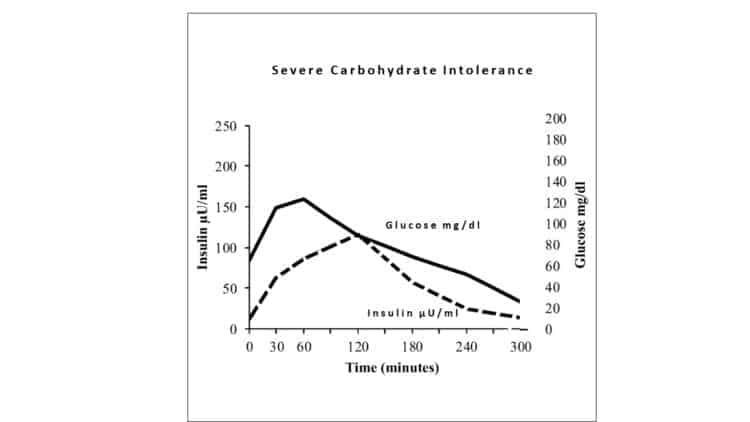
As Carbohydrate Intolerance progresses, some people’s glucose-insulin curves look like the ones below. Blood sugar levels don’t rise as high, but the β-cells of the pancreas are producing less insulin and releasing it much later. They have no idea, because their fasting blood sugar is still normal.
Type 2 Diabetes
Type 2 Diabetes (T2D) is the final stage of Carbohydrate Intolerance and is the natural outcome of a person continuing to eat a diet high in carbohydrate-containing foods when their body is unable to tolerate it. Too often this is the natural outcome of people following Dietary Guidelines (US or Canadian) which are designed for a healthy population, not people who are metabolically unwell. The problem is most people think they are healthy because they have normal blood glucose tests, and their metabolic dysfunction is never diagnosed. No one is looking for it.
The Dietary Guidelines recommend that people eat 45-65% of their dietary intake as carbohydrate and people in both countries dutifully eat considerable amounts of carbohydrate in the form of bread, cereal, rice and pasta, as well as fruit, milk and sweetened yogurt and starchy vegetables such as peas, corn and potato. Not knowing their body has become carbohydrate intolerant, this chronically high intake of carbs continues to put strain on their pancreas, until udder the pressure of the combination of hyperinsulinemia and insulin resistance, their β-cells burn out, resulting in Type 2 Diabetes.
Some Final Thoughts…
It has been said that type 2 diabetes is a ”chronic, progressive disease”, but does it doesn’t have to be this way! It can be stopped LONG before fasting blood sugars become abnormal.
Diagnosing hyperinsulinemia is simple and can be done with existing standard lab tests; namely a 2-hour Oral Glucose Tolerance test with an extra glucose assessor and extra insulin assessor at 30 minutes and 60 minutes. When patients request this test because they are at high risk, too many are told that it is “a waste of healthcare dollars” when quite literally they could be spared the scourge of type 2 diabetes by having the changes in insulin and glucose response diagnosed in the 20 years before standard blood sugar begins show abnormalities [2].
NOTE (March 9, 2021): Some family medicine doctors won’t order tests to assess insulin along with glucose in order to “save healthcare system dollars” — but instead will send their patient to an endocrinologist which costs the system ~$300 before any tests are run. Why? In parts of Canada, if audited, family medicine physicians have to re-pay for preventative tests (which are deemed “unnecessary”) . Self-paying for these tests is an option to consider.
It’s time to think about ways to implement dietary changes and lab testing procedures that will prevent Carbohydrate Intolerance and from developing the abnormal glucose and insulin responses and the host of metabolic diseases that go along with them.
In fact, it is long overdue.
If you would like my help in lowering your risk to developing type 2 diabetes and the chronic disease risks associated with hyperinsulinemia, or reversing their symptoms, then please send me a note using the Contact Me form, on the tab above.
To your good health!
Joy
You can follow me at:
https://twitter.com/lchfRD
https://www.facebook.com/lchfRD/
https://www.instagram.com/lchf_rd
References
- Crofts, C., et al., Identifying hyperinsulinaemia in the absence of impaired glucose tolerance: An examination of the Kraft database. Diabetes Res Clin Pract, 2016. 118: p. 50-7.
- Sagesaka H, S.Y., Someya Y, et al, Type 2 Diabetes: When Does It Start? Journal of the Endocrine Society, 2018. 2(5): p. 476-484.
Copyright ©2018 The LCHF-Dietitian (a division of BetterByDesign Nutrition Ltd.)
LEGAL NOTICE: The contents of this blog, including text, images and cited statistics as well as all other material contained here (the ”content”) are for information purposes only. The content is not intended to be a substitute for professional advice, medical diagnosis and/or treatment and is not suitable for self-administration without the knowledge of your physician and regular monitoring by your physician. Do not disregard medical advice and always consult your physician with any questions you may have regarding a medical condition or before implementing anything you have read or heard in our content.