Type 2 Diabetes and Metabolic Syndrome IS reversible – a Dietitian’s Journey

If you’ve been following my 16-month journey, you know that my goal has been to put my Type 2 Diabetes into remission and to no longer meet the criteria for Metabolic Syndrome.

July 11, 2017 I had complete lab work done, including fasting insulin, cholesterol, fasting blood glucose and glycated hemoglobin (HbA1C). I planned to redo the same tests at the same time this July to see how much progress I was making.

The day I had been waiting for arrived!

So, how did I do?

Let’s see where I started from in July 2017;

fasting insulin July 11, 2017

Last year, my fasting insulin was 54 pmol/L which converts to 7.8 μU/ml — well above the ideal insulin sensitive range of 2-6 μU/ml. I was insulin resistant, which was no surprise given I had Type 2 Diabetes for more than 10 years.

What about yesterday – 16 months after starting a low carbohydrate lifestyle?

fasting insulin, July 10, 2018

I went from 54 pmol/L (7.8 μU/ml) to 33 pmol/L (4.8 μU/ml). I no longer have high insulin; in fact, my insulin was now in the ideal range, between 2-6 μU/ml. Very cool!

But then what explains why my fasting blood sugar is still so high?

fasting blood glucose July 11, 2017

I mean, it has dropped a lot from 8.0 mmol/L  (144 mg/dL) last year to 6.9 mmol/L (124 mg/dl) this year, but this was still a huge disappointment.  Yes, many days my fasting blood sugar is in the low 5’s mmol/L (94-95 mg/dl) but not this time. It was at the high end of what it goes to!

Why?

fasting blood glucose July 10, 2018

In the last several months, I’ve been losing a lot of fat from my abdomen (2.5 more inches since the beginning of March, on top of the 8 inches I lost in the first year) and the end result of the action of hormone sensitive lipase on fat cells (adipocytes) is the release of free fatty acids and glycerol. The liver cells (hepatocytes) take the glycerol and turn it into glucose in a process called gluconeogenesis (literally “making new glucose”).  It is this glucose that is produced by my liver from my broken down fat stores that is raising my fasting blood sugar.

The good part is that my fat cells are emptying out.  The bad part is that my liver is making glucose out of it…and what complicates the matter is that I have what’s called “peripheral insulin resistance” from often eating only once a day (time-restricted-eating) and that causes my body to “save” the glucose for necessary processes.  As a result, my body cells don’t take in the excess glucose made by my liver and it hangs around in my blood until I get moving.  Then it will dissipate (provided I eat some breakfast).

What about my glycated hemoglobin (that is effectively the three month average of my blood sugar)?

glycated hemoglobin (HbA1C) July 11, 2017

A year ago, my HbA1C  was 7.5% which is well above the cutoffs of 7% which is set for those with Type 2 Diabetes.

glycated hemoglobin (HbA1C) July 10, 2018

This year it was 6.3% which is below the cutoffs for Type 2 Diabetes of 6.5% and lower than what it was 3 months ago, which was 6.4%. Naturally, it is higher than I would like because it includes all the glucose my liver is making from the fat cells it is breaking down, but sooner or later it is going to run out of that!  Soon my waist circumference WILL be half my height and around that point, my fasting blood glucose should be dropping.  My goal is to see my HbA1C below 5.5 mmol/L (100 mg/dl) and be in full remission from Type 2 Diabetes, not only partial remission which is what I have now.

But celebrating the victory, I am in partial remission of Type 2 Diabetes!!

So how have my lipids changed this last year, with the butter, coconut oil and coconut milk and full fat cream that I have been eating, as well as much more meat than I used to?

Last year, four months into my low-carbohydrate journey, this is what they looked like:

Lipid panel, July 11, 2017


…and this year?


Lipid panel, July 10, 2018

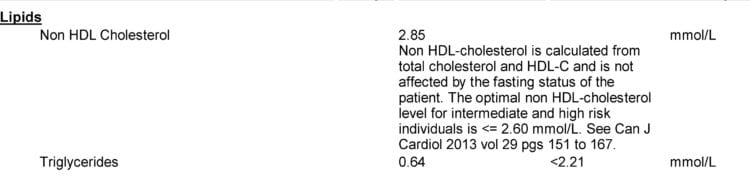
My LDL is down (2.60 to 2.47 mmol/L) , my HDL is up significantly (1.97 to 2.44 mmol/L), my non-HDL cholesterol (chylomicrons and VLDL) is down (2.45 to 2.11 mmol/L) and my already low triglycerides went even LOWER (0.64 to 0.52 mmol/L).

In July 2017 my TG:HDL ratio was 0.35, which is well below 0.87 and this year my TG:HDL ratio was 0.21! This means that of my LDL cholesterol, most are the large fluffy kind (the ‘good’ LDL), and not the small dense kind (the ones that put us at cardiovascular health risk).

I no longer meet the criteria for Metabolic Syndrome which is having 3 or more of the following 5 symptoms:

Criteria for Metabolic Syndrome – from Merck Manual

My waist circumference is significantly <35″

My blood pressure is well below 130/85 (usually around 120/70)

My triglycerides are well below 1.7 mmol/L (150 mg/dl) at 0.52 mmol/L

My HDL is well above 1.29 (it’s 2.44 mmol/L!!)

…but yes, my fasting blood glucose is still > 5.6 mmol/L (100 mg/dl).

So, I’m not “done” yet.

While I didn’t get “perfect” blood work, it’s pretty good for someone that 16 months ago was obese, had been Type 2 Diabetic for 10 years, had been diagnosed 3 years earlier with mast cell disease (which elevates blood sugar and insulin), had extremely high blood pressure and abnormal cholesterol.

Not bad at all.

…and all this by simply reducing my carbohydrate intake and eating whole, real food, including fruit, dairy, meat, lots of veggies and healthy fats from a variety of sources.

Of course, these are only my results. Everyone is different, but at a year, my results closely mirrored the results Virta Health’s study published at one- year study, with 218 subjects that had been eating the same as I have.  So, it is certainly not unusual for people following a well-designed low carbohydrate diet to get these kinds of results.

NOTE: There is no "one-size-fits-all" low carbohydrate diet and what works for me may not be what is best for you. Before undertaking a major change in diet, please discuss your plans with your doctor.

Perhaps you wonder what adopting this type of eating style would look like for you, or have questions about how Distance Consultation services work and the cost involved. Please send me a note using the ”Contact Me” form above and I’ll reply shortly.

To our good health!

Joy

You can follow me at:

 https://twitter.com/lchfRD

  https://www.facebook.com/lchfRD/

Copyright ©2018 The LCHF-Dietitian (a division of BetterByDesign Nutrition Ltd.)

LEGAL NOTICE: The contents of this blog, including text, images and cited statistics as well as all other material contained here (the ”content”) are for information purposes only.  The content is not intended to be a substitute for professional advice, medical diagnosis and/or treatment and is not suitable for self-administration without the knowledge of your physician and regular monitoring by your physician. Do not disregard medical advice and always consult your physician with any questions you may have regarding a medical condition or before implementing anything  you have read or heard in our content.

References

  1. Merck Manual – Metabolic Syndrome (Syndrome X; Insulin Resistance Syndrome), https://www.merckmanuals.com/en-ca/professional/nutritional-disorders/obesity-and-the-metabolic-syndrome/metabolic-syndrome


A Dietitian’s Journal – seven weeks eating a low carb high fat diet

It has been a little over seven weeks since I started eating a low carb high healthy fat diet, so here’s an update on my progress.

Weight

In 7 weeks (1 March – 16 April), I’ve lost ~6 lbs, which is quite a reasonable weight loss for someone who was not obese. Most of my weight loss was in the first few weeks, which according to Phinney and Volek (The Art and Science of Low Carbohydrate Living) is quite common for numerous reasons, not the least of which is that our bodies excrete sodium as our insulin levels fall and as a result we lose excess water.

But as mentioned in the previous article, a scale is not an effective measure of short-term changes as the average adult’s weight can fluctuate by as much as 4  1/2 pounds per day, due to water alone.

[see https://www.lchf-rd.com/2017/04/20/the-limitations-of-common-ways-of-determining-weight-loss/]

WAIST CIRCUMFERENCE

From 1 March – 16 April, I lost 2 inches off my waist. That is alot, but is it significant?

Since it is unknown how much of that decrease was due to water excretion and how much due to fat loss, the decrease in my waist circumference does not provide much information in the short-term.

BODY FAT PERCENT

Based on a Body Fat Analysis, my body fat percentage is down from 40.2% to 39.0% – a decrease of ~ 1.2% but as mentioned in the previous article, Body Fat Analyzers use electrical impedance to determine fat percentage, and this measurement is affected by a number of conditions, including environmental (room) temperature, a person’s hydration status, as well as emotional stress.

Since hydration status can fluctuate by ~4 pounds per day, a body fat analyzer is no more accurate a short-term measure than a standard bathroom scale.

As a result of the limitations of a scale, tape measure and body fat analyzer to capture short-term weight loss, I was left with two ways to assess my progress:

(1) people’s observations of me having lost “so much weight”

(2) how my clothes fit.

VISUAL ASSESSMENT

Over the last number of weeks, I have had quite a number of people remark about my ‘significant weight loss’, but given that I (seemingly) lost a nominal amount, this surprised me.  Over the same period, I’ve been comfortably wearing clothes I could not even get into previously. Surprisingly, it was an inadvertent ‘before’ and ‘after’ photo that provided the most accurate measure of the effect low-carb eating has had on my body weight.

In filing a photo that was taken last week, I found another picture that was taken just before I started eating low carb – where I happened to be wearing the exact same outfit.

The difference was evident.

In progress – before and after

They say the “camera never lies”.

In retrospect, I would have deliberately taken ‘before’ pictures.

CLOTHES

Prior to coming face-to-face with my own denial, I was wriggling into most clothes – particularly pants.  I had set aside some clothes because I simply could not get into them. Wash day always raised the uncertainty as to whether I would be able to get my clean clothes on after they came out of the dryer.

Now there are no clothes that I own that I can’t wear.  That does not mean they all look great (by no means!), but I can easily close buttons, zippers and actually sit in them! Some clothes that I fit ‘before’ are now beginning to feel loose.

OTHER MEASURES OF LOW CARB SUCCESS

Fasting Blood Glucose

Five weeks ago my monthly average fasting blood glucose was 8.8 mmol/L. Two weeks ago, it was ~8.6 mmol/L. Now it is 8.0 mmol/L.  The last time I had it taken by the lab (a year and a half ago), it was 9.7 mmol/L!

I am aiming for a fasting blood glucose of 5.0 mmol/L by November of this year.

Post Prandial blood glucose (2 hours after a meal)

My blood sugar 2 hours after lunch has dropped from 7.4 mmol/L to 7.0 mmol/L and after dinner, it has dropped from 7.7 mmol/L to 7.3 mmol/L. This is well below the target of < 10.0 mmol/L for a Type 2 Diabetic.

I am aiming for a 2 hour post-prandial blood glucose of between 5.0 – 6.00 mmol/L by November of this year.

BLOOD PRESSURE

For those that have been following my journey over the last 7 weeks, you may recall that it was a ridiculously high blood pressure that was the impetus to change the way I ate.

I’ve gone from ~30% Stage 2 Hypertension, 50% Stage 1 hypertension 15% pre-hypertension and the rest a hypertensive emergency (yikes!) to 80-85% Stage 1 Hypertension and 15-20% pre-hypertension.

This last week (week 7) my blood pressure has been 100% Stage 1 Hypertension, which one would think at first glance was a “setback”, but I don’t view it that way. Firstly, blood pressure that fluctuates a lot is much harder on the heart than blood pressure that is stable.

Secondly, the last two weeks I have been supplementing sodium to eliminate the headaches I had been getting and the periodic arrhythmia (irregular heart beats) that I started to get.

Phinney and Volek (The Art and Science of Low Carbohydrate Living) explain that if one is eating less than 60 gms of carbs per day, that 2-3 grams of sodium should be added to the diet (provided the person is not taking any diuretics or other blood pressure medication). A half a teaspoon of table or sea salt provides 1000 mg or 1 gram of sodium.

Failing to supplement sodium in a low-carb diet can result in really bad headaches and if sodium remains low, potassium will also be excreted to keep a necessary sodium-potassium balance. The drop in potassium can result in irregular heart beat, a condition known as arrhythmia.

Currently, I seem to do best on 1 to 1  1/2 tsp of sea salt, which provides 2 – 2.5 grams sodium. Of course, once the weather starts getting warmer or my exercise starts becoming more strenuous, I will need to increase that.

The ‘side effect’ of keeping my sodium levels constant is that my blood pressure has stabilized – and this is a good thing.  Now I can watch it fall over time, without the wild fluctuations I had been experiencing when I was eating a high carb diet.

OTHER MEASURES – FASTING INSULIN, AM-CORTISOL AND C-PEPTIDE

Fasting Insulin

A year and a half ago, I asked my GP to assess my Fasting Insulin and Fasting Cortisol and he would not as he said he was unable to provide interpretive information. Instead, he referred me to an Endocrinologist.

The Endocrinologist assessed my Fasting Insulin (August 2015) and it was 49 pmol/L (20-180 pmol/L) – but she would not provide me with interpretative information, either. So I had this number, that meant nothing to me at the time.

I did some ‘digging’ in the literature and found a 2009 study from the European Journal of Endocrinology [European Journal of Endocrinology (2009) 161 223—230] which reported that Fasting Insulin was a strong and independent contributor to cardiovascular risk and atherosclerosis and that women with Fasting Insulin in the lower quartile (25 pmol/L) had significantly lower risk of systemic atherosclerosis, than those in the higher quartile (44 pmol/L).  Now my Fasting Insulin result had some meaning – and it wasn’t good! My fasting insulin was above the higher quartile (49 pmol/L).

My goal is to lower my fasting insulin to at or below 25 pmol/L by November of this year- and the way to lower insulin is by (1) eating a low-carb diet and through (2) intermittent fasting which is what I have been doing.

Now I have even more motivation to stick with this long-term.

My journey is more about health and reduced cardiovascular risk than it is about looking good.  Looking better is a great side benefit.

C-Peptide

Elevated C-peptide (not the same as C-Reactive Protein) is reported to be associated with the higher level of heart disease, including myocardial infarction and coronary artery disease – even in those whose fasting glucose is not impaired (Reference: Diab Vasc Dis Res. 2015 May;12(3):199-207).

Since my C-Peptide was 569 pmol/L (325-1090 pmol/L) a year and a half ago, my goal is to bring that number much closer to the lower end of the range (~350 pmol/L). I will be researching in the literature to determine what factors affect C-Peptide the most.

Cortisol

Cortisol, the so-called “stress hormone” is highest between 6 and 8 AM and it gradually falls during the day, reaching its lowest point around noon. A year and a half ago, my AM Cortisol was 451 nmol/L (140-690 nmol/L) and since cortisol is the hormone that is responsible for mobilizing glucose as part of the “fright and flight response”, it may contribute to my fasting blood glucose being so high.

My goal will be to look into ways to lower my AM Cortisol levels through diet, exercise and stress management.

Final Thoughts

This is a “journey”; one which is as much about the process of getting to my destination as the destination itself. It is about having a healthy relationship with food and about eating when I’m hungry; not because “it is time to eat”. It is about the process of enabling insulin levels to fall simply by delaying when I eat and what I eat. It is about addressing my body’s inability to process carbohydrates – no differently than I would address an inability to tolerate lactose or inability to tolerate gluten.  Instead of lactose intolerance or Celiac disease, I have carbohydrate intolerance and as a Dietitian, the path forward is clear. I limit carbs to those contained in non-starchy vegetables, nuts and seeds and use healthy fats as my predominant fuel source.  This allows my insulin levels to fall, lowering insulin resistance and enables me to access my own (abundant) fat stores for energy.

For the first time in years, I am sleeping well and the inflammation in my joints that plagued me for years, is largely gone. Just as a newly-diagnosed Celiac feels well for the first time once they eliminate gluten from their diet, so too do I feel so much better without eating carbs, as carbs.

Have questions about how I can help you? Feel free to send me a note using the form on the “Contact Us” tab, above.

To your good health!

Joy

If you would like to read well-researched, credible ”Science Made Simple”  articles on the use of a low carb or ketogenic diet for weight loss, as well as to significantly improve and even reverse the symptoms of Type 2 Diabetes, high cholesterol and other metabolic-related symptoms, please  click here.

you can follow me at:

 https://twitter.com/lchfRD

  https://www.facebook.com/lchfRD/

Note: I am a "sample-set of 1" - meaning that my results may or may not be like any others who follow a similar lifestyle. If you are considering eating "low carb" and are taking medication to control your blood sugar or blood pressure, please discuss it with your doctor, first.

Copyright ©2017 The LCHF-Dietitian (a division of BetterByDesign Nutrition Ltd.) 

LEGAL NOTICE: The contents of this blog, including text, images and cited statistics as well as all other material contained here (the ”content”) are for information purposes only.  The content is not intended to be a substitute for professional advice, medical diagnosis and/or treatment and is not suitable for self-administration without the knowledge of your physician and regular monitoring by your physician. Do not disregard medical advice and always consult your physician with any questions you may have regarding a medical condition or before implementing anything  you have read or heard in our content.