
As I’ve been saying from the beginning, my data is “a sample-set of one” (n=1), but yesterday data from 218 subjects that followed a low carb ketogenic diet for one year was published, so now I have something to compare my data with. Like the subjects in the study, when I began on March 5 2017, I was obese and had been diagnosed with Type 2 Diabetes more than a decade ago. The comparison between my results and those of subjects in this study is very encouraging!
Method Comparison
Carbohydrate Intake
Subjects in the study typically ate <30 g total dietary carbohydrates per day, whereas I ate 50 g of net carbohydrates per day which is approximately ~65 g of total carbohydrate per day for the first 5 months (more than double the amount of carbohydrate of those in the study). Most of these carbs came from berries and nuts.
It became clear through lab tests (fasting insulin along with fasting blood glucose) that I was quite insulin resistance and that level of carbohydrate intake was not providing me with the reduction in blood glucose I was seeking. It is only in the last 6 months that I lowered my carbohydrate intake to the level of those in the study and began to see significant progress.
Protein Intake
Subjects in the study had their protein intake targeted to a level of 1.5 / kg based on ideal body weight.
Until very recently, my protein intake was at 1.0 g / kg based on ideal body weight (which is at the minimum level of protein intake) and the bulk of my intake was from fat.
Vegetable Intake
Just as subjects in the study, I ate 3-5 servings of non-starchy vegetables per day.
My 11-month outcomes compared with 1-year data from the study
Blood Glucose Levels
At baseline, the average HbA1c level of participants in the study was 7.6% ±1.5%, with less than 20% of participants having a HbA1c level of <6.5% (with medication usage).
As I documented in my one-month update, I didn’t measure my HbA1C at baseline, but there are clinical calculators for estimating that from blood glucose levels. From laboratory tests, my fasting blood glucose the previous three years was 7.9 mmol/L (Feb 2013), 9.1 mmol/L (Sept 2014) and 9.7 (Aug 2015). Extrapolating that data to the start of my journey (March 5 2017) brought it to approximately 12 mmol/L. As documented in an earlier progress update, four months into eating low carb high fat, my fasting blood sugar was averaging 8.5 mmol/L.
Here is a graph of my blood sugar levels the first few weeks;
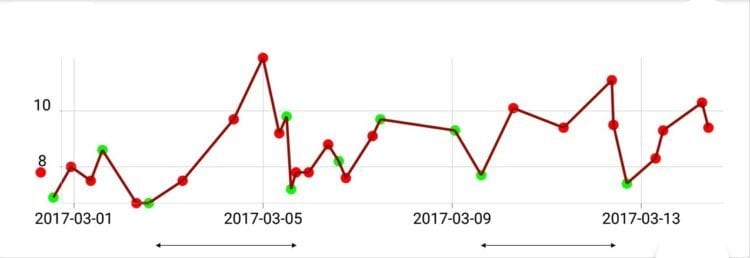
My blood sugar levels a month after starting my journey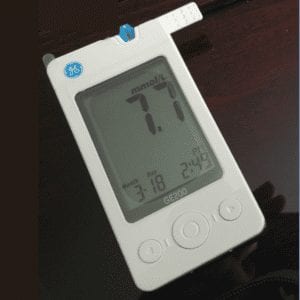 As can be seen from the graph, my blood glucose was at lowest at 7.7 mmol/L (see photo to the left) and I had spikes well above 10 mmol/L, and I was averaging around 8.5 mmol/L over the course of the day – which is slightly higher than the average of those in the study.
On average after 1 year, participants in the study lowered HbA1c from 7.6% to 6.3% — which is in the sub-Diabetes range. A month ago, my laboratory HbA1C came back at 6.4% and in the last month, I am averaging 6.33%.
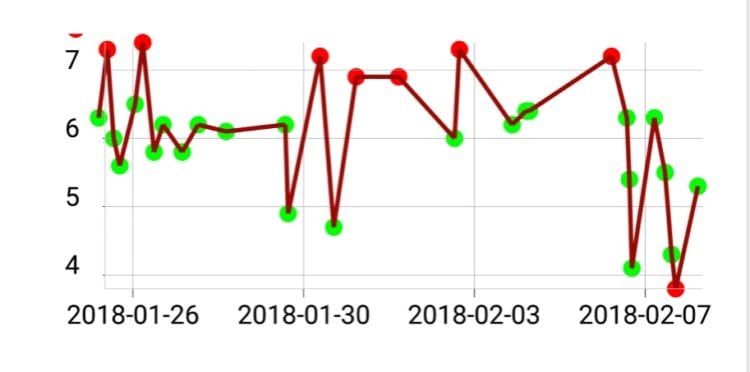
My highest ‘spikes’ are just above 7 mmol/L whereas at the beginning they were closer to 10 mmol/L.
Weight Loss
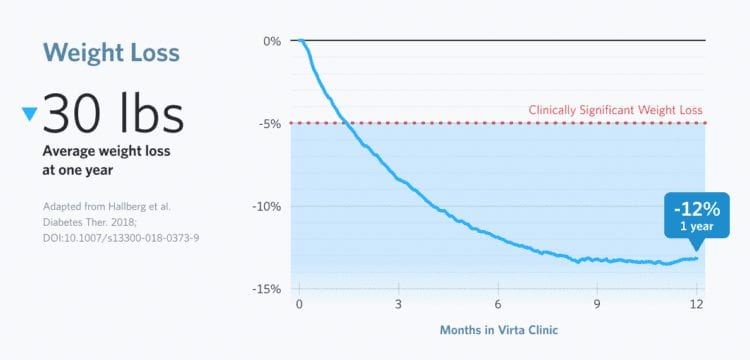
At one year, mean body mass reduction of participants in the study was 12% of their initial body weight, with an average of 30 pounds lost.
Other Metabolic Markers
At 10 months, participants in study experienced a 20% reduction in their triglycerides levels and after one year, reduction in triglycerides was at 24%. After one year, LDL increased on average by 10% however HDL increased on average by 18%.
My triglycerides dropped from .95 to .64 from the last time I had them checked in 2015 (with no change in diet until March 2017), which is a decrease of 33%, which is even better than the average 24% subjects in the study obtained. My LDL dropped from 3.26 to 2.60, which is a decrease of 20% – even better than the average of 18% from the new 1-year study data.
My HDL was previously good as I ate a liberal carb Mediterranean diet and not a standard American / Canadian diet, so it only rose 3% (from 1.91 to 1.97) from the last time I had it checked, however with the drop in my triglyceride levels, my TG:HDL ratio is now 0.32 (with <0.87 considered ideal).
Eleven months ago, my blood pressure was 1/3 of the time in Stage 2 Hypertension with one hypertensive emergency (higher than Stage 3 hypertension!) with the rest of the time in Stage 1 hypertension. The last two weeks, my blood pressure is 50% of the time in the normal range for non-Diabetics to 50% pre-hypertension (which is considered the ‘normal range’ for those with Type 2 Diabetes) and I am off Ramipril. Except for stating that participants in the study had improvements in both systolic and diastolic blood pressure, no data was provided, so no comparison is possible.
Conclusion
Even eating almost double the amount of carbohydrates as those in the study ate for the first 5 months, my weight loss and improvements in blood glucose levels the last 6 months enabled me to match or exceed the results of those in the study!
On average after 1 year, participants in the study lowered their HbA1c from 7.6% to 6.3% and I lowered mine from 8.5% to 6.3% after 11 months.
Average weight loss in the study during the first year was 12% of body weight which on average was 30 pounds and my weight loss has been 17% of my body weight with a 35 pound weight loss, in 11 months.
My triglycerides decreased 33% which is even better than the average 24% in subjects in the 1 year study.
My LDL decreased 20% which was also better than the average of 18% from new 1-year study data.
My blood pressure was dangerously high 11 months ago and today is in the normal range for someone with Type 2 Diabetes and half the time is in the normal range for someone without it.
Finally here are two additional ways that I can measure my success to date;
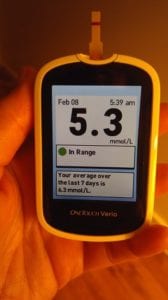 Early this morning, my fasting blood glucose was 5.3 mmol/L (95 mg/dl) which is in the normal non-Diabetic range. This is a first! This was without taking Metformin.
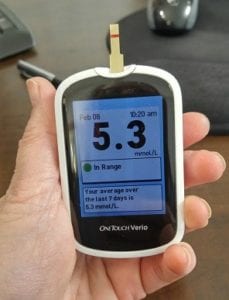
At 10:20 AM while still fasting (today in an intermittent fast day for me), my fasting blood glucose is still 5.3 mmol/L (95 mg / dl) – also with no medication.
This is my body maintaining a stable non-diabetic fasting blood glucose level – which means my liver is not over-synthesizing new glucose (gluconeogenesis)
This is huge progress.
Up until now, my liver and muscle was so insulin resistant that my liver just kept making more and more glucose (via a process called gluconeogenesis).
Normally, the hormone insulin stops excess glucose production by stopping glucagon secretion by the pancreas (alpha cells), but I was SO insulin resistant, glucagon would be released telling my liver to make more glucose!
The fact that my fasting blood sugar has been stable for so many hours, means my liver is starting to respond to signals correctly. My liver is maintaining my blood sugar at a normal level – without any medication. This is great news.
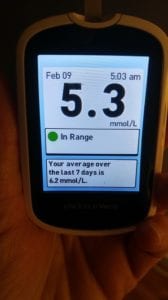
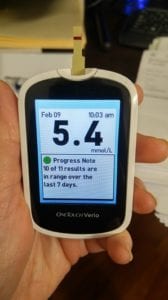
UPDATE: My morning fasting blood glucose the following morning was just as wonderful (5.3 mmol/L / 95 mg/dl), Feb 9) and my 2 hour post prandial blood glucose after eating a high protein low carb breakfast was also amazing (5.4 mmol/L / 97 mg/dl, Feb 9). That is, the above result was not a ‘one-off’ event but the start of becoming insulin sensitive!
Finally, here are two photos of me; one from March 2017 and one from February 2018 – taken 10 months apart. Using the width of my glasses as a reference, it is easy to see the decrease in the width of my face.
Goals compared with results
March 14, 2017, I set very specific goals that I wanted to achieve and they were;
I have a long way to go to get to my goals (plural) because I’ve set the bar very high…and why not? If the literature indicates that this works, then I want;
(1) blood sugar in the non-diabetic range
(2) normal blood pressure
(3) normal / ideal cholesterol levels
(4) a waist circumference in the ”at or below” recommended values of the Heart and Stroke Foundation
Will I meet all these goals? Who knows?! But I won’t know if I don’t try and the alternative of a life of medication for blood sugar, blood pressure and eventually cholesterol too does not appeal to me!
So join me in my journey — a journey of change, of good health and on a road less traveled.
It is 11 months later this is what I have achieved;
- My HbA1C is below the Diabetic range and I am much of the time, I am able to maintain my fasting blood sugar in a normal, non-Diabetic range.
- My blood pressure is in the normal range for someone with Type 2 Diabetes and half the time it is in the normal range for someone without it.
- I have normal / ideal HDL cholesterol and triglyceride levels and my LDL is in the normal, but not ideal range.
- I have a waist circumference that is ”at or below” recommended values of the Heart and Stroke Foundation (see photo , above).
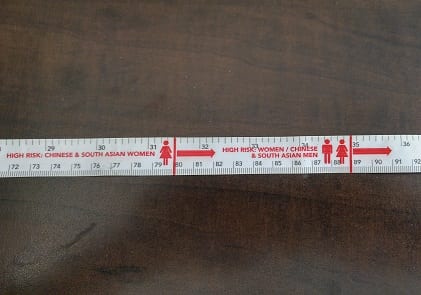
A waist circumference in the ”at or below” recommended values of the Heart and Stroke Foundation for a Caucasian woman is < 35 inches
Three weeks after setting the above goals, I updated my waist circumference goal to be that I wanted my waist circumference to be half my height. This was based on a meta-analysis study from 2012 which pooled data from multiple studies with more than 300, 000 adults in several ethnic groups and which found that Waist to Height Ratio (WHTR) was a far better predictor than BMI or Waist Circumference of cardiovascular or metabolic risk factors in both sexes.

How to take Waist to Height ratio: Measure your waist at the location that is the mid-point between your last rib and the top of your hip bone, with the front and back of a flexible seamstress-type tape measure at the same height, and your belly fully relaxed, not sucked it in! Your waist circumference in inches should be half your height in inches.
Based on having a low-risk waist to height measurement, I still have to lose another 2- 1/2 inches off my waist. I haven’t yet “arrived” but I am certainly making progress in my own, personal health and weight loss journey.
Comparing my own results over the last 11 months to the 1 year data of over 200 adults with Type 2 Diabetes who were eating a low carb ketogenic diet, I am doing at least as well, and in some cases, better. This is reason for me to be encouraged.
NOTE: There is no “one-size-fits-all” low carb / ketogenic diet and what works for me may not be what is best for you. Before undertaking a major change in diet, please discuss your plans with your doctor.
Have questions?
Wonder how a low carb / ketogenic lifestyle can help?
Please send me a note using the ”Contact Me” form above.
To our good health!
Joy
You can follow me at:
![]() https://www.facebook.com/lchfRD/
https://www.facebook.com/lchfRD/
Copyright ©2018 The LCHF-Dietitian (a division of BetterByDesign Nutrition Ltd.)
LEGAL NOTICE: The contents of this blog, including text, images and cited statistics as well as all other material contained here (the ”content”) are for information purposes only. The content is not intended to be a substitute for professional advice, medical diagnosis and/or treatment and is not suitable for self-administration without the knowledge of your physician and regular monitoring by your physician. Do not disregard medical advice and always consult your physician with any questions you may have regarding a medical condition or before implementing anything you have read or heard in our content.
References
Hallberg, S.J., McKenzie, A.L., Williams, P.T. et al. Diabetes Ther (2018). Effectiveness and Safety of a Novel Care Model for the Management of Type 2 Diabetes at 1 Year: An Open-Label, Non-Randomized, Controlled Study. https://doi.org/10.1007/s13300-018-0373-9