
INTRO: Three weeks ago, the pain of changing was less than the pain of remaining the same and so I changed. At that time, my blood pressure had hit dangerously high levels and I didn’t even know what my blood sugar levels were, as I hadn’t checked them in ages. I didn’t want to know. Despite being a Dietitian, I was in classic denial. March 1st, I began eating low carb high fat (LCHF) and delaying the time until the next meal (called “intermittent fasting”). Keep in mind, three weeks is an incredibly short period of time, but I did not expect to see these kinds of results. There was not only significant weight loss (water?) but loss of inches around the waist (also water?), but lower blood sugar and blood pressure, as well.
Today is three weeks since my journey began and here is an update on my progress – three weeks in.
Blood Sugar
In the first two weeks, my blood sugar decreased substantially even on the days I was not intermittent fasting – provided I ate very few carbs. When I was eating what most would consider “low carb”, my blood sugar would spike.
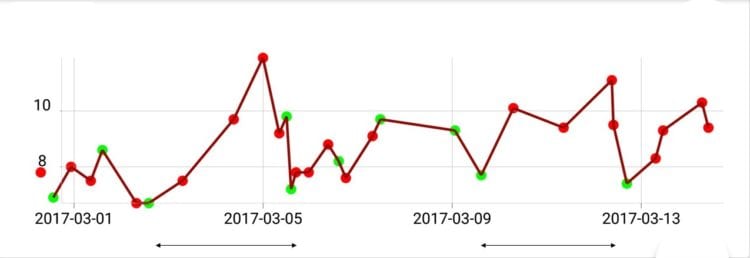
It became clear that as long as I kept my net carbs (carbohydrate minus fiber) fairly low, I did very well but above a certain level my body could not handle the sugar load. You can see this from the graph above.
On Saturdays I was eating more than that level of carbs, which can be seen indicated by the grey arrows, below the graph. My blood glucose would spike if I had any more than the carbs found naturally in low carb meals.
I could see clearly that I was very insulin resistant -which is no surprise, considering I was diagnosed with Diabetes ~ 10 years ago. Despite my pancreas producing more and more insulin in response to eating carbs, the insulin was unable to take the glucose (sugar) from my blood in a reasonable amount of time, to store it in my liver.
[Note: According to the research of Dr. Joseph R. Kraft between 65-75% of people with normal blood sugar are actually insulin resistant – that is, they have the same risk of hardening of the arteries and heart attack as those with Diabetes, they just don’t know it because they don’t have high blood sugar to indicate that. That’s is very sobering.
Since realizing how sensitive I was to more than the carbs naturally found in non-starchy vegetables and nuts and seeds, I cut out all other sources – including my beloved Hawaiian purple yam and homemade (baked) yam fries…for now, until my blood sugar levels are consistently in the non-diabetic range and my insulin levels, normalized. Even then, I know I will only be able to eat such things once in a while and in small servings, but that’s okay. As one of my sons would say “dying is bad“.
A week ago, I began tracking my carbs (easy to do and requiring no apps – not even a pencil). I aimed to keep them at the same lower levels and as you can see from the graph below, there has been linear decrease in my blood glucose levels at all times of the day – including first thing in the morning, after lunch, after dinner and before bed. It’s only been three weeks!
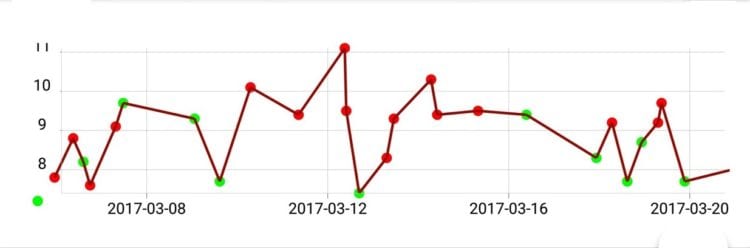
Interestingly, the little ‘spike’ yesterday was in the early morning after – I hadn’t eaten for 12 hours! The effects of cortisol, perhaps?
My body was breaking down the fat I have stored and was converting it into glucose for my blood – a process known as lipolysis. This is a ‘good’ thing. My body was doing exactly what it was designed to do;
(1) store excess glucose as fat, in times of plenty,
(2) break down stored fat for glucose, in lean times.
The issue is, there have been no “lean times”.
Blood Pressure
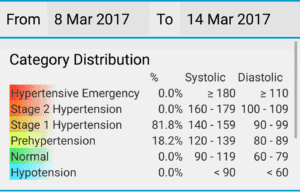
Week One
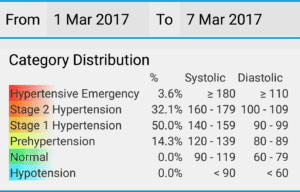
The first week my blood pressure was divided up between
50% Stage 1 hypertension
~30% Sage 2 Hypertension
1 hypertensive emergency (not good!)
<15% pre-hypertension
It was all over the place (very hard on the heart) and the systolic pressure (the first number in a blood pressure) was very high.
After the issue with my eyes (which was non-diet or lifestyle-related) having hypertension (high blood pressure) put me at risk for blindness. I took this very seriously!
Week Two
The second week my blood pressure dropped to;
>80% Stage 1 Hypertension
<20% pre-hypertension
This can largely be explained by the fact that the first thing that happens when we reduce insulin levels (a response to eating low carb) is something called naturesis. That is simply a medical term meaning our kidneys get rid of the excess salt by making us pee a lot. This period usually lasts ~4-10 days following going low carb.
Week Three
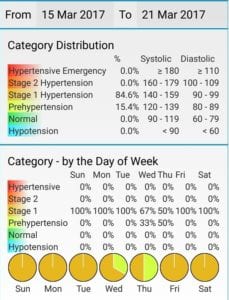
This week my blood pressure was;
~85% Stage 1 Hypertension
~15% pre-hypertension
Yes, it was a tiny bit higher, but very stable.
The first two weeks I ate very low sodium as I usually did, but this week I actually had to start adding salt into my diet as my kidneys had expelled all the excess sodium it was retaining and my sodium levels were too low. I felt a bit lethargic and light-headed. The reading I’ve been doing in the literature and the Conference Proceedings I’ve been watching from some of the world’s leading physicians that treat diseases (such as Diabetes, hypertension / high blood pressure, dyslipidemia / high cholesterol as well as Alzheimer’s and some cancers) using a low carb high fat diet, mentioned this need for increasing sodium after the first 10 days.
A pleasant surprise was seeing my diastolic pressure (the second number in blood pressure) hit normal levels several times.
One of the roles of insulin (besides taking the glucose in our blood and storing it in our livers as glycogen or fat) is to signal the kidney to retain salt. That makes us bloated and causes our blood pressure to go up.
Being Diabetic or insulin resistant (65-75% of people aged 3- 90 years, according to Dr. Joseph Kraft’s robust studies) causes people to retain sodium and raises their blood pressure. Hypertension (high blood pressure) is called “the silent killer” – but much of this is entirely diet related. For the most part, is not too much salt, but too many carbs and too little green leafy veggies (rich in potassium) that underlies high blood pressure.
Anthropometrics
Weight
The first week and a half, my weight dropped ~4 pounds – much of it was water, from my kidneys expelling the excess sodium. My weight didn’t budge for most of the last week and a half, but I didn’t let that discourage me. My body was now burning fat and not carbs and the weight loss necessarily had to follow.
It is now the end of the 3rd week, and I have lost 5 pounds all together.
Waist Circumference
In the first two weeks, I lost 1 inch off my waist and this week, another 1/2 inch came off. That is a very good thing – but for a different reason than I thought.
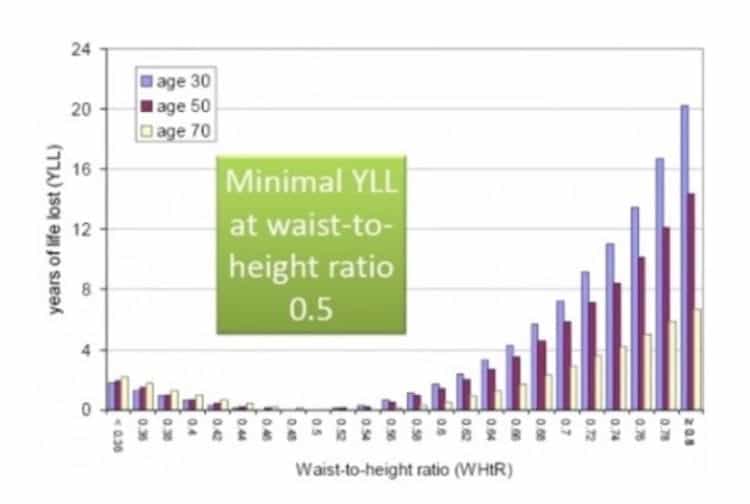
As Dietitians, we were taught that BMI (weight-to-height ratio) and waist-to-hip ratio allows us to factor in the greatest risk of cardiovascular events (heart attacks, strokes) but current research is showing that there is a much better predictor years of life lost (YLL) due to overweight, and that is the waist-to-height ratio.
Most of us have heard that where we carry our fat is even more important than how much of it we actually have. This is true.
Carrying it around the abdomen (belly fat, what Dietitians and Doctors call “central adiposity”) is a greater predictor of cardiovascular risk than BMI (weight to height ratio). Simply put, being an “apple” as opposed to a “pear” is not good.
But what should our waist circumference be?
A meta-analysis from 2012 pooled data from multiple studies which in total looked at more than 300, 000 adults in several ethnic groups, found that Waist to Height Ratio (WHTR) was a far better predictor than BMI or Waist Circumference of cardiovasular of metabolic risk factors in both sexes.
Ashwell M, Gunn P, Gibson S (2012) Waist-to-height ratio is a better screening tool than waist circumference and BMI for adult cardiometabolic risk factors: systematic review and meta-analysis. Obes Rev 13: 275—286
The least amount of years of life lost is associated with a Waist to Height Ratio of 0.5 (mine was not anywhere near that!).

That is, take your height and divide it by 2.
NOTE: Measure your waist at the location that is the mid-point between your last rib and the top of your hip bone, with the front and back of a flexible seamstress-type tape measure at the same height, and your belly fully relaxed. This is not the time to suck it in! If you measure your height in inches, measure your waist in inches and if you measure your height in cm then measure your waist in cm.
If the result of your Waist to Height ratio is greater than 0.5, then welcome to the club. The question is, what to do about it?
That’s where I can help.
Practicing what I preach,
Joy
you can follow me at:
![]() https://www.facebook.com/lchfRD/
https://www.facebook.com/lchfRD/
Note: I am a “sample-set of 1” – meaning that my results may or may not be like any others who follow a similar lifestyle. If you are considering eating “low carb” and are taking medication to control your blood sugar or blood pressure, please discuss it with your doctor, first.
Copyright ©2017 The LCHF-Dietitian (a division of BetterByDesign Nutrition Ltd.)
LEGAL NOTICE: The contents of this blog, including text, images and cited statistics as well as all other material contained here (the ”content”) are for information purposes only. The content is not intended to be a substitute for professional advice, medical diagnosis and/or treatment and is not suitable for self-administration without the knowledge of your physician and regular monitoring by your physician. Do not disregard medical advice and always consult your physician with any questions you may have regarding a medical condition or before implementing anything you have read or heard in our content.