

This content of much this post is based on a presentation titled “A New Hypothesis for Obesity” given by Dr. Michael Eades at the Low Carb Breckenridge Conference, Breckenridge Colorado, Sunday, March 4, 2018. Dr. Eades has been in full time practice of bariatric, nutritional and metabolic medicine since 1986 and is the Director of Medi-Stat Medical Clinics, a chain of ambulatory out-patient family care clinics in central Arkansas. I have added Canadian data and photos for Canadian readers. This article is Part 1 of two on The Evolving Hypothesis of Obesity.
The current ‘obesity epidemic’ is often understood in terms of the change in the percentage of obese people in the US or Canada from the early 1950’s, through the early 1970s until today. In Canada in the early 1960s the obesity rates were 10.2% (~8% of men and ~12% of women) and in the US, obesity rates at that time were 10.7%. From 2007 to 2009, obesity in Canada rose to 24.1% and in the US, rose even more to 34.4%.
In addition to statistics, another way to understand the obesity epidemic is through historical photos. Below is a sorority photo from Louisiana from the 1950s (one of the US States that currently has one of the highest rates of obesity).

What about Canada?
Here’s a photo of what people looked like in 1967, riding the subway in Toronto.

As can be seen in another photo (below) from a Toronto rush hour, young adults, middle aged adults and older people were very slim compared to today’s standards.

In the 1950’s, people in US as in Canada ate carbohydrates at each meal. They ate cereal or toast for breakfast and just about every household had a toaster. Lunch was often sandwiches, as there were no microwaves to heat food up in. Potatoes were a mainstay at dinner, sometimes pasta – yet the majority of young adults and adults were slim. Of course there were always some people that were overweight. Most elementary school classes had one ‘chubby’ kid, but when one looks around the classes of today or on public transit or in stores and supermarkets, most people are considerably heavier than people in the 1950’s and 1960’s.
What happened? What changed?
What caused overweight and obesity to all of a sudden explode in the 1970’s – and just keep rising?
A clue is in the macronutrient intake between 1971 and 2010.

The graph on the left above shows macronutrients (protein, fat and carbohydrate) as a percentage of calories. After 1980, carbohydrate intake went up, fat intake went down and protein remained about the same.
As carbs intake went up and fat went down (protein intake stayed about the same), people began to gain weight. But what caused people to start eating more carbs?
The graph on the right above is much more telling as it shows the macronutrient intake in grams eaten per person per day. There are only two lines on the graph because the amount of fat and the amount of protein are superimposed over each other and appear as one line. The amount of fat (in grams) and the amount of protein (in grams) is approximately 75 g each however keep in mind that fat has 9 calories per gram and protein only has 4 calories per gram. The top line on the graph shows carbohydrate intake in grams and as can be seen around ~1976-1980 carbohydrate intake suddenly skyrocketed by ~ 240 calories per day.
What made people start eating 240 calories more per day in carbohydrate?
More on this in Part 2, but the clue is in the type of fat that people began to eat.
The graph below shows the change in the type of fat that people ate from 1970 to 2010. While the total amount of fat remained relatively constant from 1970 – 2010, there was a significant change in the type of fat that people ate. From 1970 onward, there is a huge increase in the consumption of polyunsaturated vegetable oils.

Breaking these vegetable oils down into specific types of oils, one can see that there is a huge increase in the consumption of soybean oil over this period.

Where does good old Canadian “canola oil” place?

The graph at the top of the illustration below is the same graph as the one above and shows that soybean oil consumption reaches 12 kg per person per year. Looking at the graph below that one, canola oil is less than 1 kg per person per year.
It’s important to remember that the per person consumption of these oils is not only the fats that people buy and use at home, but include the oils used in the food that people eat at restaurants and in pre-made foods, including baked goods. Most oils sold as “vegetable oil” are soybean oil and it finds its way into things we’d never expect to find it in. Read labels more closely and you’ll find it everywhere. It’s in peanut butter and infant formula, most commercial salad dressings, crackers and baked goods, such as muffins. Its what your mayonnaise is made of (even if it says that its “olive oil mayonnaise”) because soybean oil can turn two ounces of olive oil into 500 ml bottle of ‘olive oil’ mayo or salad dressing. These vegetable oils are what potato chips and tortilla chips are fried in and it’s the fat in almost all commercial bread you eat – from burger buns to wraps. It’s everywhere!
While the total amount of fat in the diet hasn’t change over time (1970-2010), the type of fat being eaten is very different! We’re eating MUCH more vegetable oils just as the Dietary Guidelines in Canada and the US have encouraged us to do since the 1970s and at the same time, we’re eating less saturated fat from beef, pork, eggs, butter etc. As will be developed in the second part of this article, this increase in the consumption of vegetable oils and decrease in eating saturated fat has served as two sides of a dual-edged sword that has contributed to the obesity epidemic.
One of the reasons for the huge increase in the consumption of vegetable oils is the number of meals that are eaten away from home, as opposed to cooked at home. In the 1950’s and 1960’s people rarely ate out at restaurants unless there was a special occasion, or they were travelling away from home. Meals at home were cooked from scratch (there were very few ‘convenience foods’) and before the creation of vegetable shortening (Crisco®) people used lard (a saturated fat) in their pies and butter in their cakes. Butter (also a saturated fat) was the used on potatoes and as a spread on bread but with the rationing during World War II, margarine came into use – as did vegetable shortening, which was inadvertently created when extracting fats for the industrial production of soap.
Restaurants in the 1950s and 1960s used either beef tallow or lard in their deep fat fryers, but with the change in the Dietary Guidelines in the 1970s which told us ‘saturated fat was bad for our health’, these natural fats were replaced with industrially produced soybean oil and canola oil which are extracted under high heat and pressure, with the use of solvents, bleaches and deodorizers.
Note: you can squeeze a soybean all day long and you’re not going to get any ‘oil’ out of it – same with a corn kernel or canola (rapeseed). Gently pressing olives or nuts between one’s fingers will extract some oil so one can easily see that these are rich sources of fat. Soybeans, corn and canola require hours of industrial processing (heat, pressure and solvents) to extract ‘oil’. It has long been known that polyunsaturated omega-6 fats compete for binding sites with anti-inflammatory omega-3 fats (from fatty fish and flax seed) and as a result PUFA oils such as soybean oil, corn oil and canola oil promote inflammation in the body.
Approximately 1/2 of meals now are eaten away from home. These could be grabbing a coffee and a pastry at Starbucks® or Tim Hortons®, eating lunch at the work or school cafeteria or picking up ready-made sandwiches at a grocery store. Of course, this amount includes order in pizza and Chinese food, a quick bowl of Pho and any number of snacks bought away from home. The issue with these is the fat used in cooking these foods is now out of our control. Most often, soybean oil is used and behind that, canola.
Let’s take a closer look at these vegetable oils.
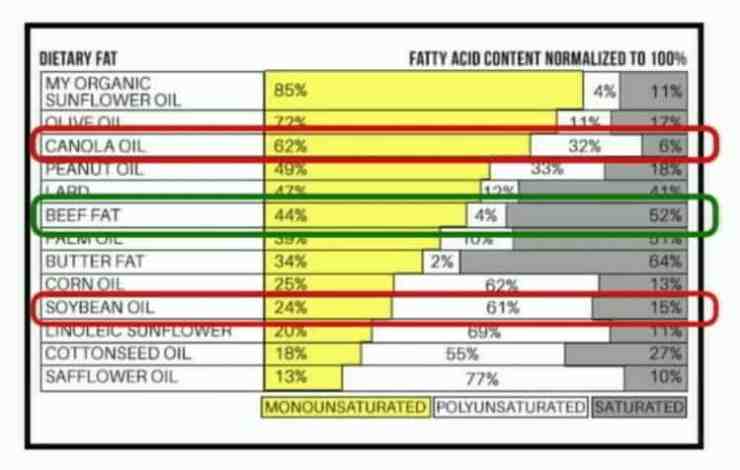
As can be seen from this chart, canola oil is 32% polyunsaturated fatty acids (PUFAs), soybean oil is 61% polyunsaturated fatty acids and beef tallow is only 4% polyunsaturated fatty acids. The issue with oils (which will be presented in part 2 of this article) is that canola oil and soybean oil are very high in linoleic acid.
Reflective of the linoleic content of our diet is that the linoleic acid content of human body fat has also increased in a dramatic linear fashion over the last 50 years. The following graph was created by researcher Dr. Stephan Guyenet, PhD (neurobiology) based on various US studies, each of which is represented by an orange dot.

This graph indicates that as we’ve been eating a lot more linoleic acid in our diet, this is showing up as an increasing amount of linoleic acid in our bodies. Why these polyunsaturated fatty acids (PUFAs) are being taken up so readily will become clear in Part 2 of this post, which will show the proposed mechanism.
Let’s look at the prevalence of obesity among US adults aged 20-74 from 1960-2010. In 1960-1962, obesity rates in the US were 10.7% which is very comparable to the Canadian obesity rates referred to above. From 2007 to 2009 the prevalence of obesity in the US was 34.4%, which is 10% higher than the obesity rate in Canada which was 24.1%.
[www.statcan.gc.ca/pub/82-625-x/2011001/article/11411-eng.htm]

Now let’s compare the above graph on obesity rates to the increased use of vegetable oils over the same period.
The parallel rise in the intake of polyunsaturated fats over the same period is striking, and while we know that “correlation is not causation” (i.e. two things being related does not mean that one causes the other) one must wonder if these two factors are related, and if so, how.
The proposed mechanism between the rise in obesity and the rise in the use of polyunsaturated fats (such as soybean oil, canola oil and corn oil) is covered in Part 2, The Evolving Hypothesis of Obesity – how polyunsaturated fats (PUFAs) make us fat.
To our good health,
Joy
You can follow me at:
![]() https://www.facebook.com/lchfRD/
https://www.facebook.com/lchfRD/
Copyright ©2018 The LCHF-Dietitian (a division of BetterByDesign Nutrition Ltd.)
LEGAL NOTICE: The contents of this blog, including text, images and cited statistics as well as all other material contained here (the ”content”) are for information purposes only. The content is not intended to be a substitute for professional advice, medical diagnosis and/or treatment and is not suitable for self-administration without the knowledge of your physician and regular monitoring by your physician. Do not disregard medical advice and always consult your physician with any questions you may have regarding a medical condition or before implementing anything you have read or heard in our content.
Reference
Dr. Michael Eades – A New Theory of Obesity, Low Carb Breckenridge, March 4, 2018 (NOTE: here is a similar talk given a Low Carb Down Under on August 11, 2018 and published on YouTube, called A New Hypothesis of Obesity.)