
In my last post, I shared some infographics developed by Dr. David Unwin, a UK General Practitioner that help communicate the concept of Glycemic Index (GI) & specifically Glyemic Load (GL) in terms of how they impact blood sugar compared to teaspoons of ordinary table sugar.
Below is one of those infographics;
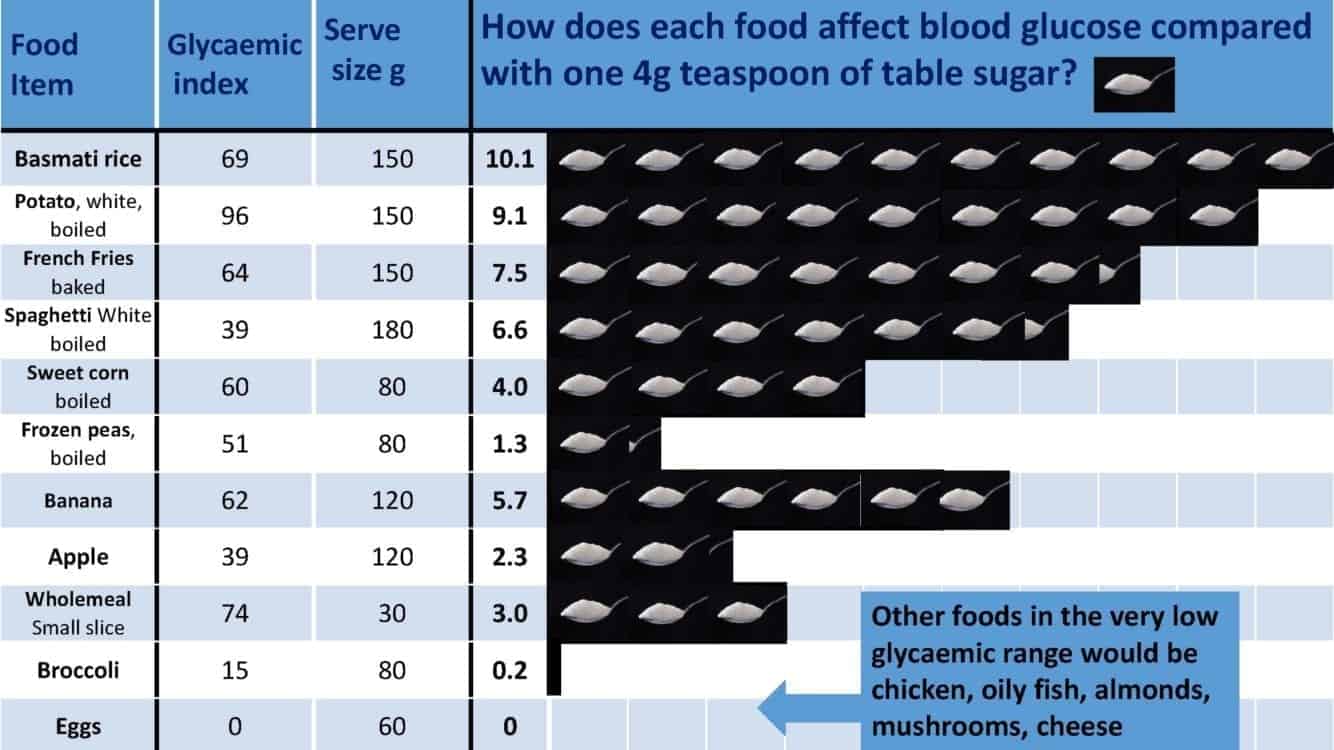
Glycemic Response Represented as Teaspoons of Sugar
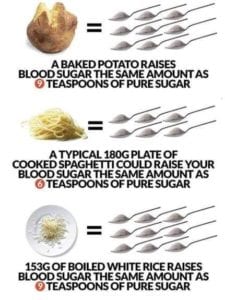
The infographic to the left has been making the rounds recently on social media and is based on the idea that high Glycemic Index (GI) foods can be represented by the effect those foods have on people’s blood sugar, compared to teaspoons of sugar.
It is not dissimilar to the infographic that I designed below for the previous article , based on Dr. Unwin’s work (1). 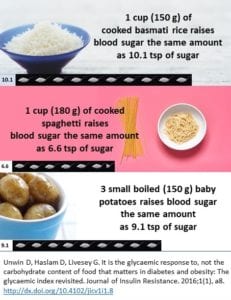
The problem is, these tools are only as useful as Glycemic Index is reliable, so the questions is, is GI (and GL which is derived from it) reliable for predicting blood sugar response?
That is, if the Glycemic Index (GI) values (1) change between individuals for the same amount of the same food or (2) if they change value within the same individual when they are assessed at different times, then they cannot be relied on to predict blood sugar response in an individual.
Is Glycemic Index Reliable for Predicting Blood Sugar Response?
A study published in the American Journal of Clinical Nutrition (2) reported that individual response to individual carbohydrate-containing food vary so much that Glycemic Index values may not be useful in indicating blood sugar response in individuals.
The Study
Randomized, controlled, repeated tests on 63 healthy adults participated in 6 testing sessions over a twelve week period and fasted and abstained from exercise and alcohol before each session.
During each session participants ate either (1) white bread (test food) or (2) a standardized glucose drink (reference control).
Blood sugar values were measured at several points over the next 5 hours, and Glycemic Index was derived by testing the test food and reference in the same participant according to standard method. This is usual practice to control for the variability between people which may be caused by biological differences.
Results
Out of the 63 participants, in 22 participants blood sugar response was classified as “low”, in 23 participants it was classified as “medium” and in 18 participants it was classified as “high’ for the same amount of bread. That is, white bread fell in all three Glycemic Index categories with different individuals.
In addition, responses within the same individual varied by as much as 60 points between tests.
Interpretation of the Results
The study indicated (as I also covered in a previous two-part post on the effect of food processing on blood sugar response) that blood glucose response is affected by differing physical structure of similar foods, the effect of food processing and preparation methods, as well as meal consumption patterns (single or mixed meals).
The study authors concluded that the high inter- (between people) and intra-individual (within the same person) variation that was observed in the GI value of foods essentially resulted in the results being of no practical value.
“In summary, our data indicate substantial variability in GI value determinations for white bread despite the use of standardized methodology and multiple testing in a large number of healthy volunteers. The high degree of variability demonstrates that there is potential to misclassify foods into the 3 commonly used GI categories (low, medium, and high), which would result in the inability to distinguish between foods, thus invalidating the practical applicability of the GI value.“
The authors also indicated that this variability was also partly explained by differences in baseline HbA1c (i.e. glycated hemoglobin) which is an estimate of 3 month average of blood glucose control, as well as the insulin index (the differing insulin response to foods which was covered in this previous article), which both affect the GI value.
Individual Glycemic Response
It should be noted that inter-individual and intra-individual variation in glycemic response isn’t only to white bread, as in this small study.
A 2015 study from Israel (3) involving 800 people who were monitored with continuous glucose monitors (CGMs) indicates that there isn’t a universal’ blood sugar response to either low Glycemic Index foods or high Glycemic Index foods — that glycemic (blood sugar) response is very individual.
“We continuously monitored week-long glucose levels in an 800-person cohort, measured responses to 46,898 meals, and found high variability in the response to identical meals, suggesting that universal dietary recommendations may have limited utility.”
Some Final Thoughts…
One cannot reliably predict that a specific amount of carbohydrate-based food will raise a person’s blood sugar the same amount as a certain number of teaspoons of sugar, because each carbohydrate-based food will have different effects on different people, and different effects within the same individual at different points in time.
More Info?
If you would like to know how to determine how you respond to specific carbohydrate based foods and how to know which carbohydrate-based foods spike your blood sugar and which don’t, I can help.
You can learn more about my services including individual hourly appointments and packages under the Services tab or in the Shop.
If you have questions, please feel free to send me a note using the Contact Me form above and I will reply as soon as I can.
To your good health!
Joy
You can follow me on:
Twitter: https://twitter.com/lchfRD
Facebook: https://www.facebook.com/lchfRD/ Instagram: https://www.instagram.com/lchf_rd
Copyright ©2019 The LCHF-Dietitian (a division of BetterByDesign Nutrition Ltd.)
LEGAL NOTICE: The contents of this blog, including text, images and cited statistics as well as all other material contained here (the ”content”) are for information purposes only. The content is not intended to be a substitute for professional advice, medical diagnosis and/or treatment and is not suitable for self-administration without the knowledge of your physician and regular monitoring by your physician. Do not disregard medical advice and always consult your physician with any questions you may have regarding a medical condition or before implementing anything you have read or heard in our content.
Reference
- Unwin D, Haslam D, Livesey G. It is the glycaemic response to, not the carbohydrate content of food that matters in diabetes and obesity: The glycaemic index revisited. Journal of Insulin Resistance. 2016;1(1), a8. http://dx.doi.org/10.4102/jir.v1i1.8
- Matthan NR, Ausman LM, Meng H, Tighiouart H, Lichtenstein AH. Estimating the reliability of glycemic index values and potential sources of methodological and biological variability. Am J Clin Nutr. 2016;104(4):1004—1013. doi:10.3945/ajcn.116.137208
- Zeevi D, Korem T, Zmora N, et al. Personalized Nutrition by Prediction of Glycemic Responses. Cell. 2015 Nov 19;163(5):1079-1094.