Evolving Theory of Obesity – a combination of refined carbs and industrial seed oils

Three years ago, my theory about the roots of the current obesity and Diabetes epidemic was simple. I believed that it was largely a matter of us eating too many carbs while having reduced the amount of healthy fat we ate. I now think it is a little more subtle than that, and that it is specifically the combination of a diet too high in refined carbs while high in industrial seed oils (such as soybean and canola oil) that underlies the issue.

When I first started reading and writing about the current obesity and Diabetes epidemic, my thoughts were summarized in two articles written in May and June of 2015. In the first article, I documented how in 1970-72 only 6% of men and 11.7% of women were considered obese (Body Mass Index > 30) in Canada, but by 2013 obesity in men had tripled to 20.1% in men and to  17.4% in women. In the second article, I explained how the changes in the obesity rates coincided with the changes in the Dietary Recommendations that began in 1977 and continued in 1982, 1992 and 2005 and which encouraged people to eat considerably more carbs and a lot less fat coincided with the increased obesity rates, and that the increasing rates of Type 2 Diabetes (9.4% in 2014 in Canada) was just a natural outworking of the higher obesity rates.

The problem was, I really didn’t know of any specific mechanisms that related one to the other.

Now I know of several.

This article summarizes my current theory of obesity, as it relates to previous articles and a brand new study published last week.

Correlation is not Causation

There’s an expression in science is that “correlation is not causation”.

That is, the fact that a dramatic increase in obesity rates correlates (or coincides) with the changes in the Dietary Recommendations doesn’t mean that the Dietary Recommendations ’caused’ the obesity epidemic or the Diabetes epidemic.

One can hypothesize that there is a relationship between these two things, but without some understanding of the mechanism and more data, we don’t know what this relationship might be.

From the reading I have been doing the last number of years, I have some ideas of some of what may be involved.

Evolution of the Theory

A presentation at a conference at the beginning of March (documented in  two previous articles) got me thinking that the picture was bigger than just “too many carbs” and a “decrease in the satiety effect of saturated fat” from full fat milk, cheese and butter. I was challenged by the fact that in the late 1960s and early 1970s, people in the US and Canada were generally slim, despite eating carbohydrates at just about every meal;

“They ate cereal or toast for breakfast and just about every household had a toaster. Lunch was often sandwiches, as there were no microwaves to heat food up in. Potatoes were a mainstay at dinner, sometimes pasta — yet the majority of young adults and adults were slim. Of course there were always some people that were overweight. Most elementary school classes had one chubby’ kid, but when one looks around the classes of today or on public transit or in stores and supermarkets, most people are considerably heavier than people in the 1950’s and 1960’s”

(from A New Hypothesis for Obesity Part 1)

The question was raised ‘what resulted in overweight and obesity all of a sudden exploding in the 1970’s and just keep rising?’

What changed?

We knew that (based on US data) people began eating ~240 calories a day more as carbohydrate but what was causing them to do this? Was it just because the Dietary Recommendations were encouraging us to eat more carbohydrate or was there something else going on?

Not More Fat but the Type of Fat

While people were eating more carbohydrate, neither people in Canada nor the US were eating more fat, but the type of fat we’ve been eating since the 1970s has changed substantially. This tweaked my interest.

We’d reduced our intake of saturated fat (because the “Diet-Heart Hypothesis” had told us they were the “cause of cardiovascular disease”) and we dutifully ate more and more of ‘polyunsaturated fats’ / vegetable oils  which as I wrote about previously are more appropriately called “industrial seed oils”.  These oils, including soybean, corn oil and canola oil contain high amounts of linoleic acid which is at the very top of the omega 6 (n-6) pathway and these fats which elongate to arachidonic acid are pro-inflammatory products in nature.

There is nothing inherently ‘bad’ about linoleic acid which is found naturally in nuts and seed oils, including walnut, macadamia and sesame oil, but it is the sheer amount of these industrial seed oils which suddenly became excessive in our diet, which I think may be a significant factor.  These fats are in our bread, pastries, salad dressing, margarine and even our peanut butter.  Canned fish is packed in it, our mayonnaise is made from it and everything we eat that is fried from a restaurant is bathed in these industrial seed oils. On top of that, many of us use it our own homes to cook with.

So many of the foods we now eat are prepared with soybean or canola oil and as a result, we consume a much greater amount of linoleic acid than our body ever evolved to handle.

As outline in previous articles, these oils are much more unstable than the saturated fats they were created to replace. What I mean by ‘unstable’ is that they are more easily oxidized – that is, when industrial seed oils are heated in the making of commercial foods using them or in cooking, they react with oxygen in the air to form toxic substances including  aldehydes  and lipid peroxides.  When these oils are heated, they produce oxidized metabolites which have been also been implicated in the development of a variety of conditions, including non-alcoholic fatty liver disease (NAFLD), cardiovascular disease and cancer and it has been proposed that inflammation is involved in the development of Type 2 Diabetes and metabolic syndrome, as well.

Also as written about previously, cardiolipin  is an important component of the inner membrane of the mitochondria (the so-called “powerhouse of the cell”) and the fats that make up cardiolepin change, depending on the types of fats in the diet. That is, the fatty acid composition of cardiolepin is altered by us eating a diet high in linoleic acid, such as soybean and canola oil. This past week a study about cardiolepin was published that added a very interesting piece to my evolving theory of the obesity and Type 2 Diabetes epidemic.

In this new study, researchers at the University of Copenhagen found that when large amounts of cardiolipin are produced in ‘brown fat’ cell mitochondria, there is much stronger calorie-burning. Conversely, when there are low amounts of cardiolepin in brown fat, there is much less calorie-burning. Low amounts of cardiolepin and less calorie-burning in brown fat was reported to be associated with obesity and Type 2 Diabetes [1].

Note: “Brown fat” is a specialized type of fat that burns fat, rather than stores it and cardiolepin acts like a kind of on-off switch for the activity in our brown fat.

This study got me thinking that since it is known that the fatty acid composition of cardiolepin changes according to the fatty acid composition of the diet (covered in previous blogs), what effect has the massive increase in linoleic acid intake in the diet in both Canada and the US had on the function of the cardiolipin?

Could it be that a shift in the types of fats that make up cardiolepin in brown fat stemming from a very high linoleic acid intake from industrial seed oils has had a similar effect as an absolute decrease in cardiolepin – and that this is somehow related to the increase in obesity and Type 2 Diabetes?

Type of Fats and Refined Carbohydrates

My theory of obesity has evolved and will likely continue to evolve. I don’t think that increased carbohydrate consumption based on changes in the Dietary Recommendations in the late 1970s / early 1980s in and by itself resulted in the obesity epidemic and huge increase in Type 2 Diabetes we see now.

I currently believe that the introduction of these manufactured industrial seed oils (soybean, canola, corn) that were created in the 1970s and meant to replace saturated fat in the diet (presumably to protect people from heart disease!) may be part of the initiation of the disease process.

As documented in earlier articles, we know that these fats are easily oxidized, have a direct impact on increasing inflammation and triggering the disease generation process in several health conditions and on acting on the endo-cannibinoid receptors in the body, in much the same way as cannabis (marijuana).  Could it be that these created oils that are very high in the average Western diet actually lead people to consuming more and more carbohydrate-based foods; foods that often comes liberally bathed in more industrial seed oils?

The mechanism of how the above might work was presented in an earlier article and had to do with how energy is generated in the electron transport chain of the mitochondria being different for saturated fats and unsaturated fats.

There are several possible mechanisms that may link consumption of these novel fats to obesity and development of Type 2 Diabetes (oxidation, inflammation, food cravings) and now based on this new study, the possibility of an increase in linoleic acid content in cardiolepin and it’s effect on fat burning.

It will take years more research before we have a fuller picture, so what do we do in the meantime?

Sensible Recommendations based on the Current Knowledge

For someone who is metabolically healthy (i.e. does not have Type 2 Diabetes or Insulin Resistance, hypertension or high cholesterol), it would seem that a whole-foods approach combined with avoiding omega – 6 industrial seed oils such as soybean, canola and corn oil combined with being mindful of the amount and type of carbohydrate in the diet may be sufficient to avoid developing these chronic diseases. Such a scenario would not be unlike the diet of the average American or Canadian in the 1950s and 60s. Not that that diet was that healthy, when compared with a classic Mediterranean diet, Japanese or Okinawan-style diet, or a whole food low-carbohydrate diet. These, it would seem offer a much healthier alternative.

For those who are already are insulin resistant or been diagnosed with Type 2 Diabetes, avoiding industrial seed oils would prudent and eating naturally-obtained vegetable fats such as olive oil or avocado oil instead. Since it does not seem that studies clearly support that saturated fat causes heart disease and not simply increase in surrogate markers of heart disease such as higher LDL (which LDL subfraction?), it would seem that using modest quantities of real butter is preferable to eating margarine made from industrial seed oils. It would also seem that at least initially, eating a diet where the amount and type of carbohydrate is kept to a quantity that does not trigger large amounts of insulin release or spike blood glucose makes good sense. As I wrote about recently, with the availability of Continuous Glucose Monitoring (CGM), this approach can be tailored to each individual person’s response to specific foods. We are no longer reliant on Glycemic Index or Glycemic Load, which are derived from healthy people’s response to foods, not those with Type 2 Diabetes. A suitable diet could be expressed as a variety of different lifestyles (just as for the healthy individual) including a Mediterranean diet, Okinawan-style diet, or whole food low-carbohydrate diet – with carbohydrate levels tailored on an individual basis, based on glycemic response and insulin levels.

Whether a person is healthy or metabolically unwell, based on the studies I have read and some of the mechanisms that have come to light, I can see no benefit in people eating either industrial seed oils or refined, processed carbohydrates. There is every reason to believe that both of these may have been part of the underlying cause of the current obesity and Type 2 Diabetes epidemic.

Unrefined Carbohydrates and Healthy Fats

If someone is metabolically healthy, I recommend eating minimally processed carbohydrates as they reduce the ‘incretin effect’ of hormones such as GIP, GLP-1 and GLP-2 that are released in the intestine and trigger the release of insulin from the pancreas beta-cells. Eating minimally processed carbs would result in less triggering of the release of insulin, thus reducing the likelihood of developing either insulin resistance or Type 2 Diabetes.

If someone is already insulin resistant or has Type 2 Diabetes, it seems from recent studies that minimizing carbohydrate initially, along with weight loss and some forms of activity may be at least as good if not more beneficial than a low-fat calorie-restricted diet. Certainly, many people find they are a lot less hungry eating a low carbohydrate whole foods diet and are easily able to stick with it long term (a year or two in studies), allowing for a period of improving insulin sensitivity and lower overall blood sugar levels. It certainly has been demonstrated to be safe and effective in periods up to two years.

For both those that are metabolically healthy or insulin resistant or have Type 2 Diabetes, avoiding industrial seed oils makes good sense, for all the reasons outlined above.

What about your specific situation?

Do you have questions about the type and amount of carbohydrates that are most suitable for you based on your health and family history? What about which fats are are the best choices given your lifestyle?

I can help.

Please feel free to send me a note using the “Contact Me” form located on the tab above to find out how I can support your needs and I will reply as soon as possible. Remember, I provide both in-person services and am experienced providing services via Distance Consultation (telephone or Skype).

To your good health!

Joy

You can follow me at:

 https://twitter.com/lchfRD

  https://www.facebook.com/lchfRD/

Reference

Sustarsic EG, Ma T, Lynes MD et al, Cardiolipin Synthesis in Brown and Beige Fat Mitochondria Is Essential for Systemic Energy Homeostasis,
Cell Metabolism (2018), https://doi.org/10.1016/j.cmet.2018.05.003

Copyright ©2018 The LCHF-Dietitian (a division of BetterByDesign Nutrition Ltd.)

LEGAL NOTICE: The contents of this blog, including text, images and cited statistics as well as all other material contained here (the ”content”) are for information purposes only.  The content is not intended to be a substitute for professional advice, medical diagnosis and/or treatment and is not suitable for self-administration without the knowledge of your physician and regular monitoring by your physician. Do not disregard medical advice and always consult your physician with any questions you may have regarding a medical condition or before implementing anything  you have read or heard in our content.


Diabetes Canada 2018 Clinical Practice Guidelines – option of a low carb diet


Diabetes Canada has released their long-awaited 2018 Clinical Practice Guidelines [1] which affirms that nutrition therapy is an integral part of people’s self-management of their Diabetes, as well as part of the treatment for the disease.  One of the main goals of nutrition therapy is to maintain or improve the quality of life and nutritional and physical health of those with the disease, while preventing the need to treat both sudden (acute) and long term complications. Effective nutrition therapy can improve blood sugar control, including reducing three-month average blood glucose (i.e. HbA1C, glycated hemoglobin) by 1.0% to 2.0%.

Diabetes Canada 2018 Clinical Practice Guidelines

The new Guidelines mention that since Canada has wide ethnic and cultural diversity, with each group having their distinct foods, preparation methods, and dietary patterns and lifestyles. Effective nutritional therapy needs to take these cultural variations into account and needs to be individualized;  specific to the individual, their age, the duration they’ve had type 2 diabetes, their goals, personal values and preferences, along with their individual need, lifestyle and economic situation. They recognize that nutrition therapy for those with Diabetes is not “one-size-fits-all”.

“Nutrition therapy should be individualized, regularly evaluated, reinforced in an intensive manner and should incorporate self-management education. A registered dietitian (RD) should be involved in the delivery of care wherever possible.”

The Nutrition Therapy Guidelines recommend that those with Diabetes follow the recommendations of Eating Well with Canada’s Food Guide;

“The starting point of nutrition therapy is to follow the healthy
diet recommended for the general population based on Eating Well With Canada’s Food Guide.”

They recommend that those with Diabetes continue to eat 45% to 65% of their daily calories as carbohydrate, 10% to 35% of their daily calories as protein and only 20% to 35% of their daily calories as fat, yet at the same time say that “the ideal macronutrient distribution for the management of diabetes can be individualized”;

“The ideal macronutrient distribution for the management of diabetes can be individualized. Based on evidence for chronic disease prevention and adequacy of essential nutrients, the DRIs (Dietary Reference Intakes) recommend acceptable macronutrient distribution ranges (AMDRs) for macronutrients as a percentage of total energy. These include 45% to 65% energy for CHO, 10% to 35% energy for protein and 20% to 35% energy for fat.”

They recommend that those with Diabetes continue to follow the same macronutrient distribution (percent of carbs, protein and fat) as the general population because it

“may help a person attain and maintain a healthy body weight while ensuring an adequate intake of carbohydrate (CHO), fibre, fat, protein, vitamins and minerals.”

What is encouraging is that they also have said that there is evidence to support a number of other macronutrient-, food- and dietary pattern-based approaches and advise against any rigid adherence to any one approach;

“There is evidence to support a number of other macronutrient-, food- and dietary pattern-based approaches. As evidence is limited for the rigid adherence to any single dietary approach, nutrition therapy and meal planning should be individualized.”

These Guidelines leave it open to individuals to choose other dietary approaches and outline a number of those approaches in the body of the text and in a summary table (Table 1). Figure 1 and Figures 2 and Table 1 in the Clinical Practice Guidelines (below) present an algorithm that summarizes the approach to nutrition therapy for diabetes which includes;

“allowing for the individualization of therapy in an evidence-based framework”.

Figure 1 – Clinical Assessment – Diabetes Canada 2018 Clinical Practice Guidelines

Figure 2 – Stage Targeted Nutrition Flowchart – Diabetes Canada 2018 Clinical Practice Guidelines

Table 1:

Table 1: Properties of Dietary Intervention – Diabetes Canada 2018 Clinical Practice Guidelines

The new Diabetes Canada guidelines recognize that the ideal macronutrient distribution (the ratio of carbs, protein and fat) may vary and depend on, amongst other things, the individual’s values and preferences;

“The ideal macronutrient distribution for the management of diabetes may vary, depending on the quality of the various macronutrients, the goals of the dietary treatment regimen and the individual’s values and preferences.”

That is, they recognize that a person’s individual preference for the amount and type of protein (animal-based, plant-based, both), fat (from animal or plant based sources), as well as the amount and type of carbohydrate in their diet factors into their personal decision for how they choose to manage their diabetes.

The Clinical Practice Guidelines for Nutrition Therapy mentions that based on the 3 systematic and meta-analysis of controlled trials of carbohydrate restricted diets that they looked at (mean carbohydrate intake from 4% to 45% of total daily energy) that consistent improvements in HbA1C, lipids and blood pressure weren’t shown.

“As for weight loss, low-carbohydrate diets for people with type 2 diabetes have not shown significant advantages for weight loss over the short term. There also do not appear to be any longer-term advantages.”

So while they do not believe based on the few studies that they examined that there is any advantage to someone following a low carbohydrate diet, there are no clear disadvantages. It comes down to individual preference.

The Guidelines also highlight that there may be a benefit of substituting monounsaturated fat (MUFAs) such as is found in olive oil for carbohydrate (something I regularly do when I design Meal Plans) and that systematic review and meta-analysis of randomized controlled trials found that monounsaturated fat substituted calorie for calorie for carbohydrate did not reduce HbA1C, but did improve fasting blood glucose, body weight, systolic BP, triglycerides and HDL (so-called “good cholesterol”) in people with type 2 diabetes over an average follow up of 19 weeks.

Another finding they reported is that replacement of refined high glycemic index carbohydrates with monounsaturated fat (up to 14.5% total energy) or nuts (up to 5% total energy) has been shown to improve HbA1C and lipids in people with type 2 diabetes over a 3 month period.

Together, these findings provide support to those who prefer to replace high glycemic carbs in their diet (such as white bread, pasta and rice) with monounsaturated fat sources such as olives, avocado as well as some nuts.

The new Clinical Practice Guidelines outline several popular weight-loss diets highlighting that there are a “range of macronutrient profiles are available to people with diabetes”;

“Numerous popular weight-loss diets providing a range of macronutrient profiles are available to people with diabetes. Several of these diets, including the Atkins™, Zone™, Ornish™, Weight Watchers™ and Protein Power Lifeplan™ diets, have been subjected to investigation in longer-term, randomized controlled trials in participants with overweight or obesity that included some people with diabetes, although no available trials have been conducted exclusively in people with diabetes.

They say that a systematic review and meta-analysis of four trials of the Atkins™ diet and 1 trial of the Protein Power Lifeplan™ diet showed that these diets were no more effective than conventional energy-restricted, low-fat diets in inducing weight loss, or with improvements in triglycerides and HDL for up to one year and have been reported to increase total cholesterol and LDL. As mentioned in an earlier article, without differentiating between particle size of LDL (small, dense versus large, fluffy), LDL and total cholesterol going up has not real meaning.

The Guidelines also mentioned that “The Dietary Intervention Randomized Controlled Trial (DIRECT) showed that the Atkins™ diet produced weight loss and improvements in the lipid profile compared with a calorie-restricted, low-fat conventional diet; however, its effects were not different from that of a calorie-restricted Mediterranean-style diet at two years.”

They add that “another trial comparing the Atkins™, Ornish™, Weight Watchers™ and Zone™ diets showed similar weight loss and improvements in the LDL:HDL ratio without effects on fasting blood sugar at one year in participants with overweight or obesity, of whom 28% had diabetes.

So again, it comes down to a matter of choice as to whether someone would prefer to do a calorie-restricted weight loss diet or a well-designed low carb one.

At the end of the paper, the authors make their final recommendations, some of which include that;

“People with diabetes should receive nutrition counselling by a registered dietitian to lower A1C levels and to reduce hospitalization rates”.

“Individuals with diabetes should be encouraged to follow Eating Well with Canada’s Food Guide in order to meet their nutritional needs.”

“In people with overweight or obesity with diabetes, a nutritionally balanced, calorie-reduced diet should be followed to achieve and maintain a lower, healthier body weight”.

“An intensive healthy behaviour intervention program, combining dietary modification and increased physical activity, may be used to achieve weight loss, improve glycemic control and reduce CV risk.”

“In adults with diabetes, the macronutrient distribution as a percentage of total energy can range from 45% to 60% carbohydrate, 15% to 20% protein and 20% to 35% fat to allow for individualization of nutrition therapy based on preferences and treatment goals.”

“People with type 2 diabetes should maintain regularity in timing and spacing of meals to optimize glycemic control.”

“To reduce the risk of cardiovascular disease, adults with diabetes should avoid trans fatty acids and consume less than 9% of total daily energy from saturated fatty acids, replacing these fatty acids with polyunsaturated fatty acids, particularly mixed n-3 / n-6 sources, monounsaturated fatty acids from plant sources, whole grains or low glycemic index carbohydrates”

“Adults with diabetes should select carbohydrate food sources with a low-GI to help optimize glycemic control to improve LDL and to decrease cardiovacular risk.”

“The following dietary patterns may be considered in people with type 2 diabetes, incorporating patient preferences, including:

(a) Mediterranean-style dietary pattern to reduce major cardiovascular events and improve glycemic control.

(b) Vegan or vegetarian dietary pattern to improve glycemic control and reduce myocardial infarction risk.

(c) DASH dietary pattern to improve glycemic control and reduce major cardiovascular events.

(d) Dietary patterns emphasizing dietary pulses (e.g. beans, peas, chickpeas, lentils) to improve glycemic control, systolic BP and body weight.

(e) Dietary patterns emphasizing fruit and vegetables to improve glycemic control and reduce CV mortality.

(f) Dietary patterns emphasizing nuts to improve glycemic control and LDL cholesterol.

Funding sources for the three authors of the Nutrition Therapy guidelines were as follows; Dr. John L. Sievenpiper, MD, PhD; Canadian Institutes of Health Research (CIHR), Calorie Control Council, INC International Nut and Dried Fruit Council Foundation, The Tate and Lyle Nutritional Research Fund at the University of Toronto, The Glycemic Control and Cardiovascular Disease in Type 2 Diabetes Fund at the University of Toronto (a fund established by the Alberta Pulse Growers), PSI Graham Farquharson Knowledge Translation Fellowship, Diabetes Canada Clinician Scientist Award, Banting & Best Diabetes Centre Sun Life Financial New Investigator Award, and CIHR INMD/CNS New Investigator Partnership Prize; grants and non-financial support from American Society for Nutrition (ASN), and Diabetes Canada; personal fees from mdBriefCase, Dairy Farmers of Canada, Canadian Society for Endocrinology and Metabolism (CSEM), GI Foundation, Pulse Canada, and Perkins Coie LLP; personal fees and non-financial support from Alberta Milk, PepsiCo, FoodMinds LLC, Memac Ogilvy & Mather LLC, Sprim Brasil, European Fruit Juice Association, The Ginger Network LLC, International Sweeteners Association, Nestlé Nutrition Institute, Mott’s LLP, Canadian Nutrition Society (CNS), Winston & Strawn LLP, Tate & Lyle, White Wave Foods, and Rippe Lifestyle, outside the submitted work; membership in the International Carbohydrate Quality Consortium (ICQC) and on the Clinical Practice Guidelines Expert Committees of Diabetes Canada, European Association for the study of Diabetes (EASD), Canadian S74 J.L. Sievenpiper et al. / Can J Diabetes 42 (2018) S64—S79 Cardiovascular Society (CCS), and Canadian Obesity Network; appointments as an Executive Board Member of the Diabetes and Nutrition Study Group (DNSG) of the EASD, Director of the Toronto 3D Knowledge Synthesis and Clinical Trials foundation; unpaid scientific advisor for the Food, Nutrition, and Safety Program (FNSP) and the Technical Committee on Carbohydrates of the International Life Science Institute (ILSI) North America; and spousal relationship with an employee of Unilever Canada. Dr. Chan reports grants from Danone Institute, Canadian Foundation for Dietetic Research, Alberta Livestock and Meat Agency, Dairy Farmers of Canada, Alberta Pulse Growers, and Western Canada Grain Growers. Dr. Catherine B Chan has a patent No. 14/833,355 pending to the United States. Dr. Catherine Freeze, MEd, RD reports personal fees from Dietitians of Canada and Government of Prince Edward Island.

Some Final Thoughts…

Much of the same wording  regarding supporting individual preference was previously embodied in the 2013 Clinical Practice Guidelines of the Canadian Diabetes Association. While not “recommended”, there was previously the same option for individuals to choose to follow a low carb lifestyle, based on personal preference.

As a Dietitian, I keep reading and reviewing the literature in order to provide the most current, evidence-based low carbohydrate diet to support those that choose to follow a low carb lifestyle — or who’s doctors recommend that they do, and in this way allow for the individualization of nutrition therapy in an evidence-based framework.

Do you have questions as to how I can help support your preference to follow a low carb lifestyle? Please send me a note using the “Contact Me” form on this web page and I’ll reply as soon as possible.

To our good health,

Joy

You can follow me at:

 https://twitter.com/lchfRD

  https://www.facebook.com/lchfRD/


References

  1. Sievenpiper JL, Chan CB, Dwortatzek PD, Freeze C et al, Nutrition Therapy – 2018 Clinical Practice Guidelines, Canadian Journal of Diabetes 42 (2018) S64—S79 http://guidelines.diabetes.ca/docs/CPG-2018-full-EN.pdf

Copyright ©2018  The LCHF-Dietitian (a division of BetterByDesign Nutrition Ltd.) 

LEGAL NOTICE: The contents of this blog, including text, images and cited statistics as well as all other material contained here (the ”content”) are for information purposes only.  The content is not intended to be a substitute for professional advice, medical diagnosis and/or treatment and is not suitable for self-administration without the knowledge of your physician and regular monitoring by your physician. Do not disregard medical advice and always consult your physician with any questions you may have regarding a medical condition or before implementing anything  you have read or heard in our content.

Time Frame of an Epidemic

It occurred to me that the time frame for an epidemic to occur is absolutely critical in determining public response. If rates of a disease went from 1 in 10 people to 1 in 3 people in only 10 years, there would be public outcry for scientists to determine the cause and to find a cure quickly. If the disease caused debilitating metabolic effects such as very high blood pressure that resulted in heart attacks or strokes and people of all ages were getting this disease, with many dying – the outcry would be even more urgent.

But what if rates of the same disease went from 1 in 10 people to 1 in 3 people over a period of 40 or 50 years? The current generation would have no recollection of what it was like ‘before’ because things had always been this way since they were kids.  The older generation would remember what it was like ‘before’ and concluding that for whatever reason, that is the way it is now. Doctors and scientists of the older generation that might be able to apply their knowledge and skill to find the cause and a cure would be at the end of their working lives.

The disease is obesity.

Debilitating metabolic side effects of obesity include very high blood pressure that can lead to heart attacks and strokes and Type 2 Diabetes which can result in blindness, amputations and organ failure.

Once a rare disease, obesity has now reached epidemic proportions and the metabolic side effects are not just for the old, but are rampant among youth and young adults.

This disease epidemic has taken place over 50 years but few are noticing because it has fallen between the cracks of time.

Obesity Rates Then and Now

Photographs and videos of what people looked like fifty years ago are widely available, and a simple Google search will provide an abundance of them. Movies, documentaries and TV shows from the mid-1960s also provide a glimpse of what the average American and average Canadian looked like then.

In the 1960s only 10.7% of the US population and 10.2% of the Canadian population were obese; that’s approximately 1 in 10 people.

Below is a US sorority photo of a Sigma Iota Chi chapter from West Virginia from 1967. Look how slim most of the women are compared to today’s young adults.

SIX 1967.png
Sigma Iota Chi Sorority – West Virginia – 1967 (https://sororityhistories.wordpress.com/tag/sigma-iota-chi/)

West Virginia now has one of the highest adult obesity rate in the US.

Related image
1967 Kappa Alpha Fraternity Party Photograph – Cornell University

To the left is another photo from a 1967 Fraternity party at Cornell University. For the most part, the young men and their girlfriends are slim and lean – certainly much slimmer than university students today.

Below is what the average city-dwelling Canadian looked like in 1967, riding the subway in Toronto. Young adults, middle aged adults and older people were very slim compared to today’s standards – especially when compared to what the average public transit rider looks like today.

toronto subway rush hour

Most recent international data from 2015 found that 38.2% of the US population and 25.8% of the Canadian population are obese; that’s more than 1 in 3 people in the US and more than 1 in 4 people in Canada [1].

People in both countries are now some of the most obese in the world;

OECD Health Statistics 2017, June 2017

When one compares what university students looked above to what they look like now in a current photo of Fraternities and Sororities below, the difference in average body weight of the students from 50 years ago to today is quite apparent – despite the fact that university students come from families where the average family income is significantly higher than the national average.

Given this, their higher body weights cannot be dismissed due to low income, socioeconomic status or lack of education. So what is going on?

University of Nevada’s Fraternity and Sorority Community

What changed in the last 50 years that contributed to this obesity epidemic?

As written about in a previous article, in 1967 (fifty years ago) the sugar industry paid three Harvard researchers (Stare, Hegsted and McGandy) very handsomely to critique studies that vindicated sugar as contributing to abnormal fat metabolism and heart disease, and who instead laid the blame on dietary fat, and in particular  saturated fat and dietary cholesterol [2,3].

They concluded;

”Since diets low in fat and high in sugar are rarely taken, we conclude that the practical significance of differences in dietary carbohydrate is minimal in comparison to those related to dietary fat and cholesterol…the major evidence today suggests only one avenue by which diet may affect the development and progression of atherosclerosis. This is by influencing the levels of serum lipids [fats], especially serum cholesterol.” [4]

These researchers who were sponsored by the sugar industry concluded that there was “major evidence” which  suggested that there was only ONE avenue for diet to contribute to hardening of the arteries and the development of heart disease – and that was dietary fat and cholesterol…yet only a year later in 1968, the Diet-Heart Review Panel of the National Heart Institute recommended that a major study be conducted to determine whether changes in dietary fat intake prevented heart disease – because such a study had not yet been done [5].

No major study had yet been done to find out whether changing the types of fat we ate prevented heart disease, yet these researchers were SO certain that there was “only one avenue” for diet to contribute to hardening of the arteries and the development of heart disease. How much was their certainly impacted by their sponsors?

Their influence didn’t end there.

Only ten years later, one of the three Harvard researchers (Hegsted) was directly involved with developing and editing the 1977 US Dietary Guidelines [6] which recommended a decrease in saturated fat and cholesterol  consumption, and an increase in dietary carbohydrate. While Canadian Dietary Guidelines are distinct from the US ones, much of the research on which they are based is the same.

Comparing the US to Canadian dietary recommendations with respect to the consumption of fat in general, as well as the consumption of saturated fat in particular, one finds the recommendations mirror each other.

We are told to limit saturated fat ostensibly because of its negative impact on blood cholesterol and heart disease. We are told to increase consumption of vegetable oils, and to substitute polyunsaturated fats for saturated fat in cooking and baking and to eat 45-65% of our daily calories as carbohydrate.

It is increasingly my conviction that the simultaneous (1) marketing of polyunsaturated vegetable oil – more accurately called industrially-created seed oils, such as soybean oil and canola oil, along with (2) changes in the Dietary Recommendations in both Canada and the US for people to (a) limit calories from fat and especially to (b) limit saturated fat, combined with the recommendations for people to (c) eat 45-65% of calories as carbohydrate created the “perfect storm” that when viewed together,  explains the obesity epidemic we now have and the associated increase in metabolic health problems that we now see 50 years later.

I will be writing more in the days ahead on what is thought to be the role of these industrially-created seed oils in the process of obesity and inflammation that underlies many metabolic conditions, including Type 2 Diabetes.

Why isn’t the public alarmed by this massive increase in obesity?

I believe it’s because it took place over such a long period of time that those old enough to remember what things were like before have either died or are approaching retirement age and have left its solution to the next generation, and those young enough to do something about it have never known it any other way.

I think that looking at the magnitude of the epidemic without the time frame is helpful.

What if only 10 years ago, only 1 in 10 people were obese and now 1 in 3 people were obese? Would there not be a public outcry for scientists to determine what caused this and to research to find a cure quickly?

Obesity underlies debilitating metabolic effects such as very high blood pressure that can lead to heart attacks and strokes and people of all ages are getting this disease – including children and teenagers. Obesity underlies the huge increase in Type 2 Diabetes and when poorly managed can result in blindness, limb amputation and organ failure. People of all ages are dying from these metabolic effects of these disease, which at present are mainly being managed through medication and advising people to “eat less and move more”.

Is that the best we can do to curb this epidemic?

As covered in previous articles, there are peer-reviewed published studies – some a year or two long, that demonstrate that these metabolic effects can be put into remission by eating a diet with less carbohydrates yet government-funded research into use of this is not a priority.

Why?

What role does the sugar industry and the corn-producers (that manufacturer high fructose corn syrup found in much of our packaged food) play?

What role do the grain boards (that market wheat and other grains for baked goods) play?

What about the soybean and canola growers – multi-billion dollar a year  industries in both countries that grows the soybeans and canola seed that are processed into fats sold to consumers for cooking and baking?

These industries and their respective lobby groups play an influential role in the economies of both Canada and the United States and in that way (and others) influence what types of research should be funded.

There is an epidemic going on and people are living with terrible metabolic consequences of them or dying from them.

Before the Dietary Guidelines are updated in both countries, the governments of Canada and the US must approve external, independent scientific review of the evidence-base for the existing dietary recommendation as well as examine the evidence-base for use of a well- designed low carbohydrate diet in reducing obesity and managing the debilitating metabolic effects.

The length of time since the obesity epidemic began does not make this any less urgent.

Do you have questions about how I can help you in tackling obesity and lowering or putting metabolic side effects into remission?

Please send me a note using the “Contact Me” form located on the tab above.

To our good health,

Joy

You can follow me at:

 https://twitter.com/lchfRD

  https://www.facebook.com/lchfRD/


References

  1. OECD Health Statistics 2017, June 2017, http://www.oecd.org/els/health-systems/Obesity-Update-2017.pdf
  2. Kearns C, Schmidt LA, Glantz SA, et al. Sugar Industry and Coronary Heart Disease Research: A Historical Analysis of Internal Industry Documents. JAMA Intern Med. 2016 Nov 01; 176(11):1680-1685.
  3. Husten, L, How Sweet: Sugar Industry Made Fat the Villain, Cardio|Brief, 2016 Sept 13.
  4. McGandy, RB, Hegsted DM, Stare,FJ. Dietary fats, carbohydrates and atherosclerotic vascular disease. New England Journal of Medicine. 1967 Aug 03;  277(5):242—47
  5. The National Diet-Heart Study Final Report.” Circulation, 1968; 37(3 suppl): I1-I26. Report of the Diet-Heart Review Panel of the National Heart Institute. Mass Field Trials and the Diet-Heart Question: Their Significance, Timeliness, Feasibility and Applicability. Dallas, Tex: American Heart Association; 1969, AHA Monograph no. 28.
  6. Introduction to the Dietary Goals for the United States — by Dr D.M. Hegsted. Professor of Nutrition, Harvard School of Public Health, Boston, MASS., page 17 of 130, https://naldc.nal.usda.gov/naldc/download.xhtml?id=1759572&content=PDF

Copyright ©2018 The LCHF-Dietitian (a division of BetterByDesign Nutrition Ltd.) 

LEGAL NOTICE: The contents of this blog, including text, images and cited statistics as well as all other material contained here (the ”content”) are for information purposes only.  The content is not intended to be a substitute for professional advice, medical diagnosis and/or treatment and is not suitable for self-administration without the knowledge of your physician and regular monitoring by your physician. Do not disregard medical advice and always consult your physician with any questions you may have regarding a medical condition or before implementing anything  you have read or heard in our content.


Vilification of Saturated Fat – Bad Fat Enduring Beliefs Part 1

This is Part 1 in a new series titled Bad Fat Enduring Beliefs and this article looks at how and when saturated fat was vilified and why sugar was          vindicated as the cause of heart disease.

The Diet-Heart Hypothesis

The diet-heart hypothesis is the belief that eating foods high in saturated fat contributed to heart disease was first proposed in the 1950s by a scientist named Ancel Keys who believed that by replacing saturated fat from meat, butter and eggs with newly-created industrial polyunsaturated vegetable oil (such as soybean oil) that heart disease and the deaths allegedly associated with it would be reduced by lowering blood cholesterol levels.

In 1952, Keys suggested that Americans should reduce their fat consumption by 1/3 and in 1953, Keys published a study where he said that he had demonstrated that there was an association between dietary fat as a percentage of daily calories and death from degenerative heart disease [1].

Four years later, in 1957, Yerushalamy et al published a paper with data from 22 countries[2] which showed a weak relationship between dietary fat and death by coronary heart disease — a much weaker relationship than was suggested by Keys’s in 1953. Nevertheless, in 1989 Keys and colleagues published their Seven Countries Study[3] which maintained there was an associative relationship between increased dietary saturated fat and Coronary Heart Disease — basically ignoring the data presented in Yerushalamy’s 1957 study, and which failed to study countries where Yerushalamy found no relationship between dietary fat and heart disease, such as in France. The paper maintained that the average consumption of animal foods (with the exception of fish) was positively associated with 25-year Coronary Heart Disease death rates and the average intake of saturated fat was strongly related to 10 and 25-year Coronary Heart Disease death rates. Keys and colleagues knew of the Yerushalamy’s data from 1957 and seemingly dismissed it.

Keys et al – Epidemiological studies related to coronary heart disease: characteristics of men aged 40—59 in seven countries [1]


Yerushalmy J, Hilleboe HE. Fat in the diet and mortality from heart disease. A methodologic note [2]
The paper has been widely criticized for selecting data only from the 7 countries that best fit their Diet Heart Hypothesis.

The Sugar Industry Funding of Research Vilifying Fat

In August of 1967, Stare, Hegsted and McGandy – the 3 Harvard researchers paid by the sugar industry published their review in the New England Journal of Medicine, titled ”Dietary fats, carbohydrates and atherosclerotic vascular disease”[3] which vindicated sugar as a contributor of heart disease and laid the blame on dietary fat and in particular, saturated fat and dietary cholesterol (previous article on that topic here).

Stare, Hegsted and McGandy concluded that there was “only one avenue” by which diet contributed to the development and progression of “hardening of the arteries” (atherosclerosis) and resulting heart disease and that was due to how much dietary cholesterol people ate and its effect on blood lipids;

”Since diets low in fat and high in sugar are rarely taken, we conclude that the practical significance of differences in dietary carbohydrate is minimal in comparison to those related to dietary fat and cholesterol…the major evidence today suggests only one avenue by which diet may affect the development and progression of atherosclerosis. This is by influencing the levels of serum lipids [fats], especially serum cholesterol.” [4]

These researchers concluded that there was major evidence available at the time which suggested that there was only ONE avenue for diet to contribute to hardening of the arteries and the development of heart disease – yet a year later in 1968 the report of the Diet-Heart Review Panel of the National Heart Institute made the recommendation that a major study be conducted to determine whether changes in dietary fat intake prevented heart disease because such a study had not yet been done [5];

”the committee strongly recommended to the National Heart Institute that a major definitive study of the effect of diet on the primary prevention of myocardial infarction be planned and put into operation as soon as possible. “

This is an important point; prior to a major study having ever been conducted to determine whether changes in dietary cholesterol impacts heart disease, 3 Harvard researchers paid by the sugar industry concluded that there was “only one avenue” by which diet contributed to the development and progression of atherosclerosis (i.e. “hardening of the arteries”) and heart disease and that was due to how much dietary cholesterol people ate and its effect on blood lipids.

Researcher Paid by the Sugar Industry Helps Develop the 1977 US Dietary Guidelines

Only ten years after the sugar industry paid Stare, Hegsted and McGandy to write their reviews, the same Dr. Hegsted was directly involved with  developing and editing the 1977 US Dietary Guidelines [6] which recommended an increase in dietary  carbohydrate and a decrease in saturated fat and cholesterol in the diet.

Historic changes in the Dietary Recommendation in Canada have largely been based on changes to the Dietary Recommendations in the US, and as a result both stemmed from a belief that eating saturated fat increases total cholesterol and therefore increases the risk of heart disease.

The problem is this belief is just that, a belief.

There have been many studies that have disproved this including a  randomized, controlled dietary intervention trial from 2008 which compared a low calorie, low in fat with a low carbohydrate, high fat diet of the same number of calories. This study found that overall heart health is significantly improved when carbohydrate is restricted, rather than fat [7,8].

Not all LDL cholesterol is “bad” cholesterol.

Small, dense LDL (“Pattern B”)  causes more “hardening of the arteries” than the large, fluffy LDL particles (“Pattern A”)[9].

It has been reported that when dietary fat is replaced by carbohydrate, the percentage of the small, dense LDL particles  (the ones that cause hardening of the arteries) is increased, increasing risk for heart disease.  Furthermore,  the low carb diet increased HDL (so-called “good” cholesterol), which are protective against heart disease and HDL and small, dense LDL were made worse on the low fat diet. Quite opposite to the “Diet-Heart Hypothesis, this study demonstrated improvements in the risk of heart disease for those eating a low carbohydrate, high fat diet compared to those eating a low fat, low calorie diet – which is not all that surprising given that it had been reported previously that a diet high in saturated fat actually lowers small, dense LDL (the type of LDL that causes hardening of the arteries) and raises the large fluffy LDL; actually improving risk factors for heart disease [15].

There are also other randomized controlled trials from 2004-2008 which demonstrate that a low carb diet improves blood cholesterol test results more than a low fat diet [10,11,12,13,14] – yet despite this, the belief that eating saturated fat increases blood cholesterol, persists.

Both the American and Canadian governments are in the process of revising their Dietary Guidelines and what is clear is that what is needed is an external, independent scientific review of the current evidence-base for the enduring false belief that dietary fat, especially saturated fat contributes to heart disease.

Have questions about how I can help you follow a low carb lifestyle?

Please send me a note using the “Contact Me” tab above and I will reply shortly.

To our good health!

Joy

You can follow me at:

 https://twitter.com/lchfRD

  https://www.facebook.com/lchfRD/

References

  1. KEYS, A., Prediction and possible prevention of coronary disease. Am J Public Health Nations Health, 1953. 43(11): p. 1399-1407.
  2. Yerushalmy J, Hilleboe HE. Fat in the diet and mortality from heart disease. A methodologic note. NY State J Med 1957;57:2343—54
  3. Kromhout D, Keys A, Aravanis C, Buzina R et al, Food consumption patterns in the 1960s in seven countries. Am J Clin Nutr. 1989 May; 49(5):889-94.
  4. McGandy, RB, Hegsted DM, Stare,FJ. Dietary fats, carbohydrates and atherosclerotic vascular disease. New England Journal of Medicine. 1967 Aug 03;  277(5):242—47
  5. The National Diet-Heart Study Final Report.” Circulation, 1968; 37(3 suppl): I1-I26. Report of the Diet-Heart Review Panel of the National Heart Institute. Mass Field Trials and the Diet-Heart Question: Their Significance, Timeliness, Feasibility and Applicability. Dallas, Tex: American Heart Association; 1969, AHA Monograph no. 28.
  6. Introduction to the Dietary Goals for the United States — by Dr D.M. Hegsted. Professor of Nutrition, Harvard School of Public Health, Boston, MASS., page 17 of 130, https://naldc.nal.usda.gov/naldc/download.xhtml?id=1759572&content=PDF
  7. Volek JS, Fernandez ML, Feinman RD, et al. Dietary carbohydrate restriction induces a unique metabolic state positively affecting atherogenic dyslipidemia, fatty acid partitioning, and metabolic syndrome. Prog Lipid Res 2008;47:307—18
  8. Forsythe CE, Phinney SD, Fernandez ML, et al. Comparison of low fat and low carbohydrate diets on circulating fatty acid composition and markers of inflammation. Lipids 2008;43:65—77
  9. Tribble DL, Holl LG, Wood PD, et al. Variations in oxidative susceptibility among six low density lipoprotein subfractions of differing density and particle size. Atherosclerosis 1992;93:189—99
  10. Foster GD, Wyatt HR, Hill JO, et al. A randomized trial of a low-carbohydrate diet for obesity. N Engl J Med 2003;348:2082—90.
  11. Stern L, Iqbal N, Seshadri P, et al. The effects of low-carbohydrate versus conventional weight loss diets in severely obese adults: one-year follow-up of a randomized trial. Ann Intern Med 2004;140:778—85
  12. Gardner C, Kiazand A, Alhassan S, et al. Comparison of the Atkins, Zone, Ornish, and LEARN diets for change in weight and related risk factors among overweight premenopausal women. JAMA 2007;297:969—77
  13. Yancy WS Jr., Olsen MK, Guyton JR, et al. A low-carbohydrate, ketogenic diet versus a low-fat diet to treat obesity and hyperlipidemia: a randomized, controlled trial. Ann Intern Med 2004;140:769—77
  14. Shai I, Schwarzfuchs D, Henkin Y, et al. Dietary Intervention Randomized Controlled Trial (DIRECT) Group. Weight loss with a low-carbohydrate, Mediterranean, or low-fat diet. N Engl J Med 2008;359:229—41
  15. Dreon DM, Fernstrom HA, Campos H, et al. Change in dietary saturated fat intake is correlated with change in mass of large low-density-lipoprotein particles in men. Am J Clin Nutr 1998;67:828—36

Copyright ©2018 The LCHF-Dietitian (a division of BetterByDesign Nutrition Ltd.) 

LEGAL NOTICE: The contents of this blog, including text, images and cited statistics as well as all other material contained here (the ”content”) are for information purposes only.  The content is not intended to be a substitute for professional advice, medical diagnosis and/or treatment and is not suitable for self-administration without the knowledge of your physician and regular monitoring by your physician. Do not disregard medical advice and always consult your physician with any questions you may have regarding a medical condition or before implementing anything  you have read or heard in our content.


The Marketing of Vegetable Fats to an Unsuspecting Public

Yesterday, in preparing to begin a new series of articles on the relationship between polyunsaturated vegetable fats to obesity, I came across an old, yellowed sheet titled “Comparison of Dietary Fats” that I was given as an undergrad Dietetic student at McGill, in 1989.

(reverse side) Comparison of Dietary Fats — ”Provided as a Professional Service by Proctor & Gamble”, 1989 – full size photo, below

It was designed to help us teach consumers how to choose the “healthiest” dietary fats.

As indicated at the bottom of both sides of the handout (see full size photos, below), it was “provided as a Professional Service by Proctor and Gamble“.

Why would Proctor and Gamble, a soap company provide future Dietitians with a teaching handout on choosing healthy oils for cooking? A bit of understanding about how soap is made, will help.

At the time, the making of soap required a mixture of animal fats and lye, however William Procter and James Gamble (brothers-in-law living in Cincinnati in the late 1800s and who formed Proctor and Gamble) needed to find an inexpensive replacement for animal fat for the creation of individually wrapped bars of soap.

The source of soap fat they turned to was a waste-product of the cotton industry – cottonseed oil. It was literally the garbage leftover when cotton was produced and is cloudy, red and bitter to the taste, and toxic to most animals.

They needed to make cottonseed oil solid in order to make bar soap and utilized a newly patented technology to produce a creamy, pearly white substance out of cottonseed oil. This fat resembled lard (the most popular natural animal fat baking and frying fat at the time), so with a little more tweaking, this hydrogenated cottonseed oil was then sold in 1911 by Procter & Gamble to home cooks as Crisco® shortening.

All that was needed now was for Proctor and Gamble to market this industrially-produced seed oil fat, and market it they did. They hired America’s first full-service advertising agency, the J. Walter Thompson Agency that employed graphic artists and professional writers.

“Samples of Crisco were mailed to grocers, restaurants, nutritionists, and home economists. Eight alternative marketing strategies were tested in different cities and their impacts calculated and compared.

Doughnuts were fried in Crisco and handed out in the streets.

Women who purchased the new industrial fat got a free cookbook of Crisco recipes. It opened with the line, “The culinary world is revising its entire cookbook on account of the advent of Crisco, a new and altogether different cooking fat.” [1]

From the very beginning, Proctor and Gamble marketed their industrially-created solid fat (Crisco®) to “nutritionists” and “home economists” – the forerunners to Dietitians.

When Procter & Gamble introduced Puritan Oil® in 1976, a liquid cooking oil made of sunflower oil which became 100% canola oil by 1988, it was natural for them to market their newly created oil to Dietitians.

Proctor & Gamble now had a lucrative business manufacturing industrial seed oils as dietary fats and they wanted to make sure that we, as Dietitians encouraged people to use their “healthy” fats.

I’ve scanned in both sides of the handout (it’s old and yellowed, having been kept in the back of my “new” 1988 Canada’s Food Guide book for almost 30 years). As can be seen, in first place on the front side of the handout is canola oil identified by the trade name “Puritan Oil®”, a registered trademark of Proctor and Gamble.

(front side) Comparison of Dietary Fats – “Provided as a Professional Service by Proctor & Gamble”, 1989

On the reverse side, is what consumers should know about these oils, including that canola oil is “better than all other types of vegetable oil“.

(reverse side) Comparison of Dietary Fats – “Provided as a Professional Service by Proctor & Gamble”, 1989

I’ve highlighted some of the wording that makes Proctor & Gamble’s bias apparent;

(reverse side) Comparison of Dietary Fats – “Provided as a Professional Service by Proctor & Gamble”, 1989 – red text mine

Some Final Thoughts…

From the very beginning, industrially-produced seed  fats and oils have been marketed to nutritionists, home economists and Dietitians by the companies that created them, in some cases as a “Professional Service”.

As will become clear in the next article we, as Dietitians were tasked by the Dietary Guidelines in both Canada and the US with promoting “polyunsaturated vegetable oils” to the public as ‘healthful alternatives’ to presumably unhealthy saturated animal fats. The manufacturers were there to ‘assist’ as a ‘Professional Service’.

Looking back on the role of fat manufacturers and the sugar industry (outlined in the preceding article) on which foods were recommended and promoted, it makes me question what I was taught and who affected what I was taught. Given that it was known at the time the sugar industry funded the researchers that implicated saturated fat as the alleged cause of heart disease, I wonder what we don’t know about which industry funded which research.  After all, the knowledge about the sugar industry having funded the researchers that implicated saturated fat only ‘came out’ in November 2016 when it had occurred decades earlier.

NOTE: It is increasingly my conviction that the simultaneous (1) marketing of polyunsaturated vegetable oil (soybean oil, canola oil) along with (2) changes in the Dietary Recommendations for people to (a) eat no more than 20- 30% of calories from fat and to (b) limit saturated fat to no more than 10% of calories, combined with the recommendations for people to (c) eat 45-65% of calories as carbohydrate was the “perfect storm” that may well explain the current obesity crisis and associated  increase in metabolic health problems that we now see 40 years later.

In subsequent articles I’ll elaborate on why I believe this is the case.

To our good health,

Joy

You can follow me at:

 https://twitter.com/lchfRD

  https://www.facebook.com/lchfRD/

References

  1. Ramsey, D*., Graham T., The Atlantic. How Vegetable Oils Replaced Animal Fats in the American Diet, April 26 2012 (www.theatlantic.com/health/archive/2012/04/how-vegetable-oils-replaced-animal-fats-in-the-american-diet/256155/)

*Dr. Drew Ramsey, MD is an assistant clinical professor of psychiatry at Columbia University.


Copyright ©2018 The LCHF-Dietitian (a division of BetterByDesign Nutrition Ltd.) 

LEGAL NOTICE: The contents of this blog, including text, images and cited statistics as well as all other material contained here (the ”content”) are for information purposes only.  The content is not intended to be a substitute for professional advice, medical diagnosis and/or treatment and is not suitable for self-administration without the knowledge of your physician and regular monitoring by your physician. Do not disregard medical advice and always consult your physician with any questions you may have regarding a medical condition or before implementing anything  you have read or heard in our content.


Sugar Industry Paid Researchers that Blamed Saturated Fat as Cause of Heart Disease

A year ago, I found out from a fellow Dietitian that a recently published article in the Journal of the American Medical Association revealed that the sugar industry had secretly funded a group of renowned Harvard researchers to write an influential series of articles which downplayed, discredited or outright ignored research known at the time, and which demonstrated that sugar was a contributor to heart disease.

I read the article and was stunned at its significance.

As I am in the midst of a new series of articles on the role of saturated fat and polyunsaturated fat in health and disease, I felt it’s important that people understand the sugar’s industry involvement in potentially skewing of the scientific evidence at the very time that the original 1977 low-fat high carb Dietary Guidelines were being formulated and so I researched further and wrote this article.

Two of the prominent Harvard researchers that were paid by the sugar industry and who wrote articles dismissing that sugar was a significant contributor to heart disease and implicating saturated fat as the cause were the late Dr. Fredrick Stare, chair of Harvard’s School of Public Health Nutrition Department and the late Dr. D. Mark Hegsted, a professor in the same department [2].

POST PUBLICATION NOTE (March 12 2018): Dr. Hegsted, one of the 3 Harvard researchers paid by the sugar industry to write these review articles was directly involved in developing the 1977 US Dietary Guidelines [6].

[Note: April 1, 2021: see this article for documentation.]


A commentary in the Journal of Accountability in Research [4] summarized the significance of those articles as follows;

“Researchers were paid handsomely to critique studies that found sucrose [sugar] makes an inordinate contribution to fat metabolism and heart disease leaving only the theory that  dietary fat and cholesterol was the primary contributor.”

In the mid-1960’s, the Sugar Research Foundation (which is the predecessor to the Sugar Association) wanted to counter research that had been published at the time which suggested that sugar was a more important cause of atherosclerosis than dietary fat. The Sugar Research Foundation invited Dr. Stare of Harvard’s School of Public Health Nutrition Department to join its scientific advisory board and then approved $6,500 in funds ($50,000 in 2016 dollars) to support a review article that would respond to the research showing the danger of sucrose[2].  Letters exchanged between the parties were brought to light in the November 2016 article published by Kearns et al [1] maintained that the Sugar Research Foundation tasked the researchers with preparing ”a review article of the several papers which find some special metabolic peril in sucrose [sugar] and, in particular, fructose [3].”

This would seem akin to the tobacco industry having secretly funded articles demonstrating that something other than smoking was responsible for lung cancer.

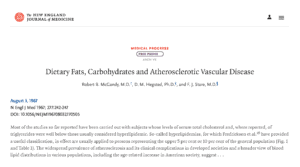
In August 1967 the New England Journal of Medicine published the first review article written by Drs. Stare, Hegsted and McGandy titled ”Dietary fats, carbohydrates and atherosclerotic vascular disease”[3] which stated;

”Since diets low in fat and high in sugar are rarely taken, we conclude that the practical significance of differences in dietary carbohydrate is minimal in comparison to those related to dietary fat and cholesterol”

The report concluded;

”the major evidence today suggests only one avenue by which diet may affect the development and progression of atherosclerosis. This is by influencing the levels of serum lipids [fats], especially serum cholesterol.”

The Harvard researchers went on to say;

”there can be no doubt that levels of serum cholesterol can be substantially modified by manipulation of the fat and cholesterol of the diet.”

The Harvard researchers concluded;

“on the basis of epidemiological, experimental and clinical evidence, that a lowering of the proportion of dietary saturated fatty acids, increasing the proportion of polyunsaturated acids and reducing the level of dietary cholesterol are the dietary changes most likely to be of benefit.”

Stare, Hegsted and McGandy did not disclose that they were paid by the Sugar Research Foundation for the two-part review [4].

In response to Kearns et al article in the Journal of the American Medical Association in November 2016 [1], the Sugar Association responded [5] by stating that it;

”should have exercised greater transparency in all of its research activities, however, when the studies in question were published funding disclosures and transparency standards were not the norm they are today.” [5]

Some final thoughts…

The reviews written by these influential Harvard School of Public Health Nutrition Department researchers and paid for by the sugar industry have the appearance of being a deliberate manipulation of the perception of the scientific evidence known at the time. 

Whether deliberate or inadvertent, the fact that such sponsorship occurred at the very period in time when the Dietary Guidelines were under revision to emphasize that saturated fat intake must be reduced and carbohydrate consumption must be increased cannot be understated — a move which certainly benefited the sugar industry.

POST PUBLICATION NOTE (March 12 2018): Discovered after publication of this article, one of the three Harvard researchers funded by the sugar industry, Dr. D.M Hegsted was one of the scientists that worked on the 1977 US Dietary Guidelines[6].

[Note: April 2, 2021: See this article for documentation.]

How has this turned out for us?

For the last 40 years, Americans and Canadians have diligently eaten more carbohydrate (including foods containing sucrose and fructose) and more polyunsaturated fats (especially soybean and canola oil) just as the Harvard researchers paid for by the sugar industry recommended — and to what end?

Obesity rates have gone from ~10% in the 1950’s and 60’s in both countries to 26.7% in Canada (2015) and ~34% in the US (2017) and Diabetes and high blood pressure (hypertension) rates have risen exponentially.

What’s going on?

Could it be that the shift to a diet abundant in omega-6 polyunsaturated fat (such as soyabean oil) and which supplies 45-65% of daily calories as carbohydrate created the ‘perfect storm‘ which inadvertently fueled the obesity and health epidemic we now see?

This will be the subject of future articles.

Have questions?

I provide both in-person and Distance Consultation services (via telephone or Skype) can help you learn a better and easier way to eat, while you achieve and maintain a healthy body weight long term.

Please send me a note using the “Contact Me” tab above and I will reply shortly.

To our good health!

Joy

You can follow me at:

 https://twitter.com/lchfRD

  https://www.facebook.com/lchfRD/


Copyright ©2018 The LCHF-Dietitian (a division of BetterByDesign Nutrition Ltd.) 

LEGAL NOTICE: The contents of this blog, including text, images and cited statistics as well as all other material contained here (the ”content”) are for information purposes only.  The content is not intended to be a substitute for professional advice, medical diagnosis and/or treatment and is not suitable for self-administration without the knowledge of your physician and regular monitoring by your physician. Do not disregard medical advice and always consult your physician with any questions you may have regarding a medical condition or before implementing anything  you have read or heard in our content.

References

  1. Kearns C, Schmidt LA, Glantz SA, et al. Sugar Industry and Coronary Heart Disease Research: A Historical Analysis of Internal Industry Documents. JAMA Intern Med. 2016 Nov 01; 176(11):1680-1685.
  2. Husten, L, How Sweet: Sugar Industry Made Fat the Villain, Cardio|Brief, 2016 Sept 13.
  3. McGandy, RB, Hegsted DM, Stare,FJ. Dietary fats, carbohydrates and atherosclerotic vascular disease. New England Journal of Medicine. 1967 Aug 03;  277(5):242—47
  4. Krimsky, S. Sugar Industry Science and Heart Disease, Accountability in Research. 2017 Oct 07; 24:2, 124-125.
  5. Sugar Association, The Sugar Association Statement on Kearns JAMA Study, 2016 Sep 12
  6. Introduction to the Dietary Goals for the United States – by Dr D.M. Hegsted. Professor of Nutrition, Harvard School of Public Health, Boston, MASS., page 17 of 130, https://naldc.nal.usda.gov/naldc/download.xhtml?id=1759572&content=PDF

What is Ideal Protein®?

Recently, there has been a lot of buzz about a weight-loss program called Ideal Protein® which is often talked about as being a “low carb diet” so I decided to look into what this system is, and how it works. A local pharmacy is participating in this program, so I was able to obtain information directly from the pharmacist.

Ideal Protein®, in it’s weight-loss phase (called “Phase 1”) is both a low carb and low fat diet – and is most significantly a calorie-restricted diet promoted for weight loss.

Pharmacy-based

“Lifestyle Clinics”,  many of which are located at participating pharmacies are supervised by a pharmacist (or a nurse) who oversees the promotion of the Ideal Protein® line of products required for the diet, as well as the Natura® vitamin and mineral supplements and “Ideal Salt®“, which clients are instructed to use daily.

The designated pharmacist (or nurse) reviews the sign up, but “Ideal Protein® weight loss “coaches” are the ones who review weekly “food journals” that clients are required to keep, as well as records client’s weight, body measurements and fat % readings at their weekly “check-ins”.

Restricted Foods

In addition to limiting both carbs and fats, many foods are not permitted to be eaten by those on the Ideal Protein® diet until clients achieve 100% of their weight-loss goals.

For example, no cheese or dairy is permitted during the weight loss phase, except for 30 ml (1 oz) of regular milk in coffee or tea at breakfast. Natura® supplements are prescribed to clients to ensure adequate intake of calcium and magnesium.

The only vegetables permitted during the weight-loss phase of the Ideal Protein® diet during lunch and dinner are what are called “selected vegetables”  – which exclude green and wax beans, Brussels sprouts, eggplant, heart of palm, rutabaga, snow peas, tomatillo, and tomatoes. These are considered “occasional vegetables” and are allowed to a maximum of 4 cups per week.

*NOTE: I have been advised from a pharmacist that sells these products that these vegetables have “extra carbohydrates” and “slightly higher GI (glycemic index) for the most part“,  which is the reason they are limited.

Glycemic Index (GI) is a measure of the effect of carbohydrates on a person’s blood sugar. I am more interested in a food’s Insulin Index (II) which is a measure of the effect of a carbohydrate on a person’s insulin levels.

Permitted “selected vegetables” are alfalfa, asparagus, bamboo shoots, bean sprouts, bell peppers, broccoli, cabbage, cauliflower, celeriac, celery,  chayote, chicory, collards, cucumbers, dill pickles, fennel, Chinese broccoli, green onions, jicama, kale, kohlrabi, mushrooms, okra, onions (raw only), hot peppers, radish, rhubarb, sauerkraut, spinach, Swiss chard, turnip, and zucchini / yellow summer squash.

Only unlimited “raw vegetables and lettuce” in the list below are permitted during the weight-loss phase (and only during lunch and dinner). These are arugula, bibb lettuce, Boston lettuce, celery, chicory lettuce, cucumber, endives, escarole lettuce, frisée lettuce, green and red leaf lettuce, iceberg lettuce, mushroom, radicchio, radish, romaine lettuce, spinach and watercress lettuce. All others raw vegetables and lettuce are prohibited.

Even in Phase 2, clients are instructed to only “eat the vegetables permitted” and to “continue to omit cheese and other dairy with the exception of 30 ml (1 oz.) of milk in coffee or tea only“.

Ideal Protein® “Meals”

During the weight loss phase (Phase 1), clients are instructed to have meals as follows;

BREAKFAST: 1 Ideal Protein® diet food product, with the option of having coffee or tea with 1 oz. (30 ml) milk, plus Natura® vitamin and mineral supplements.

LUNCH: 1 Ideal Protein® diet food product, with 2 cups of “selected vegetables” and unlimited “raw vegetables and lettuce” from the above list.

DINNER: clients can eat 8 oz (225g) of lean fish / seafood, lean beef, skinless poultry, lean cuts of pork, veal or wild game meat and 2 cups of “selected vegetables” and unlimited “raw vegetables and lettuce” from the above list plus Natura® vitamin and mineral supplements and omega 3 plus.

SNACK: For a snack, clients eat another Ideal Protein® diet food product and more Natura® vitamin and mineral supplements.

In “Phase 2”, which occurs after 100% of weight loss goals have been achieved, the number of Ideal Protein® diet food products required to be consumed is reduced to 2 and clients can eat the protein choice they wish from the approved list at both lunch and dinner, for 2 weeks. The “selected vegetables” and unlimited “raw vegetables and lettuce” remains the same.

In “Phase 3”,  the number of Ideal Protein® diet food products required to be consumed is reduced to 1 and clients can continue to eat the protein choice they wish from the approved list at both lunch and dinner, for 2 weeks. The “selected vegetables” and unlimited “raw vegetables and lettuce” remains the same.

It is only in “Phase 4”, the maintenance phase” of the Ideal Protein® weight loss system where clients are allowed to eat “all whole foods, including protein and fats, and do not need to eat the Ideal Protein®  products”.

Additional Instructions

Clients are instructed to follow the strict carbohydrate and fat restriction until they achieved “100% of their weight loss goals” and to “eat no more / no less” than the amount of food listed for each meal and snack. That is, “Phase 1” last as long as necessary until a person loses all the weight they planned.

They are cautioned that during Phase 1 and possibly beyond that, six symptoms may occur – especially if they “don’t follow the weight loss method as prescribed”. These symptoms are hunger, headache, nausea, fatigue, constipation and bad breath.

Restricted Calories

Ideal Protein® provides only 850-1000 calories per day, which makes it a calorie-restricted diet.

Low Carb

The Ideal Protein meal replacement packets provide ~20 gm net carbs per day and the “selected vegetables” and “raw vegetables and lettuce”provide ~ 20 gm net carbs per day. Total net carbs are ~40 gm / day.

High Protein

In the Ideal Protein® system,   the meal supplements contain ~15-20 gm protein each and 3 of those are to be eaten each day, along with 8 oz of lean animal protein per day. From the ‘meal packets’, there are 60-80 gms of protein and anywhere from 56 gm of protein (lean ground beef) to 72 gms of protein  (chicken breast).  In total, the Ideal Protein system has people eating between 120 gm – 152 gm of protein per day.

According to Statistics Canada (www.statcan.gc.ca/daily-quotidien/170620/dq170620b-eng.htm), the average protein intake for an adult is 16.5% to 17.0%. Based on Ideal Protein® system having a caloric intake of 850-1000 kcals/day, and the 3 meal supplement packets providing 15-20 gm of protein each, plus the 8 oz of lean protein (another 56-72 gms of protein), the Ideal Protein® system supplies 53 – 67.5% of calories as protein.

Costs

In terms of cost, it is ~ $500 to sign up to begin the Ideal Protein® diet, which includes a ‘coaching fee’, first round of supplements and 2 weeks worth of meal replacement and meal supplement sample products.

After sign up, the cost works out to ~$100 a week to purchase the Ideal Protein® products, plus supplements  i.e. each box of 7 Ideal Protein® ”meal replacements” or diet food product (required to be eaten for meals and snacks) costs ~$30 and for weight loss, 3 boxes a week are required.

Each additional month is another ~$400.

Ideal Protein® – the company

The Ideal Protein® company is headed by Dr. Randall Wilkenson MD, who has 20 years experience specializing in allergy and environmental medicine and who now works with his son Denver Wilkenson, whose experience is in managing a weight-loss clinic in Idaho for 3 years.

Ami-Higbee, RN serves  as Clinic Director and Mike Ciell, RPh, a registered pharmacist certified in geriatric pharmacy, is VP of Clinic Operations.

At the time of writing, no Registered Dietitians are listed on the team, but they do have a ‘chef’ from Quebec who designs their recipes, almost all of which include ingredients from their Ideal Protein® product list.

According to a local pharmacist that I spoke with, Ideal Protein® has over 4000 of these “Lifestyle Clinics” worldwide.


A few thoughts…

This diet is very popular, but it is not a “low carb diet” but is a “low carb, low fat, calorie restricted diet”.

It’s easy because people don’t need to think what to to eat and can buy meal replacement products to satisfy breakfast and the protein component of lunch.  For supper, clients are provided with recipes that use the special branded products that they already purchase to make cooking easy. A snack (deemed necessary, I presume) is another food replacement product. There is limited food preparation required.

The diet system promotes fast weight loss — where both carbohydrates and fats are limited.

Since it is overseen by a pharmacist or a nurse, it has the image of being healthy. But is it “ideal”?

As discussed in an earlier article, our bodies have an absolute requirement for specific essential nutrients; nutrients that we must take in our diet because we can’t synthesize them. These are listed in several volumes called the Dietary Reference Intakes (DRIs), published by National Academies Press. There are essential amino acids, fatty acids, vitamins and minerals – and it is necessary to take in adequate protein and fat, when carbohydrate is restricted.

In the Dietary Reference Intakes for Energy, Carbohydrate, Fiber, Fat, Fatty Acids, Cholesterol, Protein and Amino Acids (2005) it reads;

The lower limit of dietary carbohydrate compatible with life apparently is zero, provided that adequate amounts of protein and fat are consumed

… however, Ideal Protein® diet restricts both carbs and fats.

It restricts calories.

It restricts cheese and all dairy except for one ounce of milk per day.

It restricts which non-starchy vegetables can be consumed.

It allows no fruit.

It allows no nuts or seeds.

It offers vitamin and mineral supplements and food replacements in place of those real foods.

In the Ideal Protein® system, people are required to eat 4 times a day with carbs contained in the branded meal supplements on each occasion. Research supports that to begin to lower insulin release in insulin-resistant people requires periods of at least a 12 hour where no food is eaten, which naturally occurs after dinner before the first meal of the day breakfast). Having people eat a ‘snack’ would appear to be self-defeating.

Eating a low carb high healthy fat with 3 meals per day, with nothing between supper and breakfast supports the lowering of insulin release, improving the cells insulin sensitivity, in time.  Adding to this periods of intermittent fasting (which is not a total fast, but has no carbohydrates or significant amounts of protein) allows insulin levels to fall even further, which is often the goal of eating a low carb diet.

In the Ideal Protein® system, the meal supplements contain ~15-20 gm protein each and there are 3 of those per day and there is also 8 oz of lean animal protein per day. From the ‘meal packets’, there are 45-60 gms of protein and anywhere from 56 gm of protein (lean ground beef) to 72 gms of protein (chicken breast). In total, the Ideal Protein®  system supplies between 100 gm – 132 gm of protein per day. While carb intake in the Ideal Protein®  system is low, the body would synthesize glucose from the excess protein (called gluconeogenesis) resulting in insulin release. From my understanding, this appears to be self-defeating if the goal is to lower insulin release.

It would seem that the increased gluconeogenesis from the high protein intake in the Ideal Protein® system would not support increased insulin sensitivity as much as a low-carb-high-fat moderate protein diet, even without intermittent fasting.

Another factor is the $500 start-up cost for the first month, plus another  $400+ for each additional month to eat ‘meals’ comprised of largely of meal replacements and supplements, along with some real food.

Ideal Protein® makes it easy and promotes rapid weight loss, but is it really “ideal” for people who have made poor eating choices in the past — when they don’t learn how to make healthy meal choices while achieving weight loss? Weight loss may be quick, but weight loss also has to be sustainable.

Also, is it really “ideal” for people who are insulin resistant when it has them eating food with carbohydrate and protein 4 times per day?

I encourage my clients to eat a wide variety of real foods — foods such as dairy products including cheese,  domesticated and wild meat, poultry and fish, especially fatty fish that are rich in omega 3 fats, low-carb fruit and a vast array of low-carb vegetables. There are fats from all sources, including some healthy saturated fat, with most fat coming from healthy monounsaturated sources such as olives avocados, nuts and seeds. There are no food diaries to keep and no mandatory “weigh-ins” or “check-ins”.  My clients eat real food when they are hungry and don’t eat if they are not hungry.  Most significantly, they learn to make healthy food choices with whole, real food as they lose weight.

Each person needs to evaluate for themselves whether use of the Ideal Protein® system makes sense for them.

As I always do, I recommend that people consult with their own doctor before beginning any weight-loss program.

To your good health!

Joy

You can follow me at:

 https://twitter.com/lchfRD

  https://www.facebook.com/lchfRD/


Note: Everyone’s results following a LCHF lifestyle will differ as there is no one-size-fits-all approach and everybody’s nutritional needs and health status is different. If you want to adopt this kind of lifestyle, please discuss it with your doctor, first.

Copyright ©2017 The LCHF-Dietitian (a division of BetterByDesign Nutrition Ltd.) 

LEGAL NOTICE: The contents of this blog, including text, images and cited statistics as well as all other material contained here (the ”content”) are for information purposes only.  The content is not intended to be a substitute for professional advice, medical diagnosis and/or treatment and is not suitable for self-administration without the knowledge of your physician and regular monitoring by your physician. Do not disregard medical advice and always consult your physician with any questions you may have regarding a medical condition or before implementing anything  you have read or heard in our content.


1977 Dietary Recommendations — forty years on

Since 1977, the dietary recommendations in Canada and the US has been for people to consume a diet with limited fat and where ”complex carbohydrates” (starches) comprise the main source of calories.

From 1949 until 1977, the dietary recommendations of Canada’s Food Guide were for people to consume

~20-30% of their daily calories as carbohydrate

~40-50% of daily calories as fat

~20-30% of daily calories as protein

From 1977 onward, Canada’s Food Guide recommended that people consume:

55-60% of daily calories as carbohydrate

<30% of daily calories as fat, with no more than 1/3 from saturated fat

15-20% of daily calories as protein

The US recommendations since 1977 have been similar to those in Canada, with the Dietary Goals for the United States recommending that carbohydrates are 55-60% of daily calories and that calories from fat be no more than 30% of daily calories (of which no more than 1/3 comes from saturated fat).

Eating Well with Canada’s Food Guide which came out in 2015, recommends that people eat even more of their daily calories as carbohydrate;

45-65% of daily calories as carbohydrate

20-35% of daily calories as fat, with no more than 1/3 from saturated fat

10-35% of daily calories as protein

[Reference: http://www.hc-sc.gc.ca/fn-an/nutrition/reference/table/ref_macronutr_tbl-eng.php]

Health Canada recommends limiting fat to only 20-35% of calories  while eating 45-65% of daily calories as carbohydrates and currently advise adults to eat only 30-45 mL (2 — 3 Tbsp) of unsaturated fat per day  (including that used in cooking, salad dressing and spreads such as margarine and mayonnaise).

This is what people have come to call a ”balanced diet”.

But is it?

For the past 40 years, the public has come to believe that eating fat made you fat’ and that eating saturated fat caused heart disease. Evidence-based research does not seem to support that having a diet rich in healthy fats – especially monounsaturated fats like from olive and its oil, and avocados, nut and seeds and omega 3 fats from fish causes heart disease.

Our society has become ”fat phobic”. People guzzle skim or 1% milk with little regard to the fact that just 1 cup (250 ml) has almost the same amount of carbs as a slice of bread.  And who drinks only one cup of milk at a time?  Most people’s ”juice glasses” are 8 oz and the glasses they drink milk from are 16 oz, which is 2 cups. Who ever stops to think of their glass of milk as having the same amount of carbs as almost 2 slices of bread?

In addition, carbs are hidden in the 7-10 servings of Vegetables and Fruit they are recommended to eat  — with no distinction made between starchy- and non-starchy vegetables.  Many people eat most of their vegetable servings as carbohydrate-laden starchy vegetables such as peas, corn, potatoes and sweet potatoes and then have a token serving of non-starchy vegetables (like salad greens, asparagus or broccoli) on the ”side” at dinner. Who stops to think that just a 1/2 cup serving of peas or corn has as many carbs as a slice of bread — and often those vegetables are eaten with a cup of potatoes, adding the equivalent number of carbs as another 2 slices of bread?

People drink fruit juice and ”smoothies” with no regard for all of the extra carbs they are consuming (not to mention the effect that all of that fructose has).  A ”small juice glass” is 8 oz, so just a glass of orange juice has the equivalent number of carbs as another 2 slices of bread! Many grab a smoothie at lunch or for coffee break without even thinking that the average smoothie has the same number of carbs as 5 slices of bread!

Then there is the toast, bagels and cereal or bars that people eat for breakfast, the sandwiches or wraps they eat for lunch and the pasta or rice they have for supper.  These are carbs people know as carbs — which are added to all the carbs they consumed as vegetables, fruit and milk.

What has been the outcome of people following these dietary recommendations to eat a high carb diet since 1977 ?

Obesity Rates

In 1977, obesity rates* were 7.6% for men and 11.7% for women, with the combined rate of < 10 % for both genders.

* Obesity is defined as a Body Mass Index (BMI) ≥30 kg/(m)2

In 1970-72 the obesity rate in Canadian adults was 10% and by 2009-2011, it increased two and a half times, to 26%.

In 1970-72, only 7.6% of men were obese but by 2013, 20.1% of men were categorized as obese. In 1970-72, only 11.7% of women were obese but by 2013, 17.4% of women were obese.

In 1978 in Canada, only 15% of children and adolescents were overweight or obese, yet by 2007 that prevalence almost DOUBLED to 29% of children and adolescents being overweight or obese. By 2011obesity prevalence alone (excluding overweight prevalence) for boys aged 5- to 17 years was 15.1% and for girls was 8.0%.

The emphasis since 1977 on consuming diets high in carbohydrates and low in fat has taken its toll.

Effect on Health

Non-alcoholic liver disease is rampant and not surprisingly, considering 37% of adults and 13% of youth are abdominally (or truncally) obese — that is, they are carrying their excess body fat around and in the internal organs, including the liver.

Since the 1970’s, Diabetes rates have almost doubled.

  • In the 1970s, the rate of Type 2 Diabetes in women was 2.6% and in men was 3.4 %. In the 1980s that number rose in women to 3.8% and in men to 4.5%. In the 1990s the rate was almost double what it was in 1970; in women it was 4.7% and  in men, 7.5%.

If people eating a high carb, low fat diet has corresponded to an increase in obesity, overweight and Diabetes, then what’s the alternative?

That is where a low carb high healthy fat diet comes in , which supplies adequate, but not excess protein. It enables us to use our own fat stores for energy, and to make our own glucose (for our blood and brain) with ketones (that are naturally produced by our bodies when we sleep, for example) to fuel our cells and organs. Since humans are designed to run on carbs (in times of plenty) and in our fat stores (when food is less plentiful), being in mild ketosis is a normal physiological state. By eating a low carb high fat diet when we’re hungry and delaying eating for short periods, we can mimic the conditions that were common to our ancestors. By eating this way over an extended period of time, we can bring down insulin levels and as a result, decrease the insulin resistance of our cells. We can improve our blood sugar, lower our blood pressure and see our LDL cholesterol and triglycerides come down to normal, healthy levels.

Want to know more? Why not send me a note using the Contact Us form located above?

To your health!

Joy

you can follow me at:

 https://twitter.com/lchfRD

  https://www.facebook.com/lchfRD/

Note: Everyone’s results following a LCHF lifestyle will differ as there is no one-size-fits-all approach and everybody’s nutritional needs and health status is different. If you want to adopt this kind of lifestyle, please discuss it with your doctor, first.

Copyright ©2017 The LCHF-Dietitian (a division of BetterByDesign Nutrition Ltd.) 

LEGAL NOTICE: The contents of this blog, including text, images and cited statistics as well as all other material contained here (the ”content”) are for information purposes only.  The content is not intended to be a substitute for professional advice, medical diagnosis and/or treatment and is not suitable for self-administration without the knowledge of your physician and regular monitoring by your physician. Do not disregard medical advice and always consult your physician with any questions you may have regarding a medical condition or before implementing anything  you have read or heard in our content.


Two People, Two Options: living healthy or dying prematurely

This weekend has been a challenging one, as I received two pieces of news. The first was of one client’s incredible success following the low carb high healthy fat diet and the shocked reaction of his doctor, and the other was of the death of a friend who had Diabetes, high blood pressure and high cholesterol. In this blog, I will share how these two events embody the two options each of us have; (1) living a healthy life to the fullest or (2) living with diet-related disease and dying prematurely of ‘natural causes’.

“JP” – a Picture of Success

Last fall, I had a reasonably fit 35-year-old client contact me wanting to lose 15 pounds. He went to the gym twice a week for an hour, and ran 10 km per week, but had put on some pounds and wanted to lose them.

As I always do, I asked for a copy of recent blood test, assessing his fasting blood glucose, HbA1C (3 month average of blood glucose), cholesterol (lipid panel) and requesting his doctor-assessed blood pressure. (Sometimes people insist that I counsel them without seeing blood work, but I explain that they ran out of crystal balls when I was graduating, so I have no choice but to get labs.)  I gave my new client a Lab Test Request form to bring his doctor.  The GP scoffed at the Lab Test Request Form asking him to requisition a lipid panel for a young, fit 35 year old whose parents are both living. That changed when the tests came back, and this man’s triglyceride level was higher than I had ever seen anyone’s, ever. His non-HDL cholesterol was very high and his HDL was very low. LDL wasn’t even available because his triglycerides levels were through the roof. His ferritin was astronomically high – not a sign of excess iron, but likely inflammation.

His doctor called him into the office immediately and wanted to put him on statin medication right away and referred him to the Lipid Clinic at a major local hospital.

My client told his doctor he wanted to wait 3 months and first follow my dietary recommendations and see what would happen to his lipids, and was advised against it by his doctor. My client was insistent, so the doctor told him that his recommendations were for him to eat “decrease saturated fat and carbohydrates, increase fruit and vegetables, increase insoluble fiber and fish, make his plate 1/2 vegetables, 1/4 protein, 1/4 starch“.

After seeing me, he agreed to limit fruit to max 1 / day, preferably a few berries on top of 2 or 3 huge salads with plenty of good quality olive oil and to have most of his carbs as vegetables. He learned that “not all vegetables are created equal” and I taught him to differentiate between those he could eat as much as he wanted at each meal and those he should limit or avoid. We talked about milk consumption, and the health benefits of eating plenty of fatty fish, such as salmon, mackerel and fresh sardine. And we talked about carbs. We talked a lot about carbs. Carbs in fruit, carbs in milk, carbs in bread, pasta and rice, and carbs in vegetables.

I designed an Individual Meal Plan for him, making sure he obtained sufficient macronutrients (protein, fat and carbs) as well as micronutrients (especially potassium, magnesium, sodium, vitamin C and calcium, vitamin D and vitamin K) – and factoring in his desired weight loss. I explained that if he followed his Meal Plan, it is perfectly reasonable for his triglyceride levels to be <2.00 mmol/L in 2 more months.

Three weeks later, his doctor ran his labs again.  His triglyceride level was almost a third what it was! His non-HDL was down substantially and his HDL was rising nicely. When he was seen at the Lipid Clinic, they were willing to give him 2 more months to get his lipids in the normal range before starting him on medication.

Friday, he wrote me telling me that his triglycerides we down well below 2.00 mmol/L and added;

“this amazed the doctor!”

My client left his doctor’s office without a medication prescription and with only the recommendation to keep eating the way I taught him. My client added that he was already within 2 – 3kg of his goal weight.

It’s not magic.

The doctor should not have been amazed that diet alone can be this effective – even for someone for whom high cholesterol has a genetic component. The literature documents the role of a low carb high fat diet.

But it is easier to write a prescription than educate a patient.

My High School Friend – preventable premature death

Last night I learned that my friend since high school, died from natural causes. She had Type 2 Diabetes, high blood pressure and high cholesterol. She and I were the same age.

Three years ago, when my friend was first diagnosed as having Diabetes, she asked my opinion about having received Diabetes counselling in her province to eat 45 gm of carbohydrates at each meal and at least 15 gm of carbohydrates at each of 3 snacks – that’s 180 gm of carbohydrates per day.  A mutual friend of ours from the same province, who had also been recently diagnosed with Diabetes confirmed that she too was advised to eat 45 gm of carbohydrates at each meal and at least 15 gm of carbohydrates at snacks. At that time, I had explained to my friend what I had been learning about the role of excess carbs in Diabetes, hypertension (high blood pressure) and high cholesterol. While I provide distance consultations in my practice (using a combination of phone, email and fax), as Dietitians we are advised specifically not to provide dietary counselling to family members or friends. With my ability to help directly being very limited, I recommended that she find a Dietitian near her who could teach her about managing this triad (called “metabolic syndrome”) using a low carb high fat diet. She followed the  standard dietary recommendations to the letter and took her multiple medications as prescribed. Her blood sugar levels came down using medication (but that was effectively treating the symptom of high blood sugar, not the cause which is the underlying insulin resistance). Her blood pressure kept going higher and higher despite medication, so more medication was added.  She then developed high cholesterol.

Today, my friend is dead, in what may have been an entirely preventable, premature death.

So I am left asking myself ‘could following the standard recommendations of eating 180 gm of carbohydrate per day (or more) with Type 2 Diabetes, high blood pressure and high cholesterol — without treating the underlying cause (insulin resistance) have contributed to her death’?

The literature is certainly full of studies documenting the beneficial effects of a low carb high fat diet on metabolic syndrome – but she was never given that as an option.  She was prescribed medication for lowering blood sugar and blood pressure, but nothing was done to lower her insulin resistance.

A lifetime of work by the late Dr. Joseph Kraft with almost 300,000 people documents that it is the insulin resistance that underlies cardiovascular disease – not the high blood sugar. Furthermore, 65-75% of people with normal blood sugar levels still have insulin resistance – and the same elevated risk of having a heart attack.

We keep treating the symptoms and people keep dying anyways – and those without any symptoms are walking around with elevated risk of dying from cardiovascular disease, and don’t even know it.

We are told;

“Diabetes is a chronic, progressive disease”

which means that once diagnosed with Diabetes, you’ll have it forever – and that eventually it will get worse, requiring medication, then more medication and finally insulin.

When people have bariatric surgery (“stomach stapling”), their blood sugars come back to normal within weeks and at the end of a year, they no longer have any of the clinical symptoms of Diabetes.  Their fasting blood glucose levels are normal and their HbA1C levels are normal. They are essentially as if they don’t have Diabetes. Their Diabetes is in remission.

So is Diabetes REALLY a “chronic, progressive disease”? No, it can be stopped.

If the reason people became Diabetic was because of how they were eating, why is it SO hard to grasp the concept that they could get well, but changing how they are eating?

At the end of the day, we have a choice.

We can do as my client above did and put everything we have into changing how we eat based on good, sound scientific studies and with medical supervision, or we can keep doing what we’ve been doing, expecting different results.

I made my choice a month ago tomorrow, and will write an update in the blog titled “A Dietitian’s Journey” tomorrow, for week four  (see Food for Thought tab, above).  Here’s a teaser; two days ago my blood sugar levels were several times at normal levels – and were overall much lower than a month ago. Last night (twice) and once this morning, my blood pressure was in the normal range.  One month!

I ask myself, what will my labs look like in 3 months or 6 months of addressing the underlying insulin resistance (instead of the symptom of high blood sugar?) What will be life be like, when I have normal blood sugar levels and normal blood pressure and normal cholesterol levels?

It will look better than the alternative.

Rest in peace, dear friend.

you can follow me at:

 https://twitter.com/lchfRD

  https://www.facebook.com/lchfRD/

Note: Everyone’s results following a LCHF lifestyle will differ as there is no one-size-fits-all approach and everybody’s nutritional needs and health status is different. If you want to adopt this kind of lifestyle, please discuss it with your doctor, first.

Copyright ©2017 The LCHF-Dietitian (a division of BetterByDesign Nutrition Ltd.) 

LEGAL NOTICE: The contents of this blog, including text, images and cited statistics as well as all other material contained here (the ”content”) are for information purposes only.  The content is not intended to be a substitute for professional advice, medical diagnosis and/or treatment and is not suitable for self-administration without the knowledge of your physician and regular monitoring by your physician. Do not disregard medical advice and always consult your physician with any questions you may have regarding a medical condition or before implementing anything  you have read or heard in our content.


follow me at:

 https://twitter.com/joykiddieRD

  https://www.facebook.com/lchfRD/


Obesity Rates in Canada and Changes to Canada’s Food Guide

Introduction: Many people look to Canada’s Food Guide (CFG) as the ”measuring stick” as to whether they are eating a healthy diet, but did you know that over the years, CFG has changed dramatically? Canada’s first food guide, the Official Food Rules, was introduced to the public in July 1942. This guide acknowledged wartime food rationing, while endeavoring to prevent nutritional deficiencies and to improve the health of Canadians. Over the years the names of the food groups, the serving sizes and numbers of servings has changed.  Serving sizes are now given in ranges; and one has to wonder if these changes have resulted in ”over-nutrition“.

Changes in Canada’s obesity rates seems to parallel the changes in Canada’s Food Guide which is the topic of this blog.


Canada’s Food Rules — 1949

The post-WWII ”Canada’s Food Rules” of 1949 emphasized people taking in sufficient nutrients to prevent nutritional deficiency as well as to avoid excess, by stressing that ”more is not necessarily better”.

Adult guidelines promoted;

canadas_food_rules_19492 cups or more of full fat milk

1 serving of citrus or tomatoes daily & 1 other fruit

2 serving potatoes plus 2 servings other vegetables (preferably yellow or green and frequently raw)

4 slices of bread with butter and 1 serving whole grain cereal

one serving meat, fish or poultry or dried beans, eggs (3x / week), cheese (3x / week)

use liver frequently


Canada’s Food Guide — 1961

In the 1961 version the language softened; with “Guide” replacing “Rules” in the title. Canada’s Food Guide now sought to emphasize its flexibility and wide-ranging application for healthy eating, recognizing that many different dietary patterns could satisfy nutrient needs.

Adult guidelines promoted;

1961-eng1 1/2 cups or more of full fat milk (decreased by ½ cup)

1 serving of citrus or tomatoes daily & 1 other fruit

2 serving potatoes plus 2 servings other vegetables (preferably yellow or green and frequently raw)

4 slices of bread with butter and 1 serving whole grain cereal

one serving meat, fish or poultry, eggs (3x / week), cheese (3x / week) or dried beans

use liver frequently

Reference: Nutrition Division, National Department of Health and Welfare (1961). Rules out – guide in. Canadian Nutrition Notes, 17(7):49-50 (cited in Health and Welfare Canada. Action towards healthy eating: technical report. 1990).


Canada’s Food Guide — 1977

In 1977 Canada’s Food Guide underwent a dramatic revision. There were now four food groups, instead of five, as fruits and vegetables were combined since their nutrient content overlapped and the name of those groups changed, too.

The Milk group became Milk and Milk Products, to highlight the inclusion of other dairy foods, Meat and Alternates replaced Meat and Fish allowing for vegetarian choices — but also resulting in the inclusion of things like peanut butter in this category, rather than categorized in the fat’ category as occurs in other systems, such as the Food Exchanges.

Most significantly, serving ranges were added.

The big focus was on more carbs and less fats (regardless of what the sources of those fats were) — there was no differentiation between lard and olive oil. There was a shift to using low fat dairy products and the beginning of generations of ”fat phobic” Canadians began.  ”Low Fat” products became all the rage.

cfg_history_1977_two_small2 servings (skim, 2%, whole) milk, buttermilk or yogourt (1 serving = 1 cup milk, ¾ cup yogourt, 1 ½ oz cheese)

4-5 servings fruit & vegetables (at least 2 vegetables) – cooked, raw or fruit juices, include yellow or green or green leafy vegetables

3-5 servings of Bread and Cereal

2 servings  Meat and Alternates – (1 serving = 2-3 oz lean cooked meat, fish or poultry or 2 eggs or 1 cup dried cooked legumes or ½ – 1 cup* nuts or seeds).

In 1977, there was introduction of a concept of ”energy balance“; balancing energy intake with energy output (”calories in / calories out” model) which makes the assumption that basal metabolic rates stays the same.

With the goal of reducing diet-related chronic diseases (such as heart disease and high blood pressure), Canada’s Food Guide encouraged Canadians to reduce salt and fat, without distinguishing between sources of fats. In the process, the quantity of all kinds of fat, including healthy monounsaturated fats such as olive oil and nut and seed oil were all reduced.  Canada’s Food Guide encouraged Canadians to eat plenty of fruits and vegetables without distinguishing between high fiber, non-starchy vegetables and high carbohydrate starchy vegetables. More on that below.

Before 1977, the obesity rate [measured as Body Mass Index (BMI) ≥ 30 kg / m2] of Canadian adults was <10%.  Keep that number in mind. It changes considerably over the years as Canada’s Food Guide recommendations changed.


A report submitted to Health Canada in 1977 by the Committee on Diet and Cardiovascular Disease advised the government to take action to prevent diet-related chronic diseases such as heart disease and high blood pressure, so the emphasis in the revised 1982 Canada’s Food Guide was towards even lower fat products.

Lower fat in products often meant more sugar (as fructose or high fructose corn syrup) being added to products such as yogourt, to help make up for the missing taste. Portions of nuts and seeds which contain heart-healthy monounsaturated fats were reduced in the ongoing push to lower all fat in the diet.

There was a continued shift towards carbs as the main source of calories; not only from Breads & Cereals, but from Fruit & Vegetables too — and in this category, there was no distinction between starchy vegetables (such as potatoes, peas, corn, squash and yams) and non-starchy vegetables, such as salad greens or asparagus.  As a result, a serving of sweet potato was categorized no differently than a serving of salad greens.

Furthermore, a serving of fruit juice was considered equivalent to a serving of fruit; with no concern for the fact that there was no fiber in the juice and significantly more carbohydrates per serving.  Carbs were perceived as ”good” and fat was promoted as ”bad”.  As a result of these changes, under this new Canada’s Food Guide, one could have 3 glasses of juiceone serving of potato and a tiny salad and ”meet” the guidelines.

Canada’s Food Guide — 1982

Adult guidelines promoted;

cfg_history_1982_two_small2 servings (skim, 2%, whole) milk, buttermilk or yogourt (1 serving = 1 cup milk, ¾ cup yogourt, 1 ½ oz cheese)

4-5 servings fruit & vegetables (at least 2 vegetables) – cooked, raw or fruit juices, include yellow or green or green leafy vegetables

3-5 servings of Bread and Cereal

2 servings  Meat and Alternates – (1 serving = 2-3 oz lean cooked meat, fish or poultry or 2 eggs or 1 cup dried cooked legumes or ½ cup* nuts or seeds).

Reference: Ballantyne, R.M., Bush, M.B. (1980). An evaluation of Canada’s food guide and handbook. Nutrition Quarterly, 4(1):1-4.


Canada’s Food Guide — 1992

In 1992, Canada’s Food Guide became Canada’s Food Guide to Healthy Eating.

A new ”total diet approach” aimed to meet both energy (calories) and nutrient requirements, resulted in large ranges in the number of servings in the four food groups.

To meet higher energy needs, the Guide encouraged selection of more servings from the Grain Products and Vegetables and Fruit groups — resulting in an even higher percentage of carbohydrates in the diet.

Adult guidelines servings changed as follows:

cfg_history_1992_two_small3-5   5-12 servings of Bread and Cereal

4-5   5-10 servings fruit & vegetables (at least 2 vegetables) – cooked, raw or fruit juices, include yellow or green or green leafy vegetables

2   2-4 servings (skim, 2%, whole) milk, buttermilk or yogourt (serving = 1 cup milk, ¾ cup yogourt, 1 ½ oz cheese)

2   2-3 servings Meat and Alternates – (1 serving = 2-3 oz lean cooked meat, fish or poultry or 2 eggs or ½ – 1 cup cooked legumes or 2 Tbsp. peanut butter)

Grain Products were now 1st on list (5-12 servings!); reflecting the shift that most of calories (45-65% of calories) were to come from carbs.

Vegetables and Fruit were put 2nd on the list (5-10 servings) and could still be chosen as all carbs (potato, yams, other starchy vegetables, fruit, fruit juice) and along with this, there was a continued decrease in calories from fat (e.g. nut butters went from ½ cup — 1 cup in 1977 to ½ cup 1982 to 2 Tbsp. in 1992)

Also in this Guide, cheese was categorized with milk and yogourt — even though other ways of accounting for food such as the Diabetic Exchanges, classify cheese with Meat and Alternates (and nut butters with fat).


In 2005, there were even more changes to Canada’s Food Guide to Healthy Eating.  This is the Guide currently in use in Canada.

The numbers of servings were broken down based on stage of life and gender, but continuing the emphasis on high carbohydrate, low fat.  There were different number of servings per day for children aged 2-3, aged 4-8, aged 9-13, adolescent girls (aged 14-18), adolescent boys (aged 14-18), men (until aged 50), women (until aged 50) and then men over 50 and women over 50.

While Vegetables and Fruit were now put 1st instead of Grain Products, these could still be chosen as mostly carbs (potato, yams, other starchy vegetables, fruit, fruit juice), so with Grain Products put 2nd, carbs still formed the bulk of daily calories.


Canada’s Food Guide — 2005

Adult guidelines promoted (adults aged 19-50 years):

CFG 20055-10   7-8 (women) 8-10 (men) servings fruit & vegetables (at least 2 vegetables) – cooked, raw or fruit juices, include yellow or green or green leafy vegetables

5-12   6-7 (women) 8 (men) servings of Grain Products

2-4   2 (women and men) servings (skim, 2%, whole) milk, buttermilk or yogourt (serving = 1 cup milk, ¾ cup yogourt, 1 ½ oz cheese)

2-3 servings Meat and Alternates – (1 serving = 2-3 oz lean cooked meat, fish or poultry or 2 eggs or ½ – 1 cup cooked legumes or 2 Tbsp. peanut butter)

Recommendations include:

Vegetables and Fruit

go for orange vegetables such as carrots, sweet potatoes* and winter squash*

*Note: starchy vegetables such as sweet potato and winter squash contain the SAME number of carbohydrates per serving as a serving of Breads and Cereals i.e. 15 g carbohydrate per ½ cup serving compared with non-starchy vegetables such as asparagus, broccoli and salad greens.

Under this Guide, Vegetables and Fruit can contribute 105 g — 150 g carbs per day (400 — 600 calories per day) if chosen as starchy vegetables and fruit / fruit juice.

Milk and Alternates

The Guide recommends: ”Drink skim, 1% or 2% milk each day” which overlooks the satiety (feeling fuller) effect of higher fat dairy.

”select lower fat milk alternates” — fails to look a the fact that loads of sugar as flavouring replaces the fat, contributing the equivalent of 2 — 4 servings of carbs per 3/4 cup serving (where a serving of carbs as per the Food Exchanges is considered 15 g carbohydrate per serving)

Oils and Fats

The Guide recommends: ”include a small amount (2-3 Tbsp.) of unsaturated fat each day.  This includes oil for cooking, salad dressing, margarine and mayonnaise. Use vegetable oils such as canola and soybean” resulting in the decrease of healthy-monounsaturated fats such as olive oil, nuts and seeds.

Children

The Guide recommends to ”serve small nutritious meals and snacks daily

Three meals AND a few snacks?

What effect have these dietary recommendations had on obesity statistics?

Let’s look at children;

  • In 1978, only 15% of children and adolescents were overweight or obese.
  • By 2007, that rate doubled to 29% of children and adolescents being overweight or obese.
  • By 2011, obesity prevalence alone for boys was 15.1% and for girls was at 8.0% in 5 to 17 year olds.

What about adults?

  • The prevalence of obesity [body mass index (BMI) ≥30 kg/m2] in Canadian adults increased from 10% in 1970-72 to 26% in 2009-11
  • Based on waist circumference 37% of adults and 13% of youth are abdominally obese.
  • Looking at these numbers slightly differently, as of 2013, there were approximately 7 million obese adults and 600 000 obese school-aged children in Canada

One has to wonder whether this dramatic increase in obesity and overweight after 1977 is correlated to Canada’s Food Guide shift to lower fat, higher carbohydrate diets.

In my  Dietetic practice, I give clients a choice of meal plan patterns because I don’t believe three meals and three snacks per day with 45-65% of calories as carbohydrate is the best way for people to address the matter of their excess weight.

For clients that come to me insulin resistant and/or overweight, I explain based on the literature why I recommend a meal plan pattern based on full meals without snacks with most of the calories coming from heart healthy satiety-offering monounsaturated fats. When clients are able to eat until they are satisfied without feeling hungry between meals and without feeling deprived, they are able to lose weight naturally and relatively easily.

Of course if clients want a meal plan based on the traditional 3 meals and 3 snack meal pattern I provide that for them using current recommendations.  There is no question that both ways, people can lose weight and lower their blood sugars, but my interest as a Dietitian is not only to see people’s weight and blood sugar and cholesterol come down, but to also see them feeling good and being happy with the process.

If you would like more information on the services I offer, please click on the Contact Us tab, above to send me a note.

Note: Everyone’s results following a LCHF lifestyle will differ as there is no one-size-fits-all approach and everybody’s nutritional needs and health status is different. If you want to adopt this kind of lifestyle, please discuss it with your doctor, first.

Copyright ©2015 The LCHF-Dietitian (a division of BetterByDesign Nutrition Ltd.) 

LEGAL NOTICE: The contents of this blog, including text, images and cited statistics as well as all other material contained here (the ”content”) are for information purposes only.  The content is not intended to be a substitute for professional advice, medical diagnosis and/or treatment and is not suitable for self-administration without the knowledge of your physician and regular monitoring by your physician. Do not disregard medical advice and always consult your physician with any questions you may have regarding a medical condition or before implementing anything  you have read or heard in our content.

Canada’s Food Guide — an Epidemiological Experiment Gone Terribly Wrong?

Health Canada released a statement this past Tuesday (May 19, 2015) implying they may change Canada’s Food Guide recommendations. Their statement came just a week after a Canadian Medical Association Journal released a report a week earlier (May 11, 2015) summarizing some of the criticisms of the Guide made by healthcare professionals who presented at the Canadian Obesity Summit in Toronto at the beginning of May.  One of the criticism included Health Canada’s current endorsement of 100% juice as equivalent to a serving of fruit.

Canada’s Food Guide (officially called Eating Well with Canada’s Food Guide) recommends that Canadian adults consume up to 10 servings of fruit and vegetables a day (depending on age and gender) and with a half-cup of juice counting as a single serving, it’s easy to see how a person might drink a few cups of fruit juice a day in order to try and meet that requirement.  The problem arises that even a single glass of orange juice can put you over the daily sugar limit recommended by the World Health Organization (WHO).

In March, the World Health Organization (WHO) released a report entitled Guideline: Sugars intake for adult and children where it concluded that the world was consuming too much sugar and recommended that people cut their intake of sugar to the equivalent of just six to 12 teaspoons per day.

Many popular brands of 100% orange and apple juice sold in Canada contain as much as five teaspoons of sugar per serving so it’s easy to see that if the public is trying to meet their 7-10 servings of fruit and vegetables by drinking juice, they will be way over the WHO’s daily sugar limit.

A study from the UK that was just published 2 weeks ago in the European journal Diabetologia linked daily consumption of sweetened drinks including so-called ”healthy” beverages like sweetened milk and fruit juice with increased diabetes risk. The study found that for each 5% increase of a person’s total energy intake provided by sweet drinks (even so-called ”healthy ones” like chocolate milk and 100% juice) that the risk of developing Type 2 diabetes could rise by 18 %. The study also found that by replacing one sweetened drink with water or unsweetened tea or coffee per day could help cut the risk of developing diabetes by as much as 25%.

This most recent statement from the director of the Office of Nutrition Policy and Promotion Hasan Hutchinson said the department is currently ”reviewing the evidence base for its current guidance” to Canadians and that ”depending on the conclusions of the scientific review, guidance for consumption (quantity and frequency) of various foods, including juice, could be updated in the future“. In my opinion, consumption of 100% fruit juice as equivalent to a serving of Vegetables and Fruit is not the only aspect of Canada’s Food Guide that Health Canada needs to re-evaluate.

Shift to a Carbohydrate-based Diet; how has that worked out?

Prior to 1977, Canada’s Food Guide recommended no more than 5 servings of bread or cereal per day for adults and now recommends 6-7 servings per day of Grain Products for women and up to 8 servings of Grain Products per day for men. In 1961, Canada’s Food Guide recommended only 1 serving of citrus fruit (as fruit) or a serving of tomatoes daily & only one other fruit.  Now adults can have any of the recommended 7-10 servings of Vegetables and Fruit per day as fruit (or juice). Even as actual servings of fruit, current recommendations can be chosen as 4-5 times the amount of fruit as in in 1961.

Since 1977 and in ever increasing amounts, Health Canada has shifted their recommendations away from healthy fats and low carbohydrate diets, towards diets where carbohydrates form the main source of calories.  Current recommendations are for 45-65% of calories to come from carbohydrate and only 20- 30% of calories from fat.  Our society has become ”fat phobic” thinking all sources of fat are ”bad”. People drink skim or 1% milk and eat 0% yogourt and low fat cheese; all the while making sure to have ”enough’ carbohydrates; 6-8 servings of Grains Products (including bread, pasta and rice). Hidden as Vegetables are even more carbohydrates as the 7-10 servings of Vegetables and Fruit which are recommended for an adult to eat makes no distinction between starchy vegetables (like potatoes, yams, peas and corn) and non-starchy vegetables (like salad greens and asparagus or broccoli). People can literally eat all their Vegetable and Fruit servings as carbohydrate laden starchy vegetables and fruit and ”meet” Canada’s Food Guide!

Canadians are encouraged to fill themselves up on toast or cereal for breakfast, sandwiches or rice for lunch and pasta or pizza (with ”healthy toppings”) for supper; all in an effort to ”meet” Canada’s Food Guide.

At the same time, people have been conditioned to avoid fats because they believe that fat is ”bad”; while making no distinction between healthy fats from avocado, nuts, seeds and fatty fish and fats from chemically cured bacon and nitrite- laden sausage.

What Has Happened to Canada’s Obesity Rates since 1977?

In ever increasing amounts, Health Canada has recommended that we avoid fat and get 1/2 to 2/3 of our calories from carbohydrates? How has Canada’s obesity rate changed since then?

In 1978, only 15% of children and adolescents were overweight or obese.

By 2007, 29% of children and adolescents were overweight or obese.

By 2011, just the obesity prevalence for boys was 15.1% and for girls was 8.0% in 5- to 17 year olds.

What about adults?

The prevalence of obesity [body mass index (BMI) ≥30 kg/m2] in Canadian adults increased two and a half times; from 10% in 1970-72 to 26% in 2009-11.

In 1970-72 7.6% of men and 11.7% of women were considered obese.

In 2013, 20.1% of men and 17.4% of women were considered obese.

And looking at waist circumference rather than BMI, 37% of adults and 13% of youth are currently considered abdominally obese.

So how has Health Canada’s recommendations of a high carbohydrate low fat diet been working out?

Certainly there must be a better way?

There is.

More in my next blog.

In the meantime, if you would like to learn a better way to think about food why not contact me?

I can help you begin to tackle overweight or obesity in a way that encourages eating healthy fat and which are supported by current research literature.

I can also help you learn which sources of carbohydrate provide the best nutrition to meet your daily recommended nutrient intake for vitamins and minerals as well as how to eat in a way that can begin to tackle one of the main issues associated with being overweight; that of insulin resistance.

Click on the “Contact Us” tab above, to send me a note.


References

Canadian Medical Association Journal, Early Releases (May 11, 2015), Food Guide Under Fire at Obesity Summit, www.cmaj.ca/site/earlyreleases/11may15_food-guide-under-fire-at-obesity-summit.xhtml

http://www.cbc.ca/news/health/canada-food-guide-s-listing-of-juice-as-a-fruit-serving-called-bananas-1.3080658

http://www.ctvnews.ca/health/will-fruit-juice-be-cut-from-canada-s-food-guide-1.2380960

Janssen I, The Public Health Burden of Obesity in Canada, Canadian Journal of Diabetes, 37 (2013), pg. 90-96

Nutrition Division, National Department of Health and Welfare (1961). Rules out – guide in. Canadian Nutrition Notes, 17(7):49-50 (cited in Health and Welfare Canada. Action towards healthy eating: technical report. 1990).

O’Connor, L, Imamura F, Lentjes M et al, Prospective associations and population impact of sweet beverage intake and type 2 diabetes, and effects of substitutions with alternative beverages, Diabetologia May 6, 2015 [Epub ahead of print]

Statistics Canada, Overweight and obese adults (self-reported) 2009, http://www.statcan.gc.ca/pub/82-625-x/2010002/article/11255-eng.htm

World Health Organization, Guideline: Sugars intake for adult and children, March 2015, http://who.int/nutrition/publications/guidelines/sugars_intake/en/

Note: Everyone’s results following a LCHF lifestyle will differ as there is no one-size-fits-all approach and everybody’s nutritional needs and health status is different. If you want to adopt this kind of lifestyle, please discuss it with your doctor, first.

Copyright ©2015 The LCHF-Dietitian (a division of BetterByDesign Nutrition Ltd.) 

LEGAL NOTICE: The contents of this blog, including text, images and cited statistics as well as all other material contained here (the ”content”) are for information purposes only.  The content is not intended to be a substitute for professional advice, medical diagnosis and/or treatment and is not suitable for self-administration without the knowledge of your physician and regular monitoring by your physician. Do not disregard medical advice and always consult your physician with any questions you may have regarding a medical condition or before implementing anything  you have read or heard in our content.