
News outlets highlight when someone has died of complications of COVID-19, stressing that the person “had no underlying health conditions“, but the problem is that this is often assumed, not assessed. Just because a person wasn’t diagnosed with diabetes, heart disease or high blood pressure (or some other disease) does not mean that they have no underlying health conditions.
Not Assessed – assumed “fine”
We have known since 2018 that 88% of Americans are metabolically unhealthy[1], which means that only 12% of adults are metabolically healthy. An adult dying with “no underlying health conditions” may simply mean they hadn’t been assessed. Many people have never had their waist circumference measured by a health care professional, nor had their blood sugar, blood pressure or cholesterol checked, and the results compared to healthy standards. If these things haven’t been measured, can we assume that a person is metabolically healthy?
Measures of metabolic health include [1]:
- Waist Circumference: < 102 cm (40 inches) for men and 88 cm (34.5 inches) in women
- Systolic Blood Pressure: < 120 mmHG
- Diastolic Blood Pressure: < 80 mmHG
- Glucose: < 5.5 mmol/L (100 mg/dL)
- HbA1c: < 5.7%
- Triglycerides: < 1.7 mmol/l (< 150 mg/dL)
- HDL cholesterol: ≥ 1.00 mmol/L (≥40 mg/dL) in men and ≥ 1.30 mmol/L (50 mg/dl) in women.
If a person hasn’t had their waist circumference, blood sugar or pressure, or cholesterol assessed, then they are assumed to have no underlying health conditions. Not measuring it doesn’t mean it doesn’t exist.
Given that only 12% of US adults are metabolically healthy, it is more likely that an adult who dies of complications of COVID-19 and are said to have “no underlying health conditions” simply had not been previously assessed for markers of metabolic health. If one is not assessed, they can’t be diagnosed.
Tested and everything is “fine”
In a fasting blood glucose test, we only know what happens to blood sugar when the person is fasting — but if we don’t know what happens to their blood sugar between 30 minutes and 60 minutes after consuming a carbohydrate load, then we simply don’t know if they are at risk.
A glycated hemoglobin test (HbA1C) provides an estimate of average blood sugar over a 3-month period at all times (both fasted and after eating), and provides more information than only having a fasting blood glucose test. It will spot those that have overall higher-than-normal blood sugar, even if it is normal in the morning when they’ve been fasting. However, even these two tests together will still miss a significant percentage of people who have normal blood sugar at fasting, and 2 hours after a carbohydrate load.
A 2-hour Oral Glucose Tolerance Test (OGTT) is usually only given to pregnant women and to those who already show abnormal fasting blood sugar and/or HbA1C and is considered the best way to determine if someone is at risk of becoming diabetic. It measures blood sugar at fasting and again 2-hours after a glucose load, but it will completely miss those who have significant blood sugar spikes between 30 minutes and 60 minutes, because it doesn’t measure it.
We know from research that a higher blood glucose peak >7.0 mmol/L (126 mg/dl), a delayed glucose peak >30 minutes), or blood sugar levels >7.0 mmol/L (126 mg/dl) at 30 minutes and >6.5 mmol/L (117 mg/dl) at one hour are all signs of insulin resistance and hyperinsulinemia, and correlate with higher insulin levels[2] — abnormal conditions outline in this previous article). If blood sugar 30 minutes and/or 60 minutes after a glucose load isn’t assessed, it can’t be assumed to be “fine”?
We also know from the research that if a person has a blood sugar spike >8.6 mmol/l (155 mg/dl) one-hour after a carbohydrate load that this is a better predictor of future diabetes, cardiovascular disease and death than a blood sugar reading of 7.8 mmol/l at 2 hours [3]. The problem is, a standard Oral Glucose Tolerance Tests doesn’t measure blood glucose except at baseline (fasting) and at two hours. It doesn’t look at blood sugar at 30 minutes and/or 1 hour. If it isn’t assessed then we simply don’t know.
Not tested – not fine
Three quarters of adults overweight or obese
New NHANES data released this week indicates that more than 73% of US adults are either overweight or obese[5]. Rates of overweight are so prevalent, that many people considered overweight ‘normal’, and only obesity and severe obesity as a problem. Just because something is common, does not make it normal.
Rates of overweight in men are going down, but this is not a good thing because rates of obesity are skyrocketing (see solid lines in the graph below)[5].
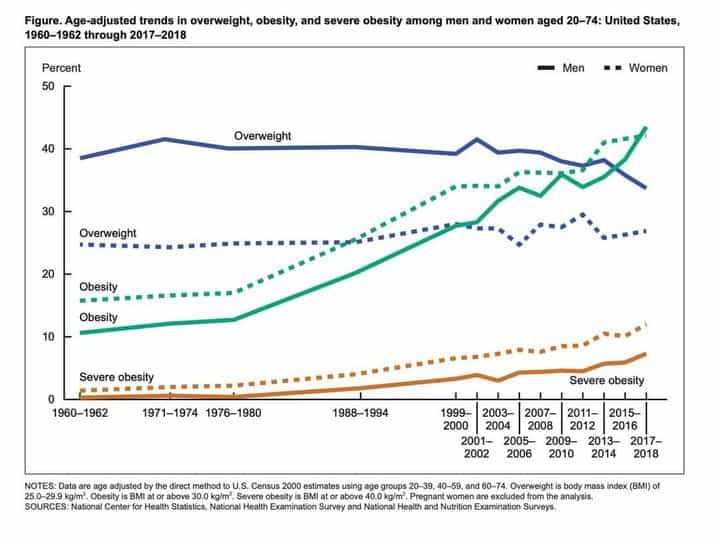
People who are overweight have a BMI > 24.9, and those who are obese have a BMI > 29.9. Based on the latest data, almost three-quarters of US adults are overweight or obese, but BMI does not assess metabolic health, only weight to height ratio. BMI doesn’t tell us the whole story, as athletes who are very muscular may have a high BMI and those with normal BMI may be metabolically unhealthy.
People who are overweight or obese will have waist circumferences that are >40 inches (102 cm) for men, and >34.5 inches (88 cm) for women — and based on the definition above, this increased weight carried around their abdomen is what causes them to be considered metabolically unhealthy[1]. In addition, they often have high blood pressure, high fasting blood glucose and/or HbA1C, and may also have high triglyceride levels and/or low HDL cholesterol levels…and we haven’t even assessed what happens to their blood sugar 30 minutes or 60 minutes after a carbohydrate load!
Final thoughts…
America is a nation with underlying health conditions; only 12% of adults are metabolically healthy and only slightly more than a 1/4 have a normal body weight.
While Canada’s obesity rates were slightly better when last measured, how many Canadians have normal waist circumference — let alone normal blood pressure, normal fasting blood sugar, HbA1C or triglycerides or HDL cholesterol? In fact, how many people in either country even know what a healthy waist circumference is?
More Info?
If you would like more information about restoring your weight and metabolic health, please send me a note using the Contact Me form on the tab above.
To your good health!
Joy
You can follow me on:
Twitter: https://twitter.com/lchfRD
Facebook: https://www.facebook.com/lchfRD/
Instagram: https://www.instagram.com/lchf_rd
References
- Araíºjo J, et al Prevalence of Optimal Metabolic Health in American Adults: National Health and Nutrition Examination Survey 2009—2016. Metabolic Syndrome and Related Disorders Vol 20, No. 20, pg 1-7, DOI: 10.1089/met.2018.0105
- , Enhanced Predictive Capability of a 1-Hour Oral Glucose Tolerance Test: A Prospective Population-Based Cohort Study,
- Crofts, C., et al., Identifying hyperinsulinaemia in the absence of impaired glucose tolerance: An examination of the Kraft database. Diabetes Res Clin Pract, 2016. 118: p. 50-7.
- Fryar C, et al “Prevalence of overweight, obesity, and severe obesity among adults aged 20 and over: United States, 1960—1962 through 2017—2018” NCHS Health E-Stats; 2020.
Copyright ©2020 The Low Carb Health Fat Dietitian (a division of BetterByDesign Nutrition Ltd.)
LEGAL NOTICE: The contents of this blog, including text, images and cited statistics as well as all other material contained here (the ”content”) are for information purposes only. The content is not intended to be a substitute for professional advice, medical diagnosis and/or treatment and is not suitable for self-administration without the knowledge of your physician and regular monitoring by your physician. Do not disregard medical advice and always consult your physician with any questions you may have regarding a medical condition or before implementing anything you have read or heard in our content.