Ten Common Low Carb Myths

In my time interacting on social media (Facebook, Twitter) as the LCHF-Dietitian (@lchf-RD) I keep coming across many of the same misconceptions about eating a low carb diet, so I decided to write an article dispelling 10 of the most common myths.

Myth 1: “A low carb diet will cause clogged arteries and heart attacks because it is too high in saturated fat.”

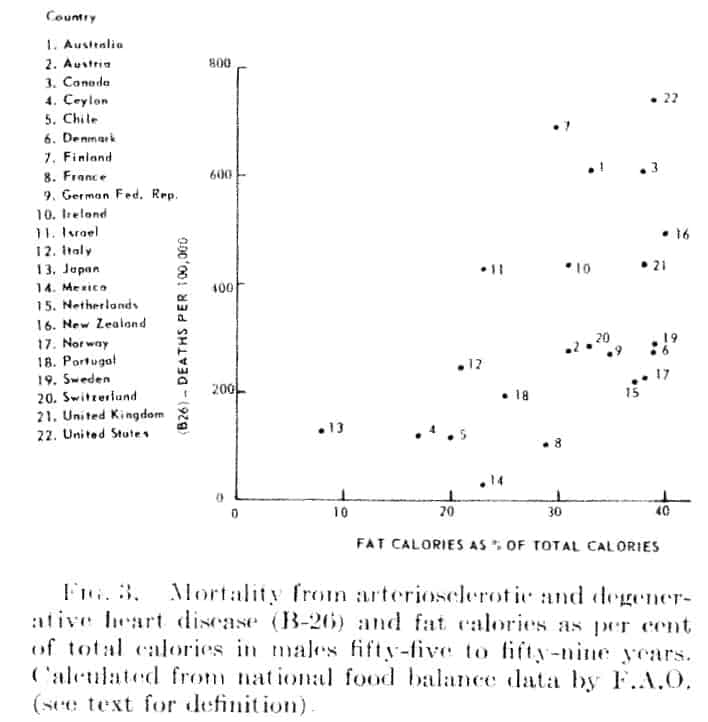
Firstly, as elaborated on in a previous article, a recent study published at the end of March 2018 in Nutrients looked at health and nutrition data from 158 countries worldwide and found that total fat and animal fat consumption were least associated with the risk of cardiovascular disease, so even if someone following a low carb diet chose to eat foods high in saturated fat, it does not mean they are necessarily at higher risk of heart attacks or strokes.

Secondly, a low carb diet does not necessarily have to be high in saturated fat. In fact,  it may have very little added fat at all such as when people are aiming to lose weight, so that they burn more of their own body fat.

While there is no increased risk with eating the saturated fat that is naturally found in meat (chicken, beef, pork, etc.), except for specific clinical requirements (for example, a ketogenic diet for epilepsy) there is no reason anyone has to add additional saturated fat. There are other sources of fat that are delicious and have beneficial properties, such as monounsaturated fats found naturally in olive oil and avocados and their oils.

Myth 2: “A low carb diet has way too much protein in it!”

There are different types of low carb diets and a low carb diet may not necessarily have a lot of protein – whether as eggs, cheese, meat, or fish.

In a very low carb (ketogenic) diet used for epilepsy, the diet is mostly fat and has low protein, however in a low carb diet used for weight loss and improving metabolic conditions such as Type 2 Diabetes or high blood pressure, the amount of protein will be moderate.

How much protein is “too much”?

The RDA for Protein is set at 56 gm per day (based on 0.8 g protein per kg of body weight) is the minimum amount to prevent deficiency.  This is not the optimal amount, but the absolute minimum amount. So, whether a given person is eating 1200 calories a day or 2500 calories per day they have an absolute requirement for 56 gm of protein per day.

The maximum amount of protein per day is set at ~200 g / day and is calculated based on >2.5 g protein per kg of body weight, and the range from 56 g to 200 g of protein per day is referred to as the range of safe intake.

According to Dr. Donald Layman, Professor Emeritus of Human Nutrition from the University of Illinois, a high protein diet doesn’t start “until well above 170 g / day”.  You can read more about this here.

Everybody’s needs for protein is different and many people, especially adults and older adults are either not getting enough protein or it is mostly at dinner, with little at breakfast and lunch, which is a concern in older adults, as it puts them at risk for sarcopenia, the muscle wasting often seen in older adults eating a Westernized diet.  You can read more about that here.

In any case, most low carb diets aren’t anywhere near the level of what is considered a “high protein diet”, let alone “too high in protein”.

Myth 3: “Low Carb Diets involve eating lots of meat”.

While there are some, especially those involved in the body-building or body-sculpting world that choose to follow a variation of a low-carb diet which involves eating lots of meat (and protein, in general), there are some variations of a low-carb diet that don’t involve eating meat at all.  As mentioned above, ketogenic diets used for those with epilepsy or seizure disorder are mostly fat and ketogenic diets used as an adjunct therapy in treatment of specific types of cancer are often mostly fat, as well depending on the specific type of cancer.

Therapeutic low carb or ketogenic diets used for weight loss or improving metabolic conditions such as Type 2 Diabetes, high blood pressure and abnormal cholesterol may be based on a moderate amount of protein, with some of that as meat if the individual eats it and enjoys it. To eat low-carb,  there is no requirement to eat meat at all.

A low carb diet can be designed to accommodate pescatarians (those that only eat fish), as well as vegetarians. There are even some vegans that choose to follow a low carb diet for a variety of reasons, although getting enough of all nutrients is a major challenge, just as it is for those following a Standard American/Canadian Diet.

I’ve written an article about the range of foods that can be eaten on a low carb diet which can be read here.

Myth 4: “Low carb diets are dangerous because the brain needs a certain amount of carbohydrate”.

Except for erythrocytes (red blood cells) every cell in the body has mitochondria (the so-called “powerhouse of the cell”). The mitochondria can use a variety of fuel sources and turn it into Acetyl-CoA, which then enters the Kreb’s Cycle and generates Adenosine Triphosphate (ATP) which is what every cell in the body requires for life. The brain is no different than any other cell in the body that has mitochondria, as it can efficiently and safely use Acetyl-CoA can be made from carbohydrate (e.g. glucose), ketone bodies (a byproduct of fatty acid breakdown) and amino acids from protein to generate Acetyl-Coa. Most parts of the brain have no requirement for dietary carbohydrate, as it can use ketones generated from fat breakdown.

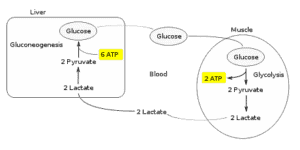
Certain parts of the brain and red blood cells do need glucose (approximately 30 g a day) and that need is fulfilled by a process called gluconeogenesis where glucose is made by the liver and kidneys from substrates other than carbohydrate, including amino acids (from proteins) or glycerol  (from fat breakdown).

In fact, the human body doesn’t require any dietary carbohydrate provided the amount of protein and fat in the diet is sufficient (to be used as substrates, as mentioned above); from page 275 of Dietary Reference Intakes for Energy, Carbohydrate, Fiber, Fat, Fatty Acids, Cholesterol, Protein and Amino Acids (2005);

The lower limit of dietary carbohydrate compatible with life apparently is zero, provided that adequate amounts of protein and fat are consumed. 

Please see this article for more information.

This does not mean that low carb diets contain no carbohydrate! As mentioned above, some liberal low carb diets have enough carbohydrate such that the person does not go into ketosis, while therapeutic ketogenic diets (done under medical supervision) such as those used for the management of epilepsy or as an adjunct to cancer treatment may have < 30 g of carbohydrate.

Myth 5: “A Low carb diet is imbalanced and causes nutrient deficiencies”.

With the exception of a therapeutic ketogenic diet for epilepsy or as an adjunct to cancer treatment, eating a well-formulated low-carb diet provides adequate nutrients, even those such as thiamine (vitamin B1) and folate which are normally associated with grain products. There are many low-carb sources of thiamine, including pork, chicken liver, macadamia nuts and peanuts, flax-seed and asparagus and just 1 serving of each of these can meet an adult’s daily requirement.

Likewise, there are many low-carb sources of folate (vitamin B9), including the low carb leafy vegetables that are abundant in a well-formulated low carb diet, as well as other green vegetables such as asparagus, spinach, Brussels Sprouts and avocado.

Vitamin C is plentiful in foods outside of citrus fruit, including red and green bell pepper, broccoli, cauliflower and strawberries, as well as in lemon and lime that can be used as a seasoning for salad dressing, fish or to flavour water.

Calcium is easily obtained from well-designed meal plans that include cheese and yogurt, fish (such as sardines and canned salmon), almonds and leafy vegetables such as spinach, collards and kale.

A well-designed low carb diet provides a wide range of foods; from cheese and other dairy products, nuts, seeds, fruit, low carb vegetables and meat, fish and poultry and can provide the essential nutrients that a healthy body requires, including vitamins and minerals.

The only two nutrients that will likely be sub-optimal are vitamin D and magnesium— but are certainly not provided in lesser amounts than in the average Canadian or American diet. I advocate for supplementation of both of these nutrients, whether someone is following a Standard American or Canadian diet or a low-carb diet.

Myth 6: “Low carb diets are so restrictive”.

This is one of the two myths that I often joke about around the dinner table, because the food we eat is anything but restrictive.

People can eat a huge variety of vegetables and meat, fish and poultry which require the minimum of cooking and food preparation so even for someone with little or no cooking skill or time to prepare food, a well-designed low carb diet is entirely possible.  I design them for clients all the time, because many people fall into this category or live alone and don’t want to cook elaborate meals for themselves.

For those that enjoy cooking and have the time to do it there are very few, if any traditional foods that can not be made low carb – and made very tasty!

As can be easily seen in the recipes on this web page, as well as the article I wrote on what people can eat on a low carb diet, there is almost no recipe that can be adapted for those that choose to eat low carb.  There is even rolls for sandwiches and several different types of pizza (to suit those who follow a higher fat low carb diet or a lower fat low carb diet).  I invent the recipes for myself and share them on my webpage because food should not only be healthy, but enjoyable.

Myth 7: “Low carb diets are not sustainable”.

This is the second myth that makes me chuckle, because I know of people that have been eating this way for 15 or 20 years which in and by itself demonstrates it is quite sustainable. There are one-year and two-years studies on this web page the also indicate that a well designed low carb diet is quite sustainable.

What is ”not sustainable” about eating fresh, healthy, whole foods that can be prepared with a minimum of cooking or as elaborate as one’s imagination allows?

Myth 8: “Low carb diets require you to constantly count carbs and check your ketone levels”.

First of all, a well-designed low carb Meal Plan does all the “carb counting” for you – all you need to do is decide what you want to eat. This is no different whether someone eats a moderate amount of carbs or a low amount of carbs. In fact, how foods are grouped on your Meal Plan, you’ll know how many carbs are in one serving any food in that group, should you want to add something to your Meal Plan.

As far as checking ketones, unless one is on a low level of carbohydrates (ketogenic diet) and either has certain health conditions or taking specific medications, there is no need.

Myth 9: “It doesn’t matter if you eat low carb or low fat, the only thing that matters is Calories In Calories Out”.

This answer may stir up some controversy, because there is a wide range of opinion on this.

Some advocates of a low-carb diet insist that Calories In Calories Out (CICO) is irrelevant because metabolism is different when one eats low carb. Some advocates of a low-fat diet will say that low-carb only works because in the end, people eat less calories.

I think it is “both / and not “either / or”.

Most low-fat diets are calorie-restricted diets and when calories are restricted, people’s metabolism slows down.  That is why people following a  carbohydrate-based low-calorie diet feel cold, tired and lethargic; because their body is conserving the calories it is getting for important metabolic functions. Because the body is primarily using carbohydrate as fuel, fat stores are only accessed when carbohydrate is restricted – which also slows down metabolism.

When people are eating a diet that is low in carbohydrate and which has sufficient protein, and is higher in a variety of fats, people’s bodies are mainly using fat as fuel. If their Meal Plan is designed for weight loss, then some of the fat they are using for fuel is their own fat stores – so ‘fuel’ is never restricted.  If the body needs more energy, it will take the “extra” it needs from fat stores. In this way, the body doesn’t have to slow metabolism to conserve energy, because there is always more fat in the person’s fat stores. Eating a diet based predominantly based on healthy fats and protein with much lower level of carbohydrates makes people feel full after eating much less, so the end result is that they generally eat less calories, which is why they are able to lose weight.

That is, a calorie is still a calorie but all fuels are not considered equal.

Myth 10: “Ketones are dangerous and you can die from them!”

Unfortunately, this is way too common a myth – even one in which some healthcare professionals are confused.

Ketones are naturally produced in our bodies during periods of low carb intake, in periods of fasting for religious or medical tests, and during periods of prolonged intense exercise. This state is called ketosis. It is normal and natural and something everyone’s body does when using fat as its main fuel source.

Once our glycogen levels are used up, fat is broken down for energy and ketone bodies are a byproduct of that. These ketones enter into the mitochondria of the cell and are used to generate energy (as ATP) to fuel our cells.

Ketosis is a normal, physiological state and we may produce ketones after sleeping all night, if we haven’t gotten up and eating something in the middle of the night.

Ketoacidosis on the other hand is a serious medical state that can occur inuntreated or inadequately treated Type 1 Diabetics, where the beta cells of the pancreas don’t produce insulin. It may also occur in those with Type 2 Diabetes who decrease their insulin too quickly or who are taking other kinds of medication to control their blood sugars.

In inadequate management of Type 1 Diabetes or in insulin-dependent Type 2 Diabetes, ketones production will be the first stage in ketoacidosis. This is not the case when the above medical issues are not present.

Final Thoughts…

There are a wide range of low-carb diets with various levels of carbohydrate, protein and fat. Some are high in meat, others low in meat, while others have no meat at all. Some are very high in protein and others are very high in fat. Some promote weight loss, others make it very difficult. There are different types of low carb diets because they are used for different purposes.

Each person’s requirement for protein is different, so following a generic “low carb diet” downloaded from the internet will be based on an ‘average’ amount of protein for adults and not your needs . The amount of fat you will be encourage to eat will be based around the protein needs that are set by the web page. If you are wanting to lose weight, very often you may find that you lose a bit at first and then weight plateaus for extended periods of time.  Many of my clients come to me after trying this approach, feeling that a “low carb diet doesn’t work for me”.  The issue very often is that the plan wasn’t designed for “them” at all.

Most general types of “low carb diets or plans” allow people to select the level of carbohydrate they want to limit. Often, people will choose a ketogenic level because they want to lose weight quickly, with little regard for making sure they are getting sufficient nutrients.

For otherwise healthy young adults with no major risk factors and who are not taking any medications, this might work out fine however for adults with medical or metabolic conditions – and especially for those taking medications for Diabetes or high blood pressure, this can put them at significant risk. As outlined in more detail in a previous article, medical supervision is absolutely required before a person changes the level of  their carbohydrate intake if they are taking;

(1) insulin

(2) medication to lower blood glucose such as sodium glucose co-transporter 2 (SGLT2) medication including Invokana, Forxiga, Xigduo, Jardiance, etc.

(3) medication for blood pressure such as Ramipril, Lasix (furosemide), Lisinopril / ACE inhibitors, Atenolol / β₁ receptor antagonists

or

(4) mental health medication such as antidepressants, medication for anxiety disorder, and mood stabilizers for bipolar disorder and schizophrenia.

For everyone who does not fall into the above category, it’s important to realize that there is a very big difference between a generic meal plan downloaded from a “low-carb” website and one designed just for you, based on your physiological needs and ensuring that you get adequate nutrients based on your own medical history and family risk factors. For a low-carb style diet to provide the nutrients that you need for your age, gender and activity level, it needs to be designed for you; factoring in your need for specific nutrients.  It’s not simply a matter of choosing a level of “macronutrients”  (“macros”) such as carbohydrate, fat and protein, but ensuring adequate “micronutrients”, too. That is the difference between having an Individual Meal Plan designed specifically for you by a knowledgable Registered Dietitian and one that is based on general cutoff points.

For this to be a way of eating that is balanced in terms of overall nutrients and will meet specific health goals and which is healthy and interesting enough to be sustainable over the long term, it needs to be carefully designed for each individual.

Do you have questions about how I can help design a Meal Plan for you? Or for you and your partner?

Please send me a note using the Contact Me form located on the tab above and I will reply shortly.

To your good health!

Joy

You can follow me at:

 https://twitter.com/lchfRD

  https://www.facebook.com/lchfRD/


Copyright ©2018  The LCHF-Dietitian (a division of BetterByDesign Nutrition Ltd.) 

LEGAL NOTICE: The contents of this blog, including text, images and cited statistics as well as all other material contained here (the ”content”) are for information purposes only.  The content is not intended to be a substitute for professional advice, medical diagnosis and/or treatment and is not suitable for self-administration without the knowledge of your physician and regular monitoring by your physician. Do not disregard medical advice and always consult your physician with any questions you may have regarding a medical condition or before implementing anything  you have read or heard in our content.


The Perils of Food Processing — Part 1

This article is based on a lecture given by Gabor Erdosi, MSc, MBA— Food News Conference, May 19, 2018 — Prague, Czech Republic

Introduction — Gabor Erdosi, MSc, MBA is a Molecular Biologist from Debrecen, Hungary who is employed in the Food Industry but whose hobby is reading scientific publications and analyzing the available information. The talk that this article is based on was given at the Food News Conference, May 19, 2018 — Prague, Czech Republic  and is the condensation of approximately 4 years worth of Gabor’s studying of the literature.

Gabor founded and heads up the Lower Insulin group on Facebook which is dedicated to discussing the scientific basis of the relationship between metabolic diseases and food and lifestyle factors. At present, the group has ~5300 members.

This new series titled The Perils of Food Processing reflects Gabor’s conviction that what’s of primary importance in the interaction between food and our physiology (GI tract) is the speed and location of food absorption in the digestive system. This article is arranged according to the same principle.

The reason I am writing this series of articles is because I believe what Gabor Erdosi has come to understand about the effects of food processing on the speed and location of food absorption — especially carbohydrate, and which affects the very nature of hunger and satiety is absolutely crucial to understanding the current epidemic of metabolic diseases we now face.

This first article provides an overview of the gastrointestinal system and the so-called “incretin hormones” and how the amount a food is cooked or ground impacts how quickly it is absorbed and the energy stored.


When talking about Food Processing, the issue arises as to how to properly define the concept of processing’.

How do we define ‘food processing’? Humans have been processing their food in one way or another for hundreds of thousands of years — be it cutting, cooking or grinding their food in some way.  These are all forms of food processing.

In terms of the effect of Food Processing on human physiology, a few main questions that this series of articles will address, arise;

(i) are all forms of food processing created equal?

(ii) does the food processing of different macronutrients and foods have different results?

(iii) could these changes in food processing over the last few hundred years or so have anything to do with the epidemic of metabolic diseases that we now face?

1. Overview of Gastrointestinal Physiology

Before getting into the topic of the effect of different types of food processing on the speed and place of absorption, it’s necessary to provide an overview of the gastrointestinal physiology and how the digestive system works and what hormones are released in response to different nutrients.

1. Overview of Gastrointestinal Physiology – Gabor Erdosi – Food News 2018

The important concept here is that we have ”sensor cells” (K-cells, L-cells) within our gastrointestinal tract and these cells release different hormones in response to different nutrients.

K-cells release an incretin hormone called GIP and the L-cells release an incretin hormone called GLP-1, as well as GLP-2, PYY and Oxyntomodulin (OXM).

What is important to note is that the distribution of these cells is not uniform.

The K-cells are more abundant in the upper part of the small intestine and other cells, the L-cells are more abundant in the lower part of the small intestine. This uneven distribution of these incretin-hormone-releasing sensor-cells has profound implications, as will be seen later.

Uneven distribution of the K-cells and L-cells in the small intestine – Gabor Erdosi – Food News 2018

2. Nutrient Sensing, the Incretin Effect and Hunger-Satiety Signalling in the Gut

Nutrient-Sensing

So, what happens when we eat foods that we have evolved to see for millennia? As the food goes through the small intestine, it triggers hormonal release from these incretin-hormone-releasing sensor-cells.

If you eat meat and berries, for example, which are foods we have evolved to see for hundreds of thousands of years, they have a fairly balanced stimulatory effect on these sensor cells. These incretin hormones will be released in a more or less balanced manner.

However, as will be shown later on, when we eat food products that we have not evolved to see — relatively new food products on an evolutionary scale, these patterns are completely disrupted.

There are several nutrient-sensing hormones in the small intestine, but the one to focus on with respect to the effect of food processing is SGLT1 –  which is a glucose sensor. Both the K-cells and the L-cells contain this nutrient-sensing receptor, and most others, as well.

Keep in mind for the next articles that the distribution of these cells is uneven; with more in the K-cells higher up in the small intestine and increasing numbers further down in the L-cells.

The Incretin Effect

When we eat glucose, such as in an oral glucose tolerance test or when someone gets intravenous glucose in a hospital, the difference in the insulin response is called the ”incretin effect”.

As you can see from the diagram below, the response to an oral or intravenous glucose load is very large and can be 50-70% of the insulin response.

The “Incretin Effect” to oral or intravenous glucose – Gabor Erdosi – Food News 2018

The majority of the insulin response is stimulated by these incretin hormones (GIP, GLP-1, etc.) secreted by the K-cells and L-cells and not directly via glucose.

The Physiological Effects of the Incretin Hormones

In addition to the insulin-stimulating effect, these incretin hormones have very different effects.

The K-cells, which are more abundant in the upper small intestine, secretes Glucose-dependent Insulinotropic Polypeptide (GIP) which acts on the pancreas — not only to result in insulin release, but also increase glucagon. At the level of the fat cells, the adipose tissue, it increases increases triglyceride storage, resulting in weight gain. In this way, GIP supports insulin’s effect on storing lipids. This is an anabolic-type of hormone and if it is very high, it can cause inflammation in adipose tissue.

The L-cells, which are more abundant in the lower small intestine, secrete Glucagon-like Peptide-1 (GLP-1) which also acts on the pancreas to increase insulin, but decreases glucagon. This GLP-1 at the level of the brain, acts to decrease appetite, increase satiety (feeling full) and decrease food intake.

  1. Hunger-Satiety Signalling in the Gut
Effects of Intestinal hormones on hunger-satiety signaling – Garbor Erdosi – Food Net 2018

It is important to note that there is only one hormone that can increase hunger and that is ghrelin which is synthesized in the stomach.

All the other hormones, including CCK, PP, PYY, GLP-1 and OXM (Oxyntomodulin) decrease hunger. That is, all of these hormones promote satiety; the feeling of being full’. It is very important to note that four of these hormones, CCK, PYY, GLP-1 and OXM are all synthesized in the small intestine L-cells.

The above is the all the basic physiology that is needed to understand the effects of food processing on the speed and location of nutrient absorption, the nature of hunger and satiety and how the current epidemic in metabolic diseases we now face is a result of disregulation of this system.

3 a. The Effect of Cooking Foods on Body Weight

One of the most ancient forms of food processing is cooking, and there are studies which indicate that there is an association between how many raw foods people eat and their body weight.  There is a generally tendency that the more raw foods a person eats, the lower their body weight. That does not mean that eating a vegetarian diet is more desirable, it is only to point out that with more and more processing — in this case, cooking, the higher body mass tends to be.

The Effect of Cooking Foods on Body Weight – Gabor Erdosi Food News 2018

3b. The Effect of Cooking Foods on Nutrient Availability

Carbohydrate-rich Foods

The relationship between cooking foods and body weight is particularly important with respect to carbohydrate-rich foods. For example, when grains are cooked they become much more digestible — meaning that more of the nutrients in the grain is available to be absorbed. In the case of potatoes, there is double or triple the amount of energy (calories) available to the body when they are cooked versus when they are raw. When a potato is cooked, the digestible starch increases 2-3 times, which means that these calories are now available to the body where they weren’t when they were raw.

The Effect of Cooking Carbohydrate on Nutrient Availability – Gabor Erdosi – Food News 2018
Lipid and Protein-rich Foods
The Effect of Cooking Lipid (fat) and Protein-rich Foods on Nutrient Availability – Gabor Erdosi Food News 2018

When foods that are high in lipids (fats) such as peanuts are cooked, the amount of energy the body is able to derive from the food, increases. As well, significantly more amino acids in protein-rich foods such as egg make it to the large intestine (where their nutrients are absorbed) when the protein-rich food is cooked.

3c. The Effect of Non-Thermal Food Processing on Nutrient Availability

Mechanical processing, such pounding food is also an ancient form of food processing which has an effect on how many nutrients are available to be digested. The nutrients available to the body when food is eaten raw and whole versus raw and pounded is significant, and this holds true whether the food is animal protein such as meat or a starchy vegetable such as sweet potato.

In a study with mice, one group of mice was fed meat either raw and whole or raw and pounded and then the group was crossed over to cooked and whole or cooked and pounded. The other group of mice was fed sweet potato eaten raw and whole or raw and pounded and then crossed over to cooked and whole or cooked and pounded.

When the meat or starchy vegetable (sweet potato) was eaten raw and whole, it was associated with lower body mass than the same foods eaten raw and pounded because the mice lost weight. As expected from what is known about the effect of cooking on nutrient availability (see above), when the mice ate the cooked meat or cooked sweet potatoes, they either didn’t lose as much weight (in the case of the meat) or actually gained weight (in the case of the sweet potato).

The conclusion of this study was worth noting;

”Our results indicate that human dieters who count calories and eat similar mixed diets but cook them to different extents would experience different weight gain outcomes at comparable levels of physical activity. This prediction is consistent with recent long-term data indicating that preparation-specific factors affect the relationship between caloric consumption and weight gain in humans.”

3 d. The Effect of Hydrolyzing Protein on Hormonal Response in the Small Intestine

Hydrolyzed protein, is essentially pre-digested protein and this process has an impact on which hormones are released in the small intestine when it is eaten.

In a 2010 study, comparing soy protein with soy protein hydrolysates and whey protein with whey protein hydrolysates, it was found that significantly more insulin compared to glucagon is released with the hydrolysates versus the intact protein. This means that the insulin to glucagon ratio is higher and insulin is the hormone which signals the body to store energy.  A higher insulin to glucagon ratio means that the body is storing energy rather than responding to glucagon which signals the body to use glucose and fat for energy.

4 a. The Effect of Mechanical Processing on the Blood Glucose Response of a Carbohydrate Food

Grinding / Juicing Fruit

Mechanical processing of a food doesn’t change the amount of carbohydrate that is in it. That is, when we compare 60g of whole apple with 60 g of pureed apple or 60g of juiced apple, there is the same amount of carbohydrate each. When we compare the Glycemic Index of these three, the results are very similar so this isn’t very helpful to tell us about the blood glucose response to actually eating these different foods.

When these foods are eaten, the blood glucose response 90 minutes later, is significantly  different.

Note: It’s not relevant to the outcome, but on this graph, slow and quick puree and juice as just differences in the amount of time it took for the liquid to be drunk.
The Effect of Mechanical Processing of Fruit on Blood Glucose Response – Gabor Erdosi – Food News 2018

As can be seen by the graph on the right, in healthy individuals blood insulin level goes very high with the juiced apple and in response, blood glucose then goes very low, below baseline.

The response that we see with the juiced apple is typical of what is seen with ultra-processed carbohydrates.

Grinding Grains

Grinding grains is another type of ancient food processing which changes the hormonal response in the small intestine.

The Effect of Mechanical Processing of Wheat on Blood Glucose Response – Gabor Erdosi – Food News 2018

When healthy individuals eat grain-based meals, the plasma insulin response increases the smaller the particle size of the grain.  That is, a specific amount of whole grain releases less insulin than the same amount of cracked grains, which is less than the same amount of course flour. The highest amount of insulin is released in response to eating the same amount of fine flour.

What was true for wheat in this study was true for rice as well and what was of interest, is there wasn’t a big difference between the insulin response with brown rice versus white rice.

The Effect of Mechanical Processing of Rice on Blood Glucose Response – Gabor Erdosi – Food News 2018

There is no difference in the Glycemic Index or Glycemic Load of whole wheat versus ground wheat or whole rice versus ground rice, but there is a huge difference in the insulin response with difference types of mechanical processing.

It’s also important to note that the amount of  fiber that was in the grain did not make a difference in the amount of insulin released, only the amount of mechanical processing of the grain. So, eating brown rice versus white rice won’t change the amount of insulin that is released – and insulin is a hormone that signals the body to store energy (calories).

In this next study, the same response that we saw with the pureed and juiced apples (above) is also seen with finely ground wheat bread. We see plasma glucose rise rapidly and then it drops below baseline at 120 minutes (circled).

Plasma glucose rises rapidly with bread made with wheat flour, then drops below baseline at 120 minutes

We know that the difference wasn’t due to the amount of fiber, because in this study they added back the fiber and it didn’t make a difference.

The difference had to do with the amount of disruption to the structure of the grain. So, eating whole wheat bread versus eating white bread — which is just adding the fiber that was taken out back won’t help much in terms of the insulin response.

The disruption of the structure of the grain had very adverse effects on the hormonal response; both the insulin response and GIP response, which can be seen in the next graph;

Disruption to structure of grain has adverse effect on insulin response and GIP response – Gabor Erdosi – Food News 2018

The bread made with flour resulted in a much larger insulin response and plasma GIP response than those made with whole kernel grains

Recall from the first article in this series, that GIP is released from the K-cells, which are dominant in the upper part of the small intestine. Bread made from ground flour results in a much greater and earlier hormonal response than bread made from whole grains.

The same researchers did another study a year later, this time with wheat bread, rye bread with the endosperm, traditional rye bread and high-fiber rye bread. As can be seen from these graphs (whether wheat or rye bread), it is the structural difference of the bread that explains the insulin response after a meal, not the total amount of fiber.

Note: Gabor Erdosi made a table comparing the Area Under the Curve (AUC) of the hormonal response of GIP (from the K-cells in the upper part of the small intestine) and GIP-1 (from the L-cells in the lower part of the small intestines) for the different breads which was very telling.

Area Under the Curve (AUC) of the hormonal response of GIP and GIP-1 for the different breads – Gabor Erdosi – Food News 2018

As can be seen from this table, there was almost double the GIP/GLP-1 ratio in the refined wheat bread (5.02) than the traditional rye bread (2.75) and this difference was largely due to significantly more GIP being released from the K-cells high up in the small intestine with the refined wheat bread than with the traditional rye bread.

It wasn’t due to fiber, because there was less GIP released with the traditional rye bread than even with the high fiber rye bread.

4 b. In-Vitro Hydrolysis of Starch Highly Correlates to Starch Digestion in the Small Intestine

This study shows a striking ability to predict how starch is hydrolyzed (broken down) in the small intestine with how it is broken down in a petri-dish in a lab using alpha-amylase. A perfect correlation would be = 1 and in this case it is 0.95.

Glycemic Response and Insulin Response to Starch Hydrolysis in-vitro and In-vivo – Gabor Erdosi – Food News 2018

As can be seen from these graphs, the glycemic response (blood sugar response) and the insulin response in the body can be accurately predicted using this method.

In this article we considered the effect of various kinds of food processing’ on the speed and location of food absorption of individual macronutrients (such as protein, fat and carbohydrate), but we rarely eat meals that are only carbohydrate, or only protein or only fat.

How does the presence of protein and fat-rich foods influence the hormonal response in the small intestine and how do these affect the hormonal response to carbohydrate? How does fiber content or addition of fiber affect the hormonal response, or does it? These will be the topic of the next article where we’ll look at the hormonal response of the body to mixed meals (meals with different combinations of fat, protein and carbohydrate.

Perhaps you wonder what all this information means for you.

Maybe, like many you’ve become metabolically unwell with Type 2 Diabetes or high blood pressure or high cholesterol despite eating a diet rich in whole wheat bread, whole grain rice and lots of cooked vegetables and are beginning to realize that how your food is processed is as important a factor as the nutrients it contains in it’s unprocessed form.

I can help.

Feel free to send me a note using the “Contact Me” form located on the tab above to find out information about the services I offer, both in-person in my office or via Distance Consultation (using telephone or Skype).

To your good health!

Joy

You can follow me at:

 https://twitter.com/lchfRD

  https://www.facebook.com/lchfRD/


Gabor’s full lecture can be watched here:

References

  1. Gribble, Fiona M., and Frank Reimann. ”Enteroendocrine Cells: Chemosensors in the Intestinal Epithelium.” Annual Review of Physiology 78, no. 1 (2016): 277—99.
  2. Reimann, Frank, and Fiona M Gribble. ”Mechanisms Underlying Glucose-Dependent Insulinotropic Polypeptide and Glucagon-like Peptide-1 Secretion.” Journal of Diabetes Investigation 7 (2016): 13—19.
  3. Nauck, Michael A., and Juris J. Meier. ”Incretin Hormones: Their Role in Health and Disease.” Diabetes, Obesity and Metabolism 20 (2018): 5—21.
  4. Perry, B., and Y. Wang. ”Appetite Regulation and Weight Control: The Role of Gut Hormones.” Nutrition & Diabetes 2, no. 1 (January 2012): e26.
  5. Groopman, Emily E., Rachel N. Carmody, and Richard W. Wrangham. ”Cooking Increases Net Energy Gain from a Lipid-Rich Food.” American Journal of Physical Anthropology 156, no. 1 (2015): 11—18.
  6. Evenepoel, Pieter, Dirk Claus, Benny Geypens, Martin Hiele, Karen Geboes, Paul Rutgeerts, and Yvo Ghoos. ”Amount and Fate of Egg Protein Escaping Assimilation in the Small Intestine of Humans.”
  7. American Journal of Physiology-Gastrointestinal and Liver Physiology 277, no. 5 (November 1999): G935—43.
  8. Carmody, R. N., G. S. Weintraub, and R. W. Wrangham. ”Energetic Consequences of Thermal and Nonthermal Food Processing.” Proceedings of the National Academy of Sciences 108, no. 48 (2011):
    19199—203.
  9. Morifuji, Masashi, Mihoko Ishizaka, Seigo Baba, Kumiko Fukuda, Hitoshi Matsumoto, Jinichiro Koga, Minoru Kanegae, and Mitsuru Higuchi. ”Comparison of Different Sources and Degrees of Hydrolysis of
    Dietary Protein: Effect on Plasma Amino Acids, Dipeptides, and Insulin Responses in Human Subjects.” Journal of Agricultural and Food Chemistry 58, no. 15 (August 11, 2010): 8788—97.
  10. Haber, G.B., K.W. Heaton, D. Murphy, and L.F. Burroughs. ”Depletion and Disruption of Dietary Fiber” The Lancet 310, no. 8040 (1977): 679—82.
  11. Heaton, K.W., S.N. Marcus, P.M. Emmett, and C.H. Bolton. ”Particle Size of Wheat, Maize, and Oat Test Meals: Effects on Plasma Glucose and Insulin Responses and on the Rate of Starch Digestion in Vitro” 47,no. 4 (1988): 675—82.
  12. O’Dea, K., Nestel, P.J., and Antonoff, L. ”Physical Factors Influencing Postprandial Glucose and Insulin Responses to Starch” 33, no. 4 (April 1, 1980): 760—65.
  13. Juntunen, Katri S., Leo K. Niskanen, Kirsi H. Liukkonen, Kaisa S. Poutanen, Jens J. Holst, and Hannu M. Mykkí¤nen. ”Postprandial Glucose, Insulin, and Incretin Responses to Grain Products in Healthy Subjects.”The American Journal of Clinical Nutrition 75, no. 2 (2002): 254—262.
  14. Juntunen, K.S., D.E. Laaksonen, Leo K Niskanen Karin Autio Jens J Holst, Kari E Savolainen, Kirsi-Helena Liukkonen, Kaisa S Poutanen, and Mykkí¤nen, H.M. ”Structural Differences between Rye and Wheat Breadsbut Not Total Fiber Content May Explain the Lower Postprandial Insulin Response to Rye Bread” 78, no. 5(2003): 957—64.
  15. Bornet, F R, A M Fontvieille, S Rizkalla, P Colonna, A Blayo, C Mercier, and G Slama. ”Insulin and Glycemic Responses in Healthy Humans to Native Starches Processed in Different Ways: Correlation with in Vitro Alpha-Amylase Hydrolysis.” The American Journal of Clinical Nutrition 50, no. 2 (1989): 315—23.

Copyright ©2018 The LCHF-Dietitian (a division of BetterByDesign Nutrition Ltd.)

LEGAL NOTICE: The contents of this blog, including text, images and cited statistics as well as all other material contained here (the ”content”) are for information purposes only.  The content is not intended to be a substitute for professional advice, medical diagnosis and/or treatment and is not suitable for self-administration without the knowledge of your physician and regular monitoring by your physician. Do not disregard medical advice and always consult your physician with any questions you may have regarding a medical condition or before implementing anything  you have read or heard in our content.


Evolving Theory of Obesity – a combination of refined carbs and industrial seed oils

Three years ago, my theory about the roots of the current obesity and Diabetes epidemic was simple. I believed that it was largely a matter of us eating too many carbs while having reduced the amount of healthy fat we ate. I now think it is a little more subtle than that, and that it is specifically the combination of a diet too high in refined carbs while high in industrial seed oils (such as soybean and canola oil) that underlies the issue.

When I first started reading and writing about the current obesity and Diabetes epidemic, my thoughts were summarized in two articles written in May and June of 2015. In the first article, I documented how in 1970-72 only 6% of men and 11.7% of women were considered obese (Body Mass Index > 30) in Canada, but by 2013 obesity in men had tripled to 20.1% in men and to  17.4% in women. In the second article, I explained how the changes in the obesity rates coincided with the changes in the Dietary Recommendations that began in 1977 and continued in 1982, 1992 and 2005 and which encouraged people to eat considerably more carbs and a lot less fat coincided with the increased obesity rates, and that the increasing rates of Type 2 Diabetes (9.4% in 2014 in Canada) was just a natural outworking of the higher obesity rates.

The problem was, I really didn’t know of any specific mechanisms that related one to the other.

Now I know of several.

This article summarizes my current theory of obesity, as it relates to previous articles and a brand new study published last week.

Correlation is not Causation

There’s an expression in science is that “correlation is not causation”.

That is, the fact that a dramatic increase in obesity rates correlates (or coincides) with the changes in the Dietary Recommendations doesn’t mean that the Dietary Recommendations ’caused’ the obesity epidemic or the Diabetes epidemic.

One can hypothesize that there is a relationship between these two things, but without some understanding of the mechanism and more data, we don’t know what this relationship might be.

From the reading I have been doing the last number of years, I have some ideas of some of what may be involved.

Evolution of the Theory

A presentation at a conference at the beginning of March (documented in  two previous articles) got me thinking that the picture was bigger than just “too many carbs” and a “decrease in the satiety effect of saturated fat” from full fat milk, cheese and butter. I was challenged by the fact that in the late 1960s and early 1970s, people in the US and Canada were generally slim, despite eating carbohydrates at just about every meal;

“They ate cereal or toast for breakfast and just about every household had a toaster. Lunch was often sandwiches, as there were no microwaves to heat food up in. Potatoes were a mainstay at dinner, sometimes pasta — yet the majority of young adults and adults were slim. Of course there were always some people that were overweight. Most elementary school classes had one chubby’ kid, but when one looks around the classes of today or on public transit or in stores and supermarkets, most people are considerably heavier than people in the 1950’s and 1960’s”

(from A New Hypothesis for Obesity Part 1)

The question was raised ‘what resulted in overweight and obesity all of a sudden exploding in the 1970’s and just keep rising?’

What changed?

We knew that (based on US data) people began eating ~240 calories a day more as carbohydrate but what was causing them to do this? Was it just because the Dietary Recommendations were encouraging us to eat more carbohydrate or was there something else going on?

Not More Fat but the Type of Fat

While people were eating more carbohydrate, neither people in Canada nor the US were eating more fat, but the type of fat we’ve been eating since the 1970s has changed substantially. This tweaked my interest.

We’d reduced our intake of saturated fat (because the “Diet-Heart Hypothesis” had told us they were the “cause of cardiovascular disease”) and we dutifully ate more and more of ‘polyunsaturated fats’ / vegetable oils  which as I wrote about previously are more appropriately called “industrial seed oils”.  These oils, including soybean, corn oil and canola oil contain high amounts of linoleic acid which is at the very top of the omega 6 (n-6) pathway and these fats which elongate to arachidonic acid are pro-inflammatory products in nature.

There is nothing inherently ‘bad’ about linoleic acid which is found naturally in nuts and seed oils, including walnut, macadamia and sesame oil, but it is the sheer amount of these industrial seed oils which suddenly became excessive in our diet, which I think may be a significant factor.  These fats are in our bread, pastries, salad dressing, margarine and even our peanut butter.  Canned fish is packed in it, our mayonnaise is made from it and everything we eat that is fried from a restaurant is bathed in these industrial seed oils. On top of that, many of us use it our own homes to cook with.

So many of the foods we now eat are prepared with soybean or canola oil and as a result, we consume a much greater amount of linoleic acid than our body ever evolved to handle.

As outline in previous articles, these oils are much more unstable than the saturated fats they were created to replace. What I mean by ‘unstable’ is that they are more easily oxidized – that is, when industrial seed oils are heated in the making of commercial foods using them or in cooking, they react with oxygen in the air to form toxic substances including  aldehydes  and lipid peroxides.  When these oils are heated, they produce oxidized metabolites which have been also been implicated in the development of a variety of conditions, including non-alcoholic fatty liver disease (NAFLD), cardiovascular disease and cancer and it has been proposed that inflammation is involved in the development of Type 2 Diabetes and metabolic syndrome, as well.

Also as written about previously, cardiolipin  is an important component of the inner membrane of the mitochondria (the so-called “powerhouse of the cell”) and the fats that make up cardiolepin change, depending on the types of fats in the diet. That is, the fatty acid composition of cardiolepin is altered by us eating a diet high in linoleic acid, such as soybean and canola oil. This past week a study about cardiolepin was published that added a very interesting piece to my evolving theory of the obesity and Type 2 Diabetes epidemic.

In this new study, researchers at the University of Copenhagen found that when large amounts of cardiolipin are produced in ‘brown fat’ cell mitochondria, there is much stronger calorie-burning. Conversely, when there are low amounts of cardiolepin in brown fat, there is much less calorie-burning. Low amounts of cardiolepin and less calorie-burning in brown fat was reported to be associated with obesity and Type 2 Diabetes [1].

Note: “Brown fat” is a specialized type of fat that burns fat, rather than stores it and cardiolepin acts like a kind of on-off switch for the activity in our brown fat.

This study got me thinking that since it is known that the fatty acid composition of cardiolepin changes according to the fatty acid composition of the diet (covered in previous blogs), what effect has the massive increase in linoleic acid intake in the diet in both Canada and the US had on the function of the cardiolipin?

Could it be that a shift in the types of fats that make up cardiolepin in brown fat stemming from a very high linoleic acid intake from industrial seed oils has had a similar effect as an absolute decrease in cardiolepin – and that this is somehow related to the increase in obesity and Type 2 Diabetes?

Type of Fats and Refined Carbohydrates

My theory of obesity has evolved and will likely continue to evolve. I don’t think that increased carbohydrate consumption based on changes in the Dietary Recommendations in the late 1970s / early 1980s in and by itself resulted in the obesity epidemic and huge increase in Type 2 Diabetes we see now.

I currently believe that the introduction of these manufactured industrial seed oils (soybean, canola, corn) that were created in the 1970s and meant to replace saturated fat in the diet (presumably to protect people from heart disease!) may be part of the initiation of the disease process.

As documented in earlier articles, we know that these fats are easily oxidized, have a direct impact on increasing inflammation and triggering the disease generation process in several health conditions and on acting on the endo-cannibinoid receptors in the body, in much the same way as cannabis (marijuana).  Could it be that these created oils that are very high in the average Western diet actually lead people to consuming more and more carbohydrate-based foods; foods that often comes liberally bathed in more industrial seed oils?

The mechanism of how the above might work was presented in an earlier article and had to do with how energy is generated in the electron transport chain of the mitochondria being different for saturated fats and unsaturated fats.

There are several possible mechanisms that may link consumption of these novel fats to obesity and development of Type 2 Diabetes (oxidation, inflammation, food cravings) and now based on this new study, the possibility of an increase in linoleic acid content in cardiolepin and it’s effect on fat burning.

It will take years more research before we have a fuller picture, so what do we do in the meantime?

Sensible Recommendations based on the Current Knowledge

For someone who is metabolically healthy (i.e. does not have Type 2 Diabetes or Insulin Resistance, hypertension or high cholesterol), it would seem that a whole-foods approach combined with avoiding omega – 6 industrial seed oils such as soybean, canola and corn oil combined with being mindful of the amount and type of carbohydrate in the diet may be sufficient to avoid developing these chronic diseases. Such a scenario would not be unlike the diet of the average American or Canadian in the 1950s and 60s. Not that that diet was that healthy, when compared with a classic Mediterranean diet, Japanese or Okinawan-style diet, or a whole food low-carbohydrate diet. These, it would seem offer a much healthier alternative.

For those who are already are insulin resistant or been diagnosed with Type 2 Diabetes, avoiding industrial seed oils would prudent and eating naturally-obtained vegetable fats such as olive oil or avocado oil instead. Since it does not seem that studies clearly support that saturated fat causes heart disease and not simply increase in surrogate markers of heart disease such as higher LDL (which LDL subfraction?), it would seem that using modest quantities of real butter is preferable to eating margarine made from industrial seed oils. It would also seem that at least initially, eating a diet where the amount and type of carbohydrate is kept to a quantity that does not trigger large amounts of insulin release or spike blood glucose makes good sense. As I wrote about recently, with the availability of Continuous Glucose Monitoring (CGM), this approach can be tailored to each individual person’s response to specific foods. We are no longer reliant on Glycemic Index or Glycemic Load, which are derived from healthy people’s response to foods, not those with Type 2 Diabetes. A suitable diet could be expressed as a variety of different lifestyles (just as for the healthy individual) including a Mediterranean diet, Okinawan-style diet, or whole food low-carbohydrate diet – with carbohydrate levels tailored on an individual basis, based on glycemic response and insulin levels.

Whether a person is healthy or metabolically unwell, based on the studies I have read and some of the mechanisms that have come to light, I can see no benefit in people eating either industrial seed oils or refined, processed carbohydrates. There is every reason to believe that both of these may have been part of the underlying cause of the current obesity and Type 2 Diabetes epidemic.

Unrefined Carbohydrates and Healthy Fats

If someone is metabolically healthy, I recommend eating minimally processed carbohydrates as they reduce the ‘incretin effect’ of hormones such as GIP, GLP-1 and GLP-2 that are released in the intestine and trigger the release of insulin from the pancreas beta-cells. Eating minimally processed carbs would result in less triggering of the release of insulin, thus reducing the likelihood of developing either insulin resistance or Type 2 Diabetes.

If someone is already insulin resistant or has Type 2 Diabetes, it seems from recent studies that minimizing carbohydrate initially, along with weight loss and some forms of activity may be at least as good if not more beneficial than a low-fat calorie-restricted diet. Certainly, many people find they are a lot less hungry eating a low carbohydrate whole foods diet and are easily able to stick with it long term (a year or two in studies), allowing for a period of improving insulin sensitivity and lower overall blood sugar levels. It certainly has been demonstrated to be safe and effective in periods up to two years.

For both those that are metabolically healthy or insulin resistant or have Type 2 Diabetes, avoiding industrial seed oils makes good sense, for all the reasons outlined above.

What about your specific situation?

Do you have questions about the type and amount of carbohydrates that are most suitable for you based on your health and family history? What about which fats are are the best choices given your lifestyle?

I can help.

Please feel free to send me a note using the “Contact Me” form located on the tab above to find out how I can support your needs and I will reply as soon as possible. Remember, I provide both in-person services and am experienced providing services via Distance Consultation (telephone or Skype).

To your good health!

Joy

You can follow me at:

 https://twitter.com/lchfRD

  https://www.facebook.com/lchfRD/

Reference

Sustarsic EG, Ma T, Lynes MD et al, Cardiolipin Synthesis in Brown and Beige Fat Mitochondria Is Essential for Systemic Energy Homeostasis,
Cell Metabolism (2018), https://doi.org/10.1016/j.cmet.2018.05.003

Copyright ©2018 The LCHF-Dietitian (a division of BetterByDesign Nutrition Ltd.)

LEGAL NOTICE: The contents of this blog, including text, images and cited statistics as well as all other material contained here (the ”content”) are for information purposes only.  The content is not intended to be a substitute for professional advice, medical diagnosis and/or treatment and is not suitable for self-administration without the knowledge of your physician and regular monitoring by your physician. Do not disregard medical advice and always consult your physician with any questions you may have regarding a medical condition or before implementing anything  you have read or heard in our content.


How Much Does Your Type 2 Diabetes Cost per Year?

The most recent data available from 2011 indicates that the cost per person per year of having Type 2 Diabetes in Canada ranges from $1611 (Quebec) to $3427 (New Brunswick) based on an average income of $43,000 per year. Necessary medications, devices and supplies are expensive – costing more than 3% of income. While those with extended health benefits may not consider this cost now, a change in employment circumstances can affect this overnight.

As Type 2 Diabetes progresses, more medications are often added and the number of times blood sugar needs to be taken each day often increases, as well.  Job loss or retirement suddenly results in Canadians being faced with bearing the burden of their disease, along with the chronic, progressive nature of poorly managed blood sugars.

A per-province breakdown using the 2011 figures from the Canadian Diabetes Association appears below;

Cost of Type 2 Diabetes per person per year by province (2011 figures) – from Canadian Diabetes Association

It doesn’t have to be so.

Long term studies that have been published in the last couple of years (reviewed in previous articles on this site) which demonstrate that a well-designed low carbohydrate or ketogenic diet can and does enable a significant improvement in Type 2 Diabetes symptoms.

After as little as 10 weeks, glycosylated Hemoglobin (HbA1C) has been reported to drop a full percentage point; from 7.6% to 6.6%. After a year, the average HbA1C was 6.3%, which is below the diagnostic criteria for Type 2 Diabetes.  That is, in just a year of following a well-designed low carbohydrate diet, it has been demonstrated that people can get their average blood glucose in the non-Diabetic range.

Medication use drops substantially when people are able to control their blood sugar by limiting the amount and types of carbohydrates they eat.  At the start of the study mentioned above published in Feb of 2018, 87% of people were taking at least one medication for Diabetes and at just 10 weeks, almost 57% had one or more Diabetes medications reduced or eliminated. After one year, Type 2 Diabetes medication prescriptions other than Metformin declined from 57% to below 30%. Insulin injections were reduced or eliminated in 94% of users and sulfonylurea medication was entirely eliminated.

For each one of these individuals, a simple change to a low carbohydrate diet resulted not only in significantly improved health and a reduction in Diabetes symptoms, but in significantly reduced cost, as well.

According to Virta Health who conducted the study referred to above, cost savings are as indicated in this diagram below.

The cost of “Diabetes Reversal” below reflects the estimated cost of an individual being cared for by the Virta Health multi-disciplinary team program, which appears to be an excellent program given the methods used in the studies they have published. It should be noted that the cost of working one-on-one with me over the course of a year (and as overseen by your GP) is substantially less. In fact, getting started by being assessed and having me design an individual Meal Plan just for you is significantly less than the yearly cost of achieving better blood sugar control in the graphic below.

Sometimes people are hesitant to invest in the cost of seeing a Registered Dietitian who can help them adopt a low carbohydrate lifestyle that can enable them to achieve significantly improved blood sugar control – even though the yearly costs of Diabetes supplies is far greater than the cost of being assessed and getting a Individualized Meal Plan. Such an estimate is at the level of health they are today, but waiting a few years, with longer Type 2 Diabetes, more medications, possibly including insulin injections, and the cost is closer to $3500 in 2011 Canadian dollars / $4000 in 2018 (US) dollars.

Does this make any sense?

The sooner someone changes their diet and lifestyle upon being diagnosed with Type 2 Diabetes, the more likely it seems they may be able to achieve full remission of symptoms. If you’ve followed my own story on “A Dietitian’s Journey” then you know how much harder it is for me, after being diagnosed 10 years ago.

If you have extended benefit coverage, then now is the time to invest some time in learning how to make lifestyle changes that will benefit your health and your finances for the years to come.  Even for those without such coverage, the cost of an assessment package which will provide you with a  Meal Plan designed specifically for you is substantially less than you are already paying for your medications, devices and supplies. I provide both in-person services in my Coquitlam, British Columbia office and via Skype Distance Consultations.

If you have questions about this package entails or about the flexible payment options that are available, why not send me a note using the “Contact Me” form located above? I’ll be happy to reply.

To your good health,

Joy

You can follow me at:

 https://twitter.com/lchfRD

  https://www.facebook.com/lchfRD/

References

Canadian Diabetes Association, The Burden of Out of Pocket Costs for Canadians with Diabetes, 2011, http://www.diabetes.ca/CDA/media/documents/publications-and-newsletters/advocacy-reports/burden-of-out-of-pocket-costs-for-canadians-with-diabetes.pdf


Copyright ©2018 The LCHF-Dietitian (a division of BetterByDesign Nutrition Ltd.)

LEGAL NOTICE: The contents of this blog, including text, images and cited statistics as well as all other material contained here (the ”content”) are for information purposes only.  The content is not intended to be a substitute for professional advice, medical diagnosis and/or treatment and is not suitable for self-administration without the knowledge of your physician and regular monitoring by your physician. Do not disregard medical advice and always consult your physician with any questions you may have regarding a medical condition or before implementing anything  you have read or heard in our content.

CVD Risk Improves By Use of Ketogenic Diet in Type 2 Diabetes at 1 year

One of the concerns raised by opponents of a very low carb or ketogenic diet is that it increases risk of cardiovascular disease such as heart attack and stroke, but does it?

Results of a peer-reviewed study of cardiovascular outcomes of people with Type 2 Diabetes (T2D) that was published at the beginning of May in the Journal of Cardiovascular Diabetology[1] found that those that followed a ketogenic diet significantly improved in 22 of 26 cardiovascular disease risk factors, including biomarkers of cholesterol / lipoproteins, blood pressure, inflammation, and carotid intima media thickness (cIMT).

Previous published results from the same researchers and published in February of 2018 demonstrated that reversal of T2D symptoms was able to be achieved and sustained long term using a ketogenic diet[2,3].

Simply by decreasing the amount of carbohydrate in the diet over the course of a year there was not only a significant decrease in blood sugar and weight, but a dramatic improvement in lipid and lipoprotein markers associated with markers of cardiovascular risk.

The results of this most recent study do much to dispel the myth that a therapeutic ketogenic diet puts individuals at increased risk for heart attack and stroke. In fact, it reduces their risk.

Methods

Continuous Care Intervention (CCI) Group Participants

At the beginning of the study, there were 238 participants enrolled in the continuous care intervention (CCI) group and all had a diagnosis of Type 2 Diabetes (T2D) with an average HbA1c of  7.6%  ±1.5%.  They ranged in age from 46 — 62 years of age, 67% were women and 33% were men. Weight of the subjects ranged from 200 pounds to 314 pounds (117±26 kg) with an average weight of 257 pounds (117 kg) and Average Body Mass Index (BMI) was 41 kg·m-2 (class III obesity) ±9 kg·m-2, with 82% categorized as obese.  The majority of participants (87%) were taking at least 1 medication for glycemic control medication.

At the end of a year, 218 participants (83%) remained enrolled in the  continuous care intervention (CCI) group.

Intervention and Monitoring of CCI Group

Each participant in the CCI group received an Individualized Meal Plan which enabled them to attain and maintain nutritional ketosis. They also received behavioral and social support, biomarker tracking tools, and ongoing care from a health coach with medication management by a physician.

Subjects typically required <30 g·day−1 total dietary carbohydrates.

Daily protein intake was targeted to a level of 1.5 g·kg−1 based on ideal body weight and participants were coached to incorporate dietary fats until they were no longer hungry.

Other aspects of the diet were individually tailored to ensure safety, effectiveness and satisfaction, including consumption of 3-5 servings of non-starchy vegetables and sufficient mineral and fluid intake.

Participants ability to achieve and maintain nutritional ketosis was determined by subjects monitoring their blood ketone level of β-hydroxybutyrate (BHB) using a portable, handheld device. Blood glucose and β-hydroxybutyrate (BHB) levels were initially tracked daily using a combination blood glucose and ketone meter and frequency of tracking was modified by the care team based based on each individual’s needs and preferences.

Participants with high blood pressure (hypertension) were provided with an automatic home blood pressure machine (sphygmomanometer) and they were instructed to record their readings daily to weekly in the supplied app, depending on recent blood pressure control. Antihypertensive medication prescriptions were adjusted based on home blood pressure readings and reported symptoms.

Downward Adjustment and/or Discontinuation of Medications

As blood pressure came down, diuretic medication was the first antihypertensive medication to be discontinued. This was followed by beta blockers (unless the participant had a history of coronary artery disease).

Angiotensin-converting-enzyme inhibitors (ACE inhibitors) and angiotensin II receptor blockers (ARBs) were generally continued due to their known protective effect on the kidneys in those with Type 2 Diabetes.

Statin medications were adjusted to maintain a goal of LDL-P under 1000 nmol L−1 (or based on participant preference after full risk/benefit discussion with the physician).

The Usual Care (UC) Group

For comparison purposes, an independent group of patients with Type 2 Diabetes were also recruited for the study and were referred to Registered Dietitians that provided dietary advice according to the American Diabetes Association Guidelines [4].

Laboratory Assessors

Since an abnormal lipid / cholesterol profile (“atherogenic dyslipidemia”) is a known risk factor for CVD [5] and is very common in people with Type 2 Diabetes, a number of laboratory tests were conducted at the beginning of the study and the end to determine if they improved, stayed the same or got worse.

Most common in people with Type 2 Diabetes is where there are increased triglycerides (TG), decreased high-density lipoprotein cholesterol concentration (HDL-C) and increased small low-density lipoprotein particle number (small LDL-P).

The authors of this study state that evidence suggests that increased very low-density lipoprotein particle number (VLDL-P) and a large VLDL-P in particular may be one of the key underlying abnormalities in this abnormal lipid / cholesterol profile (“atherogenic dyslipidemia”) associated with T2D.

The authors also outline how higher concentrations of small LDL are often associated with increased total LDL particle number (LDL-P) and increased ApoB which is the main protein constituent of  very low-density lipoprotein (VLDL) and low-density lipoprotein (LDL). The authors provide previous study evidence that demonstrates that in people with insulin resistance and T2D, increased total LDL particle number (LDL-P) and increased ApoB may exist even with normal to low LDL-C concentrations values. For this reason, LDL-C alone was not relied on as a measure of abnormal lipid / cholesterol profile (“atherogenic dyslipidemia”) in this study as it could miss the impact of increased total LDL particle number (LDL-P) and/or ApoB.

The authors mentioned that in previous studies with carbohydrate restriction of up to 1 year, while triglycerides (TG) usually decrease and HDL-C often increase, LDL-C sometimes increased and other times decreases. The authors note that although higher LDL-C is a known risk factor for CVD, low LDL-C may also reflect higher small, dense LDL, total LDL particle number (LDL-P) or ApoB and thus be a risk factor, as well.

Since inflammation is involved at all stages of the atherosclerotic process, higher high-sensitivity C-reactive protein (CRP) and/or higher white blood cell count (WBC) were assessed as risk factors for CVD.

Finally, since high blood pressure (hypertension) is also an added risk factor for CVD in people with T2D, tighter blood pressure control was deemed to reduce the risk of DVD, stroke and other microvascular events.

Continuous Care Intervention (CCI) Group

Standard laboratory fasting blood draws of the CCI group were obtained at the start of the study (baseline), at 70 days (3 months) and at ~ 1 year follow-up.

Lipid/cholesterol-related tests included ApoB, ApoA1, total cholesterol, triglycerides, direct HDL-C concentrations and LDL was calculated using the Friedewald equation.

The LipoProfile3 algorithm was used to determine relationship of lipid subfractions to cardiovascular (CVD) risk – specifically the number of HDL particles (HDL-P) previously reported  to be associated with death, Myocardial Infarction (MI), stroke and hospitalization, HDL-C (HDL cholesterol) which is the amount of cholesterol those particles are carying, which is not associated with these negative outcomes and HDL-P subclasses [6].

Risk was also determined using the lipoprotein insulin resistance score (LP-IR) which was proposed to be associated with the homeostasis model assessment of insulin resistance (HOMA-IR) and glucose disposal rate (GDR) [7].

Finally, risk was also determined using the 10-year atherosclerotic  cardiovascular disease (ACSVD) risk score of the American College of Cardiology [8].

Carotid ultrasonography (cIMT) measure was performed at baseline and 1 year to characterize atherosclerotic risk.

The Usual Care (UC) Group

Body measurements, vital signs and fasting blood draws for the Usual Care (UC) group were obtained at the start of the study (baseline) and at 1 year using the same clinical facilities and laboratory and data collection methods. Carotid ultrasonography (cIMT) measure was also performed at baseline and 1 year to characterize atherosclerotic risk.

Results

There were no significant difference in the baseline characteristics of the two sub groups of CCI participants (web-based on onsite-based) and no significant difference at 1 year, so for the purpose of analysis, data from both groups were combined.

As well, there were no significant difference in the baseline characteristics of the Usual Care (UC) group (which served as an observational comparison group) and the Continuous Care Intervention Group (CCI) except mean body weight and BMI were higher in the CCI versus the UC group.

The within-Continuous Care Intervention group changes in the following lipids and lipoproteins were all statistically significant and were as follows; ApoA1  [a component of high-density lipoprotein (HDL)] increase by +”‰9.8%) ApoB / ApoA1 ratio decreased by −”‰9.5% Triglycerides (TG) decreased by −”‰24.4% LDL-C increased by +”‰9.9% but LDL-particle size also increased by +”‰1.1% (that is, large fluffy LDL increased compared with small, dense LDL) HDL-C increased by +”‰18.1% total HDL-P increased by +”‰4.9% large HDL-P increased by 23.5% Triglyceride/ HDL-C ratio decreased by −”‰29.1% large VLDL-P decreased by −”‰38.9% small LDL-P decreased by −”‰20.8% There were no significant changes in total LDL-P or ApoB.

These results are impressive!

Simply by decreasing the amount of carbohydrate in the diet over the course of a year there was a dramatic improvement in lipid and lipoprotein markers associated with markers of cardiovascular risk.

In addition, the Continuous Care Intervention group had a significant reduction in;

systolic blood pressure decreased −"‰4.8%

diastolic blood pressure decreased −"‰4.3%

C-Reactive Protein (CRP) decreased almost 40% (i.e. −"‰39.3%) 

white blood cell (WBC) count decreased −"‰9.1%

Below are graphs of the changes in biomarkers for the Continuous Care Intervention (CCI) group (figure 1) and the Usual Care (UC) Group;

FIGURE 1: changes in biomarkers for the Continuous Care Intervention (CCI) group


FIGURE 2: changes in biomarkers for the Usual Care (UC) group

Below is a comparative graph of the two groups, the Continuous Care Intervention (CCI) Group and the Usual Care (UG) Group

FIGURE 3: changes in biomarkers for the Continuous Care Intervention (CCI) group compared to the Usual Care (UC) group

Some Final Thoughts…

This study demonstrates that a therapeutic ketogenic diet followed over the course of 1 year significantly improved 22 of 26 cardiovascular disease risk markers in those with Type 2 Diabetes. This is huge!

The size of the study group was large and had an 83% retention rate over the course of the year – which in and by itself demonstrates that the intervention diet was one that people had no difficulty staying with in their day-to-day lives, without the use of meal replacements (shakes or bars).

While not a randomized control trial between CCI and UG groups, this study supports that a ketogenic diet is both safe and effective for periods of up to a year (and in other studies has been documented to be safe and effective for up to two-years). Not only can a well-designed ketogenic diet reverse many of the symptoms of Diabetes (documented in this earlier article) it can also significantly improve risk markers for cardiovascular disease.

Do you have questions about how a carefully-designed low carbohydrate or ketogenic diet can help you improve symptoms of Type 2 Diabetes and lower markers of risk factors for cardiovascular disease?

Please send me a note using the ”Contact Me” form above to find out more about how I can provide you with in-person or Distance Consultation services (via Skype or long distance telephone).

To our good health,

Joy

You can follow me at:

 https://twitter.com/lchfRD

  https://www.facebook.com/lchfRD/

References

  1. Bhanpuri NH, Hallberg SJ, Williams PT et al, Cardiovascular disease risk factor responses to a type 2 diabetes care model including nutritional ketosis induced by sustained carbohydrate restriction at 1 year: an open label, non-randomized, controlled study, Cardiovascular Diabetology, 2018, 17(56)
  2. McKenzie AL, Hallberg SJ, Creighton BC, Volk BM, Link TM, Abner MK, Glon RM, McCarter JP, Volek JS, Phinney SD, A Novel Intervention Including Individualized Nutritional Recommendations Reduces Hemoglobin A1c Level, Medication Use, and Weight in Type 2 Diabetes, JMIR Diabetes 2017;2(1):e5, URL: http://diabetes.jmir.org/2017/1/e5, DOI: 10.2196/diabetes.6981
  3. Hallberg SJ, McKenzie AL, Williams, PT et al. Diabetes Ther (2018). Effectiveness and Safety of a Novel Care Model for the Management of Type 2 Diabetes at 1 Year: An Open-Label, Non-Randomized, Controlled Study.
  4. America Diabetes Association, Lifestyle management. Diabetes Care. 2017;40 (Suppl 1):S33—S43
  5. Fruchart J-C, Sacks F, Hermans MP, Assmann G, Brown WV, Ceska R, et al. The Residual Risk Reduction Initiative: a call to action to reduce residual vascular risk in patients with dyslipidemia. Am J Cardiol. 2008;102:1K—34K.
  6. May HT,  Anderson JL, Winegar DA, Utility of high density lipoprotein particle concentration in predicting future major adverse cardiovascular events among patients undergoing angiography, Clinical Biochemistry, 2016;49(15): 1122-1126
  7. Shalaurova I, Connelly MA, Garvey WT, Otvos JD. Lipoprotein insulin resistance index: a lipoprotein particle-derived measure of insulin resistance. Metabol Syndr Relat Disord. 2014;12:422—9.
  8. Goff DC, Lloyd-Jones DM, Bennett G, Coady S, D’Agostino RB, Gibbons R, et al. ACC/AHA guideline on the assessment of cardiovascular risk: a report of the American College of Cardiology/American Heart Association Task Force on Practice Guidelines. Circulation. 2013;2014:S49—73 (tool: http://tools.acc.org/ASCVD-Risk-Estimator-Plus/#!/calculate/estimate/)

Copyright ©2018 The LCHF-Dietitian (a division of BetterByDesign Nutrition Ltd.)

LEGAL NOTICE: The contents of this blog, including text, images and cited statistics as well as all other material contained here (the ”content”) are for information purposes only.  The content is not intended to be a substitute for professional advice, medical diagnosis and/or treatment and is not suitable for self-administration without the knowledge of your physician and regular monitoring by your physician. Do not disregard medical advice and always consult your physician with any questions you may have regarding a medical condition or before implementing anything  you have read or heard in our content.

Two More Good Indicators of Cardiovascular Risk

In a recent article about why Waist Circumference and Waist-to-Height Ratio is so important, I explained that a meta-analysis from 2012 which pooled data from 300,000 adults of different races and ages found that the lowest risk of cardiovascular disease and shorter lifespan was associated with a Waist to Height Ratio (WHtR) of 0.5. That is, we are at lowest risk when our waist circumference is less than half our height (even if our BMI is in the normal range). I also explained exactly how to take waist circumference, so that the results are accurate.

There are other measures of cardiovascular risk that I think are worth considering.

  1. A 2015 study of 3200 adults found that Waist-to-Hip Ratio (WHR) is more accurate in predicting 10-year cardiovascular risk than Waist to Height Ratio (WHtR), however whether this relationship would hold up in a sample as large as the meta-analysis above is unknown. I feel it is worth mentioning Waist-to-Hip Ratio (WHR) as an indicator of cardiovascular risk, as it is easy to do.
  2. Another index this 2015 study found to accurately predict 10-year  cardiovascular risk was something called Conicity Index which I will touch on even though it is not as easily determined as Waist-to-Hip Ratio (WHR) or Waist to Height Ratio (WHtR).

Determining Waist to Hip Ratio

As mentioned in the previous article, to use these indices requires waist measurements and hip measurements to be done accurately and at a specific place on the body.  To make it easier, I will repeat how to measure waist circumference here and below, how to measure hip circumference.

Measuring Waist Circumference

For the purposes of calculating risk associated with increase abdominal girth, waist circumference needs to be measured at the location that is at the midpoint (i.e. half way) between the lowest rib and the top of the hip bone (called the ”iliac crest”). Below is a picture that should help.

Where to measure waist circumference

This measurement should be taken with a flexible seamstress-type tape measure, being sure that the tape measure is at the same height in the front and the back, when looking in front of a mirror. That is, the tape measure should be perpendicular to the floor (not higher in the back or the front).

It’s also important that the person’s abdomen (belly) is completely relaxed when taking the measurement, not sucked in.  One way to do that is to taking a deep breath and let it out fully just as the measurement is taken.

If your Waist to Height ratio is greater than 0.5, then you are at increased risk for cardiovascular events and a shortened lifespan. Looking at the graph above, one can see that for every little bit over 0.5, the risk rises steeply.

Measuring Hip Circumference

Hip circumference needs to be measured at the widest portion of the buttocks (butt) and as with waist circumference, the tape measure needs to be parallel to the flood (same height in the front and the back, when looking in front of a mirror).

For both the waist and hip measurement, the tape measure should be snug around the body, but not pulled so tight that it is constricting and it is best if a stretch”resistant but flexible seamstress-type tape measure is used.

Assessing Waist-to-Hip Ratio

If the waist circumference is measured in inches, then the hip circumference needs to be as well – same if the measurement is in centimeters; both need to be in the same units.

To calculate the Waist-to-Hip Ratio take the waist circumference and divide it by the hip circumference.

Waist-to-Hip Ratio and Risk of Cardiovascular Disease

The following ratios are associated with low, moderate and high risk of cardiovascular risk;

Low Risk: For men, if the ratio is 0.95 or less, for women if the ratio is 0.80 or less

Moderate Risk: For men, if the ratio is 0.96 – 1.0, for women if the ratio is 0.81 – 0.85

High Risk: For men, if the ratio is 1.0 or more, for women if the ratio is 0.85 or more.


The Waist-to-Hip Ratio can also be thought of as people being shaped like “apples” or “pears”.

People who carry most of their excess weight around their middle (“apples”) have more visceral fat and this type of fat is much more dangerous than the fat under our skin (called “sub-cutaneous fat”) because it is found around the heart, liver, pancreas and other organs and increases the risk not only of cardiovascular disease, but also Type 2 Diabetes and hypertension.

People who’s hips are much wider than their waist (so-called “pears”) have less visceral fat and therefore lower risk of these weight-related health problems.

Conicity Index

Conicity Index(CI) is a little more cumbersome a calculation than either Waist-to-Hip (WHR) Ratio or Waist-to-Height (WHtR), but was found in the 2015 study mentioned above with 3200 subjects to be a strong predictor of cardiovascular risk.

Conicity literally means “cone-shaped” and determines how much our  body fat distribution like two end-to-end cones.

In the first figure below, body weight is distributed evenly, however when someone has a conical distribution, their weight is more heavily distributed around the abdomen. As a result, it has increased conicity and is more highly correlated to increased cardiovascular disease (as well as Type 2 Diabetes and hypertension).

For those who are interested in calculating Conicity Index (CI), the formula is below along with the formula for Waist-to-Hip (WHR) Ratio, Waist-to-Height (WHtR).

Indices of central adiposity [1]

Final Thoughts…

Given the sample size of the data on which Waist-to-Height (WHtR) is based (300,000 adults) and that it is an easy to determine and robust measure of cardiovascular risk, this is the one I tend to favour.  That said, Waist-to-Hip (WHR) Ratio was previously used for years and found to be a simple and accurate predictor of risk. From that point of view, either could be used, but why not both?

In my clinical experience, I have encountered many people with much wider hips than waist (so-called “pears”) but whose Waist-to-Height (WHtR) is considerably greater than 0.5, and for this reason I tend to put more credence on Waist-to-Height (WHtR) than Waist-to-Hip (WHR) Ratio as a measure of visceral fat and increased cardiovascular risk.

Since both Waist-to-Height (WHtR) and Waist-to-Hip (WHR) Ratio are very easy to determine, for those with a family risk of cardiovascular disease, Type 2 Diabetes or hypertension, I think it makes sense to aim for a waist measurement that is within both of these easily obtained measures.

Do you have questions about how I can help you lower your risk of cardiovascular disease, Type 2 Diabetes or hypertension? I provide both in-person and Distance Consultation services via Skype or telephone (and remember, many extended benefits plans will reimburse for visits with a Registered Dietitian).

Please feel free to send me a note using the “Contact Me” form on the tab above to find out more.

To our good health,

Joy

You can follow me at:

 https://twitter.com/lchfRD

  https://www.facebook.com/lchfRD/

References

  1. Rabiee B,  Motamed N, & Perumal D, et al. Conicity index and waist-hip ratio are superior obesity indices in predicting 10-year cardiovascular risk among men and women. Clin. Cardiol. 38, 9, 527—534 (2015)

Copyright ©2018  The LCHF-Dietitian (a division of BetterByDesign Nutrition Ltd.) 

LEGAL NOTICE: The contents of this blog, including text, images and cited statistics as well as all other material contained here (the ”content”) are for information purposes only.  The content is not intended to be a substitute for professional advice, medical diagnosis and/or treatment and is not suitable for self-administration without the knowledge of your physician and regular monitoring by your physician. Do not disregard medical advice and always consult your physician with any questions you may have regarding a medical condition or before implementing anything  you have read or heard in our content.

Importance of Waist Circumference & Waist to Height Ratio

Most of us know that obesity is where a person has high levels of body fat, but at what point does overweight become obese? There are different ways of determining this and one way that many people are familiar with is the Body Mass Index.

Body Mass Index (BMI) classifies whether a person is overweight or obese by looking at their weight to height ratio. It is calculated by taking a person’s weight (in kilograms) and dividing it by their height (in meters squared).

BMI= weight (kg) / height (m) x height (m).

People are considered overweight if their BMI is between 25 and 29.9 and obese if it is above 30.

There are different levels of obesity, too. For Caucasians*:

Class I obesity is a BMI between 30 and 34.9.

Class II obesity is a BMI between 35 and 39.9.

Class III obesity (also called morbid obesity) is a BMI is greater than 40.

*There is a different scale for those of Asian and South Asian ancestry, which is approximately 5% lower.

Research has found that waist-to-height ratio is a much better predictor than Body Mass Index (BMI) of cardiovascular health risk such as heart attack and stroke, as well as a shorter lifespan due to other illnesses. 

A meta-analysis from 2012 pooled data from multiple studies, and examined Waist to Height Ratio (WHTR) in more than 300, 000 adults from several different ethnic groups and found that was a far better predictor of cardiovasular of metabolic risk factors in both men and women, than BMI [1].

A 2014 study found a correlation between Year of Life Lost (YLL) for different values of Waist to Height Ratio (WHtR) and found that YLL increased dramatically in both males and females when above 0.52 – a waist circumference of just over half one’s height [2].

Waist-to-Height Ratio Is More Predictive of Years of Life Lost than Body Mass Index [2]
These two studies found that the least amount of years of life lost is associated with a Waist to Height Ratio of 0.5. That is, our waist circumference should be less than half our height, even if our BMI is in the “normal range”*.

*Both males and female non-smokers have a slightly increased Years of Life Lost at waist circumference > 0.50, even when their BMI was in the normal range (18.5 to to 22) – which means that waist circumference is a more important predictor of shortened lifespan due to cardiovascular disease, than BMI.

Determining Waist to Height Ratio

If you’re a male and 5’10” tall (70″ tall), then to be in the lower risk category, your waist circumference should be 35 inches or less.

If you’re a female and 5’6″ tall (66″ tall), then your waist circumference should be 33 inches or less.

But where should we measure waist circumference?

Is it where we wear our pants? Is it at the smallest part of our belly, where it dips in? Is it where our navel (belly button) is? Each one of these will produce very different results.

Measuring Waist Circumference

For the purposes of calculating risk associated with carrying excess weight around the middle, waist circumference and hip circumference need to be taken at very specific locations, as described below.

Using a flexible seamstress tape measure, stand in front of a mirror so that you can see both the front and back of where you are placing the tape measure.

It is also important that your belly is completely relaxed when taking the measurement, not sucked in.  One way to do that is to taking a deep breath and let it out fully just as the measurement is taken.

Where to measure waist circumference

Take your waist circumference at the midpoint (i.e. half way) between your lowest rib and the top of your hip bone (called the ”iliac crest”) — being sure that the tape measure is perpendicular to the floor (i.e. not higher in the back or the front).

Looking at the graph above, one can see that for every little bit over 0.5, the risk rises steeply.

Where to Measure Hip Circumference?

Hip circumference is also needed for other assessors, including the waist to hip ratio. Measuring hips should be done at the widest part, making sure the tape measure is the same height in the front and the back.

How Much Should I Weigh?

People often ask me “how much should I weigh” – wanting me to provide them with a specific weight in pounds, or kilos. My usual answer is that when your waist circumference is half your height and your lab test results are optimal, everything else is aesthetics (what you look like). While I can provide a ball-park figure based on height and weight, how much people should weigh is better determined by them having the lowest risk of heart attack or stroke (cardiovascular disease) and the lowest amount of Years of Life Lost.

Health is not a number on the scale.  Its the measurement of the amount of fat in our abdomen, around our liver, kidneys, pancreas and heart.

If your waist circumference is greater than 0.5 you are at risk. If you have been diagnosed with type 2 diabetes or pre-diabetes, high blood pressure or high cholesterol, then this risk is compounded.  Add to that a family history of these metabolic diseases, and your risks are even higher.

While we can’t change our family history, we can change our diet and lifestyle and lower our risk.

Attaining a waist to height ratio of 0.5 is often associated with lower blood sugars, lower blood pressure and better cholesterol – even more so when the diet to achieve the weight loss is intentionally designed for these outcomes.

If you would like help getting on your own road to better health, please send me a note using the Contact Me form on this web page, and let me know how I can help.

To our good health,

Joy

You can follow me at:

https://twitter.com/lchfRD

https://www.facebook.com/lchfRD/

References

  1. Ashwell M, Gunn P, Gibson S (2012) Waist-to-height ratio is a better screening tool than waist circumference and BMI for adult cardiometabolic risk factors: systematic review and meta-analysis. Obes Rev 13: 275—286
  2. Ashwell M, Mayhew L, Richardson J, Rickayzen B (2014) Waist-to-Height Ratio Is More Predictive of Years of Life Lost than Body Mass Index. PLoS ONE 9(9)

Copyright ©2018  The LCHF-Dietitian (a division of BetterByDesign Nutrition Ltd.)

LEGAL NOTICE: The contents of this blog, including text, images and cited statistics as well as all other material contained here (the ”content”) are for information purposes only.  The content is not intended to be a substitute for professional advice, medical diagnosis and/or treatment and is not suitable for self-administration without the knowledge of your physician and regular monitoring by your physician. Do not disregard medical advice and always consult your physician with any questions you may have regarding a medical condition or before implementing anything  you have read or heard in our content.

Crispy Cauliflower Pizza Crust

This recipe is posted as a courtesy to those following a variety of low-carb and ketogenic diets (not necessarily Meal Plans designed by me). This recipe may or may not be appropriate for you.

I’d heard of cauliflower crust pizza but had also heard that it gets notoriously soggy shortly after coming out of the oven. Recently, a few people were remarking how much they like the taste but wish there was something that could be done about the texture – which I took it as a challenge. With a little thought and a fair amount of experience, I created a light, crisp cauliflower pizza crust that is a lovely change from “fathead-style” pizzas.

I started with a few basic cauliflower recipes and took the best of each and then added low-carb ingredients that would both improve the nutrient profile and solve the texture issue. Boom! Done.

For those looking for a crisp and light cauliflower pizza crust, the recipe is below.

Note: I had a hard time deciding between the crisp cauliflower crust and the Crisp Keto Pizza that I created last winter. You may need to do as I did last week and make both, to decide.


Ingredients

Crispy Cauliflower Pizza Crust – makes 8 slices

1 medium head cauliflower, cut into flowerettes
1/4 cup Parmesan, grated
1/4 tsp sea salt
1 egg, large
1 cups mozzarella, grated
1/2 cup plus 2 Tbsp whey protein isolate powder
1/2 tsp baking powder

1/2 cup garlic and herb pizza sauce
1 cups mozzarella, grated

[optional: additional toppings of your choice]

Directions

  1. wash the cauliflower, break into flowerettes and pulse in a food processor or industrial blender until a fine powder (like rice).
  2. place ‘riced’ cauliflower in a microwave-safe bowl, cover and microwave for 3 minutes on high, then let sit for 3 minutes.
  3. transfer cooked cauliflower to a clean, linen tea-towel and allow to cool.
  4. preheat the oven to 425 F.
  5. once the cauliflower is cooled, gather up the tea-towel and wring out as much of the water as possible, being careful not to mash the cauliflower (only wring the water out).
  6. place the wrung out cauliflower in a non-metallic bowl, with the beaten egg, salt, Parmesan, mozzarella, whey protein powder and baking powder and mix by hand until well combined.
  7. transfer the mixture to a non-stick pizza pan and pat down with your hand until it fills the pan
  8. bake for 10-15 minutes until golden brown.
  9. if using immediately, add the tomato sauce and mozzarella cheese (and any additional toppings of your choice) and bake for 10 minutes more, until the cheese is nicely melted and bubbly. Enjoy!

Macros (per slice)

Protein: 30.6 g
Net Carbs: 8.7 g
Fat: 17.7 g
Energy: 336 kcal

a turkey pepperoni version of Crispy Crust Cauliflower Pizza

You can follow me at:

 https://twitter.com/lchfRD

  https://www.facebook.com/lchfRD/

Don’t Try This at Home – the need for medication supervision

There are some things that people should not do on their own and one of them is to begin a low carb or ketogenic diet without first consulting with their doctor, especially if they take certain types of medication. Medical supervision is absolutely required before a person changes the level of  their carbohydrate intake if they are taking;

(1) insulin

(2) medication to lower blood glucose such as sodium glucose co-transporter 2 (SGLT2) medication including Invokana, Forxiga, Xigduo, Jardiance, etc. and other types of glucose lowering medication such as Victoza, etc.

(3) medication for blood pressure such as Ramipril, Lasix (furosemide), Lisinopril / ACE inhibitors, Atenolol / β-receptor antagonists

(4) mental health medication such as antidepressants, medication for anxiety disorder, and mood stabilizers for bipolar disorder and schizophrenia.

I don’t provide low carbohydrate dietary services those taking insulin (either Type 1 Diabetes or Type 2 Diabetes), but encourage those considering adopting this type of lifestyle to first consult with a healthcare professional with CDE certification, as well as their family doctor. This is very important because clinical studies indicate that insulin levels need to be adjusted downward very soon after beginning a low carbohydrate or ketogenic diet and this must be medically supervised.

I also recommend to those taking medication for mental health conditions that they consult with their psychiatrist and/or family practice physician before changing their diet. A low carb or ketogenic diet may have an effect on the dosage of medication required, especially with mood stabilizing medications such as Lithium. (A recent article written by Psychiatrist Georgia Ede, MD related to a ketogenic diet appeared in Psychology Today and appears here.)

Why do I advise people coming to me to implement a low carbohydrate or ketogenic lifestyle and taking medication to control their blood sugar or blood pressure first consult with their doctor before changing how they eat? It is because eating less carbohydrate can result in blood sugar levels and blood pressure coming down fairly soon afterward and this can have serious consequences if dosages of these medications are not monitored and adjusted downward (and often being discontinued entirely).  For example, a sudden drop in blood pressure could result in people becoming dizzy or confused and could even result in injury to themselves or others if they ‘blacked out’ while walking or driving a car.

Some medications which lower blood sugar such as sodium glucose co-transporter 2 (SGLT2) medication including Invokana, Forxiga, Xigduo, Jardiance, etc. can result in life-threatening and even fatal cases of a very serious condition called “Diabetic ketoacidosis (DKA)” even with no change in diet, but these risks can be increased for patients on a very low carbohydrate diet as the combination of the medication and the low carb diet may increase the amount of ketone production (see Health Canada’s Safety Review here).

Those with significant alcohol consumption who are taking these medications are at risk for DKA, so it is very important that if you drink alcohol on a regular basis and take these medications to tell your doctor. If you are taking any of these medications and come to me, I will ask you about your alcohol consumption because alcohol and these medications together could potentially result in this serious and potentially life-threatening condition.

People taking any of the above medications (or any medications for other conditions) should not adopt a low carb or ketogenic lifestyle on their own without first checking with their doctor.

Another thing that people should never do on their own is adjust the dosage of any of their prescribed medication without first discussing it with their doctor. The consequences of doing so can be very serious, even life-threatening. Medication dosages and timing must be adjusted by a doctor.

Another condition which is less common than DKA but is very serious is Hyperosmolar Hyperglycemia State (HHS).  It is life-threatening and has a much greater death rate than DKA, reaching up to 5-10%. It is most commonly seen in people with Type 2 Diabetes (T2D) that have some illness which results in reduced fluid intake, and them becoming seriously dehydrated. Being sick with an infection is one such situation where it is very important for you to see your doctor if you have T2D, so they can monitor you for HHS. You can read more about HHS here.

If you come to see me to adopt a low carb or ketogenic diet, I will work with you to coordinate dietary and lifestyle changes with your doctor, as they monitor your health and adjust the levels of prescribed medications. In more complex cases, I may ask for written consent to coordinate care with your doctor because depending on those medications, your doctor may need to know in advance what level of carbohydrates you have been advised to eat so that they can monitor your health and make adjustments in your medication dosage.

Your health is important and your diet and the medications need to be coordinated and overseen by your doctor. The potential risks are too great to attempt to do this on your own.

Do you have questions as to how I could work with you and your doctor as they oversee you adopting a low carb lifestyle?  Feel free to drop me a note using the Contact Me form on the tab above.

To your good health!

Joy

If you would like to read well-researched, credible ”Science Made Simple”  articles on the use of a low carb or ketogenic diet for weight loss, as well as to significantly improve and even reverse the symptoms of Type 2 Diabetes, high cholesterol and other metabolic-related symptoms, please  click here.

You can follow me at:

 https://twitter.com/lchfRD

  https://www.facebook.com/lchfRD/


Copyright ©2018  The LCHF-Dietitian (a division of BetterByDesign Nutrition Ltd.) 

LEGAL NOTICE: The contents of this blog, including text, images and cited statistics as well as all other material contained here (the ”content”) are for information purposes only.  The content is not intended to be a substitute for professional advice, medical diagnosis and/or treatment and is not suitable for self-administration without the knowledge of your physician and regular monitoring by your physician. Do not disregard medical advice and always consult your physician with any questions you may have regarding a medical condition or before implementing anything  you have read or heard in our content.


Keto 153 – Interview with Joy Kiddie, the LCHF-Dietitian from Ketovangelist

For those who are curious about my background and how I came to practice and support the use of a therapeutic low carb and ketogenic diet, here is the interview that was done by Brian Williamson, from Ketovangelist just this past week (May 1 2018).

The interview lasts just over an hour (there’s a short commercial at the beginning and end of the interview) and begins with discussing my research, findings and publication in a peer-reviewed journal in the area of mental health nutrition (specifically micronutrient intake and dietary intake in ADHD) and how that research background contributed to my approach to using a low carbohydrate and ketogenic diet in therapeutic nutrition.

During the interview, Brian and I discussed several areas, including the politics of nutrition, changes in Dietary Guidelines in both the US and Canada in 1977, the obesity epidemic and the role that I see for individual nutrition in helping those with Type 2 Diabetes and insulin resistance and many of the associated conditions of high blood pressure, high triglycerides / abnormal cholesterol levels and obesity.

Special thanks to Brian Williamson for inviting me and to Chris, his editor for his post-production work.

I hope you enjoy the interview, and feel free to drop me a note through the Contact Me form, if you have any questions on how I can help you, either in-person or via Distance Consultation on Skype.

To our good health!

Joy

Keto 153 – Joy Kiddie interview on Ketovangelist

Please click the MP3 player bar above to listen to the interview.

If you would like to read well-researched, credible ”Science Made Simple”  articles on the use of a low carb or ketogenic diet for weight loss, as well as to significantly improve and even reverse the symptoms of Type 2 Diabetes, high cholesterol and other metabolic-related symptoms, please  click here.

You can follow me at:

 https://twitter.com/lchfRD

  https://www.facebook.com/lchfRD/


References

Here is the link to the interview on Ketovangelist https://www.ketovangelist.com/keto-153-joy-kiddie-shares-her-story-and-how-shes-changing-the-world-as-a-lchf-dietitian/


A Therapeutic Low Carb Diet

When people are diagnosed with Type 2 Diabetes they are often sent for Diabetes education which teaches them, among other things to “choose starchy foods such as whole grain breads and cereals, rice, noodles, or potatoes at every meal” and that “good management of diabetes includes healthy eating, staying active and taking required medication [1]”.  There is certainly a need for medication when blood sugar levels are not being controlled but what if in other cases, as Hippocrates has said food could be our medicine?

Food As Medicine

A therapeutic diet is involved in the management and treatment of many diseases and conditions. When someone is diagnosed with Celiac disease, for instance  they are taught by a Dietitian to avoid gluten-containing foods because these cause damage to their intestines. A therapeutic diet for someone with Celiac disease involves them avoiding gluten-containing foods and beverages because eating them causes damage to their body.

A therapeutic diet for someone that is diagnosed with a food allergy often involves them avoiding eating that food and related foods that may also cause an adverse reaction.  If a person is allergic to banana, for instance they may also react to pineapple, papaya or chestnuts. Except in the case of serious (anaphylactic) allergies, after a person has avoided those foods for a long time, a “food challenge” may be done to determine whether the person is later able to tolerate the foods in question, or not. Sometimes foods are able to be reintroduced later and other times, such as the case of Celiac disease, they cannot because to do so will result in damage to their body.

A therapeutic diet in someone diagnosed with Type 2 Diabetes involves limiting foods that result in too much insulin being released and/or that results in their blood sugar rising too high and too often. This may be for a period of time – after which something that can be likened to a ‘food challenge’ can be performed to determine whether there has been significant improvement or not and if so, which kinds of carbohydrate may be able to be re-introduced, in what quantities and with what frequency.  More on that below.

Evidence Base for Using Dietary Carbohydrate Restriction in Diabetes Management

A Critical Review Article written by 26 authors and researchers appeared in the Journal of Nutrition in 2015 provided 12 points of evidence to support the use of low-carbohydrate diets as the first approach to treating Type 2 Diabetes. The summary of these points include that;

  1. Hyperglycemia is the most salient feature of Diabetes and that dietary carbohydrate restriction has the greatest effect on decreasing blood glucose levels.
  2. During the epidemics of obesity and Type 2 Diabetes, caloric increases have been due almost entirely to increased carbohydrates.
  3. Benefits of dietary carbohydrate restriction do not require weight loss.
  4. Although weight loss is not required for benefit, no dietary intervention is better than carbohydrate restriction for weight loss.
  5. Adherence to low-carbohydrate diets in people with Type 2 Diabetes is at least as good as adherence to any other dietary interventions and is frequently significantly better.
  6. Replacement of carbohydrate with protein is generally beneficial.
  7. Dietary total and saturated fat do not correlate with risk for cardiovascular disease.
  8. Plasma saturated fatty acids are controlled by dietary carbohydrate more than by dietary lipids.
  9. The best predictor of microvascular and, to a lesser extent, macrovascular complications in patients with Type 2 Diabetes, is glycemic control (HbA1c).
  10. Dietary carbohydrate restriction is the most effective method (other than starvation) of reducing serum TGs and increasing high-density lipoprotein.
  11. Patients with Type 2 Diabetes on carbohydrate-restricted diets reduce and frequently eliminate medication (and people with Type 1 usually require lower insulin).
  12. Intensive glucose lowering by dietary carbohydrate restriction has no side effects comparable to the effects of intensive pharmacologic treatment.

The authors provided strong support of the 12 points, concluding that there is a need for “reappraisal of dietary recommendations” which stems from;

1. The general failure to halt the epidemic of Diabetes under current
guidelines,

2. The specific failure of low-fat diets to improve obesity, cardiovascular
risk, or general health (points 1 and 4),

3. Constant reports of side effects of commonly prescribed
Diabetes medications, some quite serious (points 12),

4. Most importantly, the continued success of low carbohydrate
diets to meet the challenges of improvement in the features of Diabetes and metabolic syndrome in the absence of side effects.

The authors underscore that

“the benefits of carbohydrate restriction are immediate and well-documented.”

and that

“Concerns about the efficacy and safety of carbohydrate restriction are long term and conjectural rather than data driven. Most objections stem from the proposed dangers of total or saturated fat embodied in the so-called diet—heart  hypothesis. At this point, the diet—heart hypothesis has had a record of very limited clinical or experimental success to support its position.”

As I’ve mentioned in past articles, a low carbohydrate diet is not new, but may in fact represent the diet followed by humans for much of our evolutionary history, prior to the rise of agriculture. Given the very positive outcomes of carbohydrate restricted diets, the authors conclude that people with Type 2 Diabetes should not be discouraged from following such a diet as is often the case, but rather that the strength of the evidence is that;

“current knowledge dictates that carbohydrate restriction should be a default treatment for Type 2 Diabetes and a default adjunct therapy for Type 1.”

The authors state that the insistent by those that object to the use of low carbohydrate diets on the basis that long-term randomized controlled trials are the only kind of data that will be accepted “is without precedent in science.”

“The seriousness of diabetes requires that we evaluate all of the evidence that is available. The 12 points are sufficiently compelling that we feel that the burden of proof rests with those who are opposed.’


Authors of this Review included:

  1. Richard D. Feinman Ph.D, Department of Cell Biology, State University of New York
  2. Wendy K. Pogozelski Ph.D, Department of Chemistry, State University of New York
  3. Arne Astrup M.D., Department of Nutrition, Exercise and Sports, Copenhagen University
  4. Richard K. Bernstein M.D., New York Diabetes Center, Mamaroneck, NY
  5. Eugene J. Fine M.S., M.D., Department of Radiology (Nuclear Medicine), Albert Einstein College of Medicine, Bronx, New York
  6. Eric C. Westman M.D., M.H.S., Duke University Medical Center, Durham, NC
  7. Anthony Accurso M.D., Department of Medicine, Johns Hopkins Bayview Medical Center, Baltimore, MD
  8. Lynda Frassetto M.D. Department of Medicine, University of California San Francisco, San Francisco, CA
  9. Barbara A. Gower Ph.D. Department of Nutrition Sciences, University of Alabama at Birmingham, Birmingham, Alabama
  10. Samy I. McFarlane M.D., Departments of Medicine and Endocrinology, State University of New York Downstate Medical Center, Brooklyn, NY
  11. Jí¶rgen Vesti Nielsen M.D., Karlshamn, Sweden
  12. Thure Krarup M.D. Department of Endocrinology I, Bispebjerg University Hospital, Copenhagen, Denmark
  13. Laura Saslow Ph.D. University of California San Francisco, San Francisco, CA
  14. Karl S. Roth M.D. Department of Pediatrics, Creighton University, Omaha, NE
  15. Mary C. Vernon M.D. Private Practice, Lawrence, KS
  16. Jeff S. Volek R.D., Ph.D. Department of Human Sciences (Kinesiology Program) Ohio State University, Columbus, OH
  17. Gilbert B. Wilshire M.D. Mid-Missouri Reproductive Medicine and Surgery, Columbia, MO
  18. Annika Dahlqvist M.D. Hí¤lsocentralen Centrum, Sundsvall, Sweden
  19. Ralf Sundberg M.D., Ph.D. Private Practice, Malmí¶, Sweden
  20. Ann Childers M.D. Private Practice, Lake Oswego, OR
  21. Katharine Morrison M.R.C.G.P., Ballochmyle Medical Group, Mauchline, East Ayrshire, Scotland
  22. Anssi H. Manninen M.H.S. Metabolia Oulu, Oulu, Finland
  23. Hussain M. Dashti M.D., Ph.D., F.A.C.S., F.I.C.S., Faculty of Medicine, Department of Surgery, Kuwait university, Kuwait
  24. Richard J. Wood Ph.D. Springfield College, Springfield, MA
  25. Jay Wortman M.D. First Nations Division, Vancouver, BC, Canada
  26. Nicolai Worm Ph.D. German University for Prevention and Health Care Management, Saarbrí¼cken, Germany

Blood Sugar Response in Healthy People vs Actual Responses in Individual Diabetics

We have the Glycemic Index  (GI) which tells us how easily specific foods raise blood sugar in healthy people; specifically how much blood sugar will rise when a healthy person eats 50 g of that food and Glycemic Load (GL) tells us how healthy people respond to the carbohydrate in one serving of that food.

As outlined in the previous two articles titled “Not All Carbs Are Created Equal“, while brown rice and whole grain spaghetti may have a lower GI or GL than their white counterparts, they still result in a rapid rise in blood sugar even in healthy people. Would we expect brown rice or whole grain spaghetti to have any better a response in those with Type 2 Diabetes? Of course not, yet the recommendations are for those with Type 2 Diabetes to eat “starchy foods such as whole grain breads and cereals, rice, noodles, or potatoes at every meal“.

Given that the symptom of Type 2 Diabetes is that body can’t properly use the insulin that is released and as a result “sugar builds up in the blood instead of being used as energy” [1] – how does it make sense to recommend to someone with Type 2 Diabetes to “eat starchy foods such as whole grain breads and cereals, rice, noodles, or potatoes at every meal” because these “starchy foods are broken down into glucose, which your body needs for energy”[1]? Either the body can’t use the food as energy because of the dysfunction in insulin or it can.

In Type 2 Diabetes, the mechanism in which the body effectively uses carbohydrates for energy is ‘broken’ and body keeps making and releasing more and more insulin to try and bring glucose into the cells. Common sense would indicate that a therapeutic diet for someone with an intolerance to more than very small amounts of carbohydrate would be to limit foods that are high in carbohydrate, particularly those that cause a rapid spike in blood glucose even in healthy people.

We don’t need to guess how much a person with Type 2 Diabetes’ blood sugar is going to rise when they eat a food based on the GI or GL (which is based on healthy people) because we can test it in THEM!

As mentioned in the previous article, without spending any additional money on testing equipment, someone with Type 2 Diabetes can eat 25 g or 50 g of a carbohydrate-based food, test their blood sugar every half hour and know exactly how their body responds to it!  They can see their blood sugar rise to 11 mmol/L (200 mg/dl) or 14 mmol/L (250 mg/dl) or 16.5 mmol/L (297 mg/dl) or higher in the first hour and KNOW. No guess work is required! 

With the availability of relatively inexpensive Continuous Glucose Monitors (CGM) such as the  FreeStyle Libre ($50 CDN) and one sensor worn for 2 weeks ($90), someone with Type 2 Diabetes can test 25 g or 50 g of specific carbohydrate-based food and KNOW exactly how their body responds!

Continuous Glucose Monitor (CGM) readings

People with Type 2 Diabetes can KNOW that 1/2 cup of whole grain rice or 1/2 of a baked potato (or some other food) resulted in their blood sugar spiking to 16.5 mmol/L (297 mg/dl) and know that this is not a food they tolerate even when eaten with a mixed meal that includes protein-based foods and non-starchy vegetables.  

Guess work based on Glycemic Index or Glycemic Load – the blood sugar response of healthy people is no longer needed. 

Role for a Therapeutic Low Carb Diet

Just as there is a role for a therapeutic diet in other food-related conditions such as food intolerance and Celiac disease, there is a role for a therapeutic diet in Type 2 Diabetes.

A person diagnosed with Type 2 Diabetes has (1) the inability to handle more than a very small carbohydrate load and (2) has cells which are insulin resistant, therefore it makes good clinical sense to design a therapeutic diet which enables them to lower their overall blood glucose response in order to enable the pancreatic beta cells that remain to begin to recover (these are the cells that produce insulin) and to allow their body cells which have become insulin resistant to become insulin sensitive again.

A Dietitian is knowledgeable to design such an  therapeutic diet in such a ways as to include a wide variety of foods that supplies all the essential amino acids, fatty acids, vitamins and minerals that a person requires while containing only small amounts of carbohydrate at any given time

Lab test results such as fasting insulin and fasting blood glucose (to calculate HOMA-IR) and tests of insulin response to a known glucose load (3 hour challenge) could be performed in time to monitor the degree of improvement in insulin sensitivity and pancreatic function or simply use existing routine lab tests such as TG:HDL ratio as a proxy, along with HbA1C and fasting blood glucose. This way, once a person’s body has begin to heal and restore some beta-cell function, a Dietitian can then design a customized therapeutic diet around each individual’s actual tolerance or intolerance to specific carbohydrates!  We don’t need to rely on glycemic response data such as the GI or GL (which are based on healthy people) but can use an individual’s own blood sugar response! 

We do this in other types of food intolerance by means of a “food challenge” and it is time we do this in Type 2 Diabetes as well.

With the advent of relatively inexpensive Continuous Glucose Monitors, we have the technology for individuals to do this easily with the help of a Dietitian, such as myself. It is more labour-intensive, but it can certainly be done using the standard blood glucose monitor that Diabetics already own and use by standardizing the size of the test food and testing blood sugar every 1/2 an hour for 3 hours.

It is long overdue for those with Type 2 Diabetes to be able to have therapeutic diets which are designed to improve their symptoms, rather than to expect them to eat carbohydrate loads they can’t handle, getting worse in time, then turning to medication to manage the disease. Type 2 Diabetes does not have to be “a chronic, progressive disease”.

Do you have questions how a low carb diet may be able to help you manage and improve the symptoms of Type 2 Diabetes?

Please send me a note using the ”Contact Me” form on this web page and I will respond shortly.

To our good health!

Joy

If you would like to read well-researched, credible ”Science Made Simple”  articles on the use of a low carb or ketogenic diet for weight loss, as well as to significantly improve and even reverse the symptoms of Type 2 Diabetes, high cholesterol and other metabolic-related symptoms, please  click here.

You can follow me at:

 https://twitter.com/lchfRD

  https://www.facebook.com/lchfRD/

References

  1. Diabetes Canada, Diabetes and You, Basic Meal Planning, https://www.diabetes.ca/diabetes-and-you/healthy-living-resources/diet-nutrition/basic-meal-planning
  2. Richard D. Feinman, Wendy K. Pogozelski, Arne Astrup, Richard K. Bernstein, Eugene J. Fine, Eric C. Westman, Anthony Accurso, Lynda Frassetto, Barbara A. Gower, Samy I. McFarlane, Jí¶rgen Vesti Nielsen, Thure Krarup, Laura Saslow, Karl S. Roth, Mary C. Vernon, Jeff S. Volek, Gilbert B. Wilshire, Annika Dahlqvist, Ralf Sundberg, Ann Childers, Katharine Morrison, Anssi H. Manninen, Hussain M. Dashti, Richard J. Wood, Jay Wortman, Nicolai Worm,

Dietary carbohydrate restriction as the first approach in diabetes management: Critical review and evidence base,
Nutrition,
Volume 31, Issue 1,
2015,
Pages 1-13,

Copyright ©2018  The LCHF-Dietitian (a division of BetterByDesign Nutrition Ltd.) 

LEGAL NOTICE: The contents of this blog, including text, images and cited statistics as well as all other material contained here (the ”content”) are for information purposes only.  The content is not intended to be a substitute for professional advice, medical diagnosis and/or treatment and is not suitable for self-administration without the knowledge of your physician and regular monitoring by your physician. Do not disregard medical advice and always consult your physician with any questions you may have regarding a medical condition or before implementing anything  you have read or heard in our content.


Some Carbs are Better than Others (for Diabetics) – Part 3

INTRODUCTION: In the first article in this series on carbohydrates, I explained that Glycemic Index (GI) is a way to rate carbohydrates based how easily they raise the blood sugar of healthy people and that some carbohydrates are better than others when they cause much less of a rise in blood sugar. I wanted to know how would I react to carbohydrate-based foods now that I have been eating low carb for so long (>1 year) and have seen a partial reversal of symptoms of the Type 2 Diabetes that I’ve had for more than 10 years.

I decided to conduct some impromptu ‘experiments’ and the results led to some reading in the literature. The information I discovered is VERY exciting for me and for others with Type 2 Diabetes or Insulin Resistance.

Once people have achieved significant reversal of symptoms following a therapeutic low carb or ketogenic diet, there is a way to begin to re-introduce carb-based foods in a way that does not cause their blood sugar to spike.

As you may recall from the first article in this series on Carbohydrates, the Glycemic Index of a food is determine by having healthy people eat 50 grams of digestible carbohydrate of a given food, and then measure their blood glucose response over a 2 hour period (30 minutes, 60 minutes, 90 minutes, 120 minutes), plotting the curve then measuring the area under the curve (AUC) and comparing it to the AUC of pure glucose, the reference food.

The problem with the Glycemic Index or even the Glycemic Load (based on individual serving sizes) is that this data does not apply to those with Diabetes or Insulin Resistance.

Since I have been Diabetic for a long time, I decided to go about conducting my own sample-set-of-one (n=1) ‘experiment’, and one thing led to another…

The ‘Test Food’

I ate 1/2 cup of chickpeas (cooked from dried) which has 25 g of carbohydrate and measured my blood sugar response with the same meter at 30 minutes, 60 minutes, 90 minutes, 120 minutes, 180 minutes and 210 minutes.

blood glucose response to 25 g of chickpeas, cooked from dried

At the time I did this, I hadn’t eaten in 8 hours (considered a fasted state) and my starting blood sugar was 4.8 mmol/L (86 mg.dl). The chickpeas were part of a mixed meal with some chicken (high biological value protein) and a cucumber salad with olive oil.

At the highest point, my blood sugar went up to 5.8 mmol/L (105 mg/dl),  stayed there, then started to drop at 2 hours.

I was amazed.

When I first began changing my lifestyle a year ago, even eating low GI foods such as chickpeas caused my blood sugar to jump dramatically. I recall the first few months when I would eat 1 cup of hummus, which is chickpeas with tahini (ground sesame seeds) and has even more fiber than chickpeas alone and also has only 25 g of carbs, my blood sugar would always go up to ~ 8.6 – 8.9 mmol/L (155- 160 mg/dl).

This was a HUGE improvement after not eating more than 30 g of carbohydrate per day (i.e. a ketogenic diet) for the last 6 months!

The ‘Reference Food’

Two weeks ago, I was at a social occasion where a milk-chocolate covered cracker was served and I decided (in the interest of science, of course!) to read the nutritional label, measure out exactly 25 g of carbohydrate of this food and eat it, measuring my blood sugar at 0 minutes, 60 minutes, 90 minutes, 120 minutes, and 180 minutes.

This ‘reference food’ (high GI) was eaten after a dinner that had a fair amount of high biological value protein (steak) as well as some healthy fats (olive oil on vegetables) and fiber in the vegetables, and my starting blood sugar was 6.7 mmol/L (121 mg/dl).

Just look at the blood sugar spike!

When I ate 25 gm of carbohydrate as the cracker and chocolate, my blood glucose went from 6.7 mmol/L to 9.8 mmol/L (121 mg/dl -177 mg/dl)! That is, I had eaten the SAME amount of carbohydrate (25 g of carbs) as when I ate the cooked chickpeas and had THREE TIMES the blood sugar response!!

Both the meals I ate just before the ‘reference food’ (high GI, highly refined cracker with chocolate) and the ‘test food’ (low GI, intact chickpeas) had a high biological value protein (chicken, steak) which slows the blood sugar response of the body, and both had the same amount of fiber (the exact same salad).

Below is a graph of the two responses (chickpeas in blue, chocolate covered cracker, orange) over 3+ hours.

It is quite evident that 25 g of carbs as white flour with milk chocolate (refined carbs) is processed VERY differently by my body than 25 g of carbs such as whole, intact chickpeas!!

Comparison of blood glucose response of 25 g of carbohydrate as chickpeas and white flour cracker with chocolate (special thanks to Phil Thompson of the “Lower Insulin” Facebook group for the graph and calculations of area under the curve)

The area under the curve (AUG) was determined by lowering the cracker and chocolate curve down to sit just above the chickpea curve (grey curve) and then assessing where the respective points were and running the AUG formula relative to baseline.

The AUG of 25 g of carbs as chickpeas was 129.

The AUG of 25 g of carbs as white flour cracker with chocolate was 381.

The difference was 2.95.

The blood sugar response of the cracker with chocolate was THREE TIMES GREATER than the blood sugar response of the chickpeas – and both contained 25 g of carbs!

Some carbs are quite clearly better than others for this Type 2 Diabetic.*

* As I will elaborate on below, people’s blood sugar response to different carbohydrate-based food is quite individual.

Objective Data

Facsimile for Glycemic Index of Cracker with Chocolate

I was able to find for purposes of estimation, that 25 g of carbohydrate as white bread with 5 g of margarine (a pretty good facsimile for 25 g of carbohydrate as white flour cracker covered with milk chocolate made with palm oil) has a GI of 70.1 when compared to the reference which was 25 g glucose in 125 ml water [1].

Studies of Effect of Eating Legumes (Pulses) Alone

A meta-analysis of 10 studies on the effect of pulses (legumes) eaten alone on blood sugar control in people with and without Diabetes [2] provided some helpful information. The pulses in the meta-analysis included chickpeas, black-eyed peas and various other beans (including red and white kidney, black, pinto, fava and white navy).

Seven of the 10 trials that looked at the effect of eating pulses alone had a crossover design (five had a washout period), studied a total of 253 participants, of which only 21 had Type 2 Diabetes, and 232 that had normal blood sugar.

Background diets were largely high-carbohydrate, low-fat diets (carbohydrate 52% of energy, protein 18% of energy, fat 29% of energy).

Due to the length of time I have had Type 2 Diabetes and the very high degree of persistent insulin resistance over the first 6 months of eating low carb but not ketogenic, the last 6 months my diet has been very low in carbohydrate (5-10% of energy), moderate in protein ~23% and 67-77% healthy fats.

It was found that fasting blood glucose following the eating of pulses alone was decreased by 0.82% (95% CI ), but there was no long term effect on HbA1C (3 month average blood sugar) or on HOMA-IR (fasting blood glucose: fasting insulin).

[Of interest, in low GI diets, eating of pulses lowered HbA1C (3 month average blood sugar) by 0.28% but had no change on fasting blood sugar or HOMA-IR. The average GI of the pulse-containing low-GI diets was 67 and as compared to the GI value of bread alone.]

The conclusions of the meta-analysis found that the strongest modifiers of benefit were in Type 2 Diabetes and that the legumes that modified blood sugar the most were black beans, white/navy beans, pinto beans, red and white kidney beans, chickpeas and fava beans.

“Specific to the pulses alone analysis, pulse species including Phaseolus vulgaris (black, white, pinto, red and white kidney beans), Cicer arietinum (chickpeas) and Vicia faba (fava beans) were also identified as significant modifiers.” [2]

Individual Glycemic Response  – role for personalized nutrition

A 2015 study from Israel[3] with 800 people who were monitored with continuous glucose monitors indicates that there isn’t a ‘universal’ blood sugar response to low GI foods or high GI carbs – that glycemic (blood sugar) response is very individual. 

“We continuously monitored week-long glucose levels in an 800-person cohort, measured responses to 46,898 meals, and found high variability in the response to identical meals, suggesting that universal dietary recommendations may have limited utility.

The study also found that an individual’s blood sugar response to different foods was able to be predicted by type and amounts of bacteria in their intestines (the ‘gut biome’ / ‘microbiome’ / ‘microbiota’) . 

Based on the data they collected, the team has since created and validated a machine-learning algorithm that combines blood parameters, dietary habits, anthropometrics (height, weight data), physical activity and gut microbiota  data that they say accurately predicts a person’s individual post meal blood sugar response to actual meals.

Applications in Dietetic Practice for Personalized Nutrition

There is a tremendous opportunity for Dietitians such as myself to help individuals with Type 2 Diabetes or pre-diabetes determine which carbohydrate-based foods cause the lowest, most gradual rise in blood sugar.

This is huge!

This means that after individuals have had significant reversal of Type 2 Diabetes / Insulin Resistance following a therapeutic low carb or ketogenic diet for a period of time, I can help them re-introduce carb-based foods into their diet by selecting ones that have the least impact on their blood sugar!

There are two ways this can be done;

  1. USING EXISTING BLOOD GLUCOSE METER – I can help those with Type 2 Diabetes eat a specific amount of a ‘test food’ that contains 50 g of carbohydrate (I will calculate this for them) and have them test their blood sugar every 30 minutes for 2 or 3 hours with the blood glucose meters they already have.  Then, I can take that data, enter it into an Excel sheet just as was done with my data above, and determine their blood sugar response.
  2. USING A CONTINUOUS GLUCOSE MONITOR – continuous glucose monitors (CGMs) such as the FreeStyle Libre have become relatively inexpensive and would be ideal for this kind of testing. Test strips for most standard home blood glucose monitors are $1 a piece, so testing every 30 minutes for 3 hours costs $6. The FreeStyle Libre costs $50 for the unit, and while test patches are $90 and last only two weeks, huge varieties of carbohydrate-based foods can be tried and measured in a short time, with no effort.

As a Dietitian I can not only help individuals carry out this kind of individual testing of carbohydrate-based foods, I can help them interpret the results as we begin to re-introduced some foods back into the diet once significant reversal of insulin resistance has been accomplished through the therapeutic use of a low carbohydrate or ketogenic diet.

Have questions how I can help you reverse insulin resistance by following a therapeutic low carb diet? Have you been following a low-carb or ketogenic diet for a while and want to begin determining which carb-based foods don’t spike your blood sugar? I can help.

Please send me a note using the “Contact Me” form on this web page and I will respond shortly.

To our good health!

Joy

You can follow me at:

 https://twitter.com/lchfRD

  https://www.facebook.com/lchfRD/


References

  1. Aston LM, Gambell JM, Lee DM, Bryant SP, Jebb SA. Determination of the glycaemic index of various staple carbohydrate-rich foods in the UK diet. European journal of clinical nutrition. 2008;62(2):279-285.
  2. Sievenpiper, J.L., Kendall, C.W.C., Esfahani, A. et al. Effect of non-oil-seed pulses on glycaemic control: a systematic review and meta-analysis of randomised controlled experimental trials in people with and without diabetes. Diabetologia (2009) 52: 1479.
  3. Zeevi D, Korem T, Zmora N, et al. Personalized Nutrition by Prediction of Glycemic Responses. Cell. 2015 Nov 19;163(5):1079-1094.

Copyright ©2018  The LCHF-Dietitian (a division of BetterByDesign Nutrition Ltd.) 

LEGAL NOTICE: The contents of this blog, including text, images and cited statistics as well as all other material contained here (the ”content”) are for information purposes only.  The content is not intended to be a substitute for professional advice, medical diagnosis and/or treatment and is not suitable for self-administration without the knowledge of your physician and regular monitoring by your physician. Do not disregard medical advice and always consult your physician with any questions you may have regarding a medical condition or before implementing anything  you have read or heard in our content.


Some Carbs Are Better Than Others – Part 2 – Glycemic Load

In the introduction to this series on Carbohydrates, I explained that Glycemic Index (GI) is a way to rate carbohydrates based how easily they raise blood sugar. If you recall, low GI foods (those with a value of 55 or less) are more slowly digested, absorbed and metabolized and cause a lower and slower rise in blood glucose levels and very high GI foods (>70) are digested very rapidly, casing a large spoke in blood sugar. High GI foods (>55) are result in a fairly rapid rise in blood sugar.

The GI value of a food is determined comparing how healthy people’s blood sugar responds over a two hour period to a food containing 50 grams of digestible carbohydrate from that food compared to 50 grams of glucose (pure sugar). The drawback to this rating scale is that the values are only known for a serving that has 50 grams of carbs in it.  That is, they compare the ability for different foods containing the SAME amount of carbohydrate it (50 g) to raise blood sugar. The problem with the Glycemic Index is that its hard to compare foods because a serving size may have considerably less than 50 g of carbs in it.  For example, the Glycemic Index of watermelon is 76, which is as high as the Glycemic Index of a doughnut, but one serving of watermelon (1/2 a cup) has 11 g of carbohydrate in it, while a medium doughnut (one serving) has 23 g of carbs.

This is where the concept of Glycemic Load (GL) is much more helpful, because it tells us how a healthy person’s body will respond to the carbs in one serving of a food. One usual serving of a food would be considered to have a very high Glycemic Load if it is ≥20, a high Glycemic Load if it is between 11-19 and a low Glycemic Load if it is ≤10.

How to Determine Glycemic Load

To determine Glycemic Load  (GL) of a serving of a food, what needs to be known is:

The Glycemic Index (GI) of that food (found by referring to a table of Glycemic Indexes)

The number of grams of carbohydrate in the quantity of food considered to be one serving.

  • GL  = GI x (amount of carbohydrate per serving) / 100

For purposes of comparison,  let’s look at the Glycemic Load of the same foods we looked at the Glycemic Index for in the first article.

One slice of white bread has a Glycemic Load of 10 and so does one slice of whole wheat bread, which is considered low. Both have 15 g of carbs per slice.

One 1 cup of cooked white spaghetti has a Glycemic Load of 25 which is considered very high and while 1 cup of whole grain spaghetti only has a Glycemic Load of 14, this is still not low, just lower than white spaghetti.

A cup of boiled white rice has 53 g of carbs in it and has a very high Glycemic Load = 35. A cup of white spaghetti has 44 g of carbs in it and also has a very high Glycemic Load at 25. These foods are high in carbohydrate and will cause a rapid rise in blood sugar in healthy people. To those who are already Diabetic or pre-Diabetic this is a big problem.

One cup of cooked whole grain spaghetti has a Glycemic Load of 14 which is still not low and has 37 g of carbs in it.

A cup of boiled brown rice has a Glycemic Load of 20 which is still considered very high and has 42 g of carbs.  These foods are high in carbohydrate and will cause a fairly rapid rise in blood sugar in healthy people, let alone those who are already having problems.

So what’s the problem?

Eating a high Glycemic Load diet over a period of years and years will result in blood sugar after meals (called post prandial blood glucose) to be high. This puts a huge demand on the body to keep releasing insulin to try to move all that glucose into the body’s cells and get it out of the blood. Over time, a high Glycemic Load diet causes the body’s pancreas β-cells (beta cells) to decrease in function or in many cases, to die, resulting in a diagnosis of Type 2 Diabetes. As can be seen above, even eating the “whole grain” version of favourite foods does not necessarily reduce the insulin demand on our pancreas. Our  β-cells are under continual pressure to release insulin every time we eat – from our breakfast toast or cereal, to our mid-morning muffin, to our pasta lunch. Eating a low carb diet is a very effective way to lower the demand on our pancreas to keep producing and releasing insulin to deal with the constant spikes in our blood sugar from carbohydrate containing foods. But does that mean we need to remain eating a low carb diet forever? More on that in future articles in this series.

Glycemic Load will tell us how much a serving of food will increase our blood sugar but it doesn’t tell us how much insulin our body releases as a result of eating a food – that is, the demand we are putting on our pancreatic β-cells.

For those that have been eating a high carbohydrate diet for years and years or have a family history of Type 2 Diabetes, knowing how much insulin is needed to process the carb -based foods we eat is hugely important, because we need to eating foods that do not put a large demand on our pancreatic β-cells.  For those that already have Type 2 Diabetes, it is especially important to eat in such a way as to preserve whatever β-cell function we have left!  Referring to the Insulin Index enables us to choose between carb-based foods based on the demand they put on our β-cells.

If you have questions as to how I can help you choose foods that result in much less glucose being released and also put much less demand on your  β-cells to keep producing and releasing insulin, please send me a note using the “Contact Me” form located on the tab above.

To our good health!

Joy

You can follow me at:

 https://twitter.com/lchfRD

  https://www.facebook.com/lchfRD/


Reference

Oregon State University, Linus Pauling Institute, Micronutrient Information Centre, Glycemic Index and Glycemic Load http://lpi.oregonstate.edu/mic/food-beverages/glycemic-index-glycemic-load#glycemic-index


Copyright ©2018  The LCHF-Dietitian (a division of BetterByDesign Nutrition Ltd.) 

LEGAL NOTICE: The contents of this blog, including text, images and cited statistics as well as all other material contained here (the ”content”) are for information purposes only.  The content is not intended to be a substitute for professional advice, medical diagnosis and/or treatment and is not suitable for self-administration without the knowledge of your physician and regular monitoring by your physician. Do not disregard medical advice and always consult your physician with any questions you may have regarding a medical condition or before implementing anything  you have read or heard in our content.

A Dietitian’s Journey – one of the most popular stories

Last night, Dr. Andreas Eenfeldt, the founder of Diet Doctor posted on Twitter that they had just updated their “Success Stories” page – encouraging people to;

“have a look at some of the most amazing and inspiring personal stories from the over 600 that we have published.”

I clicked on it, only to discover that my story is 5th in the women over 40 category! There are many incredible stories there, but perhaps what makes my story so popular, is that I am a formerly obese Dietitian.

For those that haven’t yet read my story yet, here is the summary of my progress from March 5, 2017 to March 5, 2018, as it appeared on Diet Doctor on March 14th, 2018;

While my weight loss plateaued for a month as I had begun my resistance training program (gaining muscle and losing fat) my weight loss has resumed once again. This “Dietitian’s Journey” will continue as I have not yet reached a low-risk waist circumference (one where my waist circumference is half my height).  I still have to lose another 3 inches to lose (having already lost 8 inches!), so however many pounds I need to lose to get there, is how much longer I have to go.  I am guessing that will be in about 20-25 pounds which may take another 6 months or so, but I’m not really concerned about the time because this “journey” is about me getting healthy and lowering my risk factors for heart attack and stroke, and any amount of time it takes is what it will take.  It took years to make myself that metabolically unhealthy and it will take time for me to get to a healthy body weight and become as metabolically ‘well’ as possible.

Although I am a Dietitian, I have to lose weight and lower my blood sugar the same way as everyone else does; one pound and one meal at time, but it can be done!

It has been slightly over 10 years since I was diagnosed as having Type 2 Diabetes, and while it may not be possible to reverse my Diabetes because it has been this long, based on the clinical data I’ve seen I will be able to achieve complete and long term remission of symptoms provided I keep doing what I need to do once I achieve it. This is a lifestyle, not a “diet”.  My health and quality of life depend on it.

While I may not be able to reverse my own Type 2 Diabetes, I get the joy (and privilege) of helping those who have been more recently diagnosed work on reversing theirs . Equally rewarding is helping those who have been diagnosed as having pre-Diabetes from ever getting that diagnosis!

If you would like to know how I can help you in this regard, please send me a note using the Contact Me form on this web page and I’ll be glad to answer your questions.

Meanwhile, be encouraged. If I can do it, so can you. You can read my one-year anniversary post here.

To our good health,

Joy

You can follow me at:

 https://twitter.com/lchfRD

  https://www.facebook.com/lchfRD/


Note: I am a "sample-set of 1" - meaning that my results may or may not be like any others who follow a similar lifestyle. If you are considering eating "low carb" and are taking medication to control your blood sugar or blood pressure, please discuss it with your doctor, first.

Copyright ©2018 The LCHF-Dietitian (a division of BetterByDesign Nutrition Ltd.) 

LEGAL NOTICE: The contents of this blog, including text, images and cited statistics as well as all other material contained here (the ”content”) are for information purposes only.  The content is not intended to be a substitute for professional advice, medical diagnosis and/or treatment and is not suitable for self-administration without the knowledge of your physician and regular monitoring by your physician. Do not disregard medical advice and always consult your physician with any questions you may have regarding a medical condition or before implementing anything  you have read or heard in our content.


Some Carbs Are Better Than Others – Part 1 – Glycemic Index

INTRODUCTION: Not all carbs are created equal; some are broken down very quickly into simple sugars and others are broken down very slowly. In the past the terms “simple sugar” and “complex carbohydrate” were used to imply this concept there are newer terms that enable us to know how much eating these foods will raise blood glucose in healthy people. The “in healthy people” is important, as the ability to tolerate carbohydrate in those with insulin resistance (“pre-diabetes”) or Type 2 Diabetes is significantly affected.

This is the first article in a new series on carbohydrate.

Glycemic Index

The Glycemic Index (GI) is a way of rating carbohydrates based on their ability to raise blood sugar.

Low GI foods (those with a value of 55 or less) are more slowly digested, absorbed and metabolized and cause a lower and slower rise in blood glucose levels and very high GI foods (>70) are digested very rapidly, casing a large spoke in blood sugar. High GI foods (>55) are result in a fairly rapid rise in blood sugar. Keep in mind that Glycemic Index only indicates how slowly or quickly foods will increase blood sugar, not how much higher blood sugar will go

Many of the foods people eat lots of in our society, such as bread, rice, pasta and cereal, even vegetables, are high GI foods. As once healthy people continue to eat these foods on a regular basis, they put a high demand on their body to produce and release insulin, which brings all that glucose into their cells. This insulin is released from the beta cells in the pancreas and people eating these high GI foods means that their beta cells have to release insulin over and over all day long and this constant demand on the beta cells, over time, results in the cells throughout their body becoming insulin resistant (no longer responding to insulin’s signal) or burning out their beta cells, resulting in Type 2 Diabetes.

Many people don’t realize that by the time they are diagnosed with Type 2 Diabetes, they already have beta cell dysfunction, beta cell death and/or a decrease in beta cell mass. Once beta cells die, they’re gone. Our once healthy body is no longer healthy.  When we eat foods with significant carbohydrate – especially high GI carbohydrates, our ability to release insulin is significantly impacted and as a result, we can no longer tolerate carbs like we used to.  While the mechanism is different, it’s similar to someone that becomes intolerant to gluten; once they’re celiac, they can no longer tolerate foods that contain gluten without causing damage to their body.  Depending how long someone had Type 2 Diabetes when they were finally diagnosed, or how long they had it before they changed their eating habits will all factor in to how much carbohydrate they can process. For this reason, each person is different.

It’s not that carbs are inherently “bad”. It’s that our bodies are no longer able to process some of them they way we could when we were still healthy – so in those cases the sugar stays in our blood, damaging tissues throughout our body.

Knowing which carbs are high GI is important, because these are the foods that tax our already overtaxed beta cells if we are not Diabetic and limiting these foods significantly, or avoiding may be the best way for healthy people to remain healthy.

The good news is that there are some types of carbohydrates that some people can not only tolerate, but may actually improve their blood sugar control, and that’s the topic of an upcoming article.

How the GI of a Food is Determined

The GI value of a food is determined by feeding a group of healthy people the amount of a food that contains 50 grams of digestible (available) carbohydrate and then measuring the effect on their blood glucose levels over the next two hours. The area under their two-hour blood glucose response (glucose AUC) for this food is then measured.

At another time, the same group of healthy people eat 50 grams of glucose, (which is the reference food) and their two-hour blood glucose response is also measured.

The GI value for the test food is calculated for each person in the group by dividing their glucose AUC for the test food by their glucose AUC.

The final GI value for the test food is the average GI value all the people in the group.

In summary to determine the Glycemic Index of a food healthy (non-diabetic) people;

(a) eat 50 grams of digestible carbohydrate of a particular food

(b) measure their blood glucose response over a 2 hour period

(c) plot the curve and measure the area under the curve (AUC)

(d) compare that AUC of the test food to the AUC of pure glucose (i.e. produced when the same people eat 50 g of glucose, which is the reference food.

Too Much of a ‘Good’ Thing

Many of the foods that people in the West enjoy and eat a lot such as bread, rice and noodles are High GI foods – these are ones that are rated at  ≥ 55 (compared to pure glucose, which is rated at 100).

White bread has a GI of 75 ± 2 and whole wheat bread isn’t much better, at 74 ± 2.

Boiled white rice is high GI at 73 ± 4, and while somewhat better boiled brown rice is still high GI at 68 ± 4.

White spaghetti has a GI of 49 ± 2 and whole grain spaghetti has a GI of 48 ± 5.

Rice noodles, such as those in Pho (Vietnamese Beef Noodle soup) are even higher, at 53 ± 7.

Breakfast cereals, whether boxed or cooked are also high GI.  Here is a table that summarizes some of these [1];

BREAKFAST CEREALS  Glycemic index (glucose = 100)
Cornflakes 81 ± 6
Wheat flake biscuits 69 ± 2
Porridge, rolled oats 55 ± 2
Instant oat porridge 79 ± 3
Muesli 57 ± 2

Many people include vegetables such as potato, sweet potato and squash such as pumpkin in their “vegetable quota” for the day, but let’s look at the Glycemic Index for these;

VEGETABLES  Glycemic index (glucose = 100)
Potato, boiled 78 ± 4
Potato, instant mash 87 ± 3
Potato, french fries 63 ± 5
Carrots, boiled 39 ± 4
Sweet potato, boiled 63 ± 6
Pumpkin, boiled 64 ± 7

People in our culture eat a lot of bread, rice, pasta, starchy vegetables and cereal but one of the things we know is that eating them with good source of protein slows down how quickly they affect blood sugar. Oftentimes bread and cereal form the basis of breakfast, perhaps with a high GI glass of juice and frequently, people eat pasta with a tomato sauce for supper (or leftovers for lunch), and this kind of meal will spike their blood sugar. We also know that the fiber content of a mixed meal will also slow down the rate at which blood sugar rises from these carbs, so there are ways to ‘tone down’ the response.

Some Final Thoughts…

If you have a family history of Type 2 Diabetes, are overweight or have high blood sugar, it’s important to understand that what you eat matters and to eat in a way that does not put high demand on your beta cells to keep releasing insulin to process all that glucose.

The time to consider the effect on your body is now – before you get sick by having overtaxed your pancreas’ beta cells and experience beta cell death or mass loss and are diagnosed with Type 2 Diabetes.

Once we’ve crossed that threshold; once our once healthy body is no longer healthy, we need to learn to eat in a way that does not put high demand on our beta cells, that does not require our body to process large amounts of glucose at a time, in order to preserve whatever beta cell mass and function we have left.

Determining which carb-containing foods we can tolerate and in what quantities will enable us to eat in a way that keeps us from getting worse and keeps us from developing the very serious consequences of not doing so, which can include blindness, toe and food amputations and more.

In coming articles, I’ll explain Glycemic Load and the Insulin Index and I’ll also touch on a role for legumes (pulses) such as chickpeas and sources of “resistant starch” in a moderate carb ‘Mediterranean-style’ diet.

If you just found out you are pre-diabetic, now is the time to do something about it. Waiting will not make it better.

If you’ve been recently be diagnosed with Type 2 Diabetes, it’s not too late.  Studies have shown that changing eating habits and lifestyle soon after diagnosis makes it possible for some people to reverse their symptoms and to have their Diabetes go into remission. One thing is known, that doing nothing will bring needless firsthand understanding to the phrase that “Diabetes is a chronic, progressive disease”.  It doesn’t have to be.

If you want to know how I can help you, please send me a note using the “Contact Me” form located on the tab above.

To our good health!

Joy

You can follow me at:

 https://twitter.com/lchfRD

  https://www.facebook.com/lchfRD/

References

  1. https://www.health.harvard.edu/diseases-and-conditions/glycemic-index-and-glycemic-load-for-100-foods

Also see: Atkinson FS, Foster-Powell K, Brand-Miller JC, “International tables of glycemic index and glycemic load values”, Diabetes Care 31(12); 2281-2283


Copyright ©2018  The LCHF-Dietitian (a division of BetterByDesign Nutrition Ltd.) 

LEGAL NOTICE: The contents of this blog, including text, images and cited statistics as well as all other material contained here (the ”content”) are for information purposes only.  The content is not intended to be a substitute for professional advice, medical diagnosis and/or treatment and is not suitable for self-administration without the knowledge of your physician and regular monitoring by your physician. Do not disregard medical advice and always consult your physician with any questions you may have regarding a medical condition or before implementing anything  you have read or heard in our content.

What is a Mediterranean Style Diet?

The recently released 2018 Clinical Practice Guidelines (CPG) Guidelines of Diabetes Canada recommend that those with Diabetes continue to eat 45% to 65% of their daily calories as carbohydrate, 10% to 35% of their daily calories as protein and only 20% to 35% of their daily calories, yet affirm that there is “evidence to support a number of other macronutrient-, food- and dietary pattern-based approaches” and that “evidence is limited for the rigid adherence to any single dietary approach”[1] .

One of the dietary patterns they recommend is a “Mediterranean-style dietary pattern” in order to “reduce major cardiovascular events and improve glycemic (blood sugar) control.”

So what is a “Mediterranean-style dietary pattern”?

According to the Clinical Practice Guidelines,

A ”Mediterranean diet” primarily refers to a plant-based diet first described in the 1960s. General features include a high consumption of fruits, vegetables, legumes, nuts, seeds, cereals and whole grains; moderate-to-high consumption of olive oil (as the principal source of fat); low to moderate consumption of dairy products, fish and poultry; and low consumption of red meat, as well as low to moderate consumption of wine, mainly during meals”

Countries with coastlines on the Mediterranean Sea include Albania, Algeria, Bosnia and Herzegovina, Croatia, Cyprus, Egypt, France, Greece, Israel, Italy, Lebanon, Libya, Malta, Morocco, Monaco, Montenegro, Slovenia, Spain, Syria, Tunisia and Turkey and the diets of these countries vary considerably, so there isn’t only ONE “Mediterranean Diet”.

What is the Mediterranean Diet that the Clinical Practice Guidelines are referring to?

It would seem that they are referring to dietary intake based of southern Italy from the 1960s from when rates of chronic disease were reported to be amongst the lowest in the world and adult life expectancy was reported to be amongst the highest. That is, the health benefits of “The Mediterranean Diet” came out of Ancel Keys’ Six Country Study (1953) and later his Seven Countries Study (1970).  More on that below.

One of the academic papers that the Guidelines cites as the basis for a “Mediterranean diet” makes the direct link to Ancel Keys clear;

“Ecologic evidence suggesting beneficial health effects of the Mediterranean diet has emerged from the classic studies of
Keys.” [2]

In 1953, Ancel Keys published the results of his ”Six Countries Study”[3], where it is said he demonstrated that there was an association between dietary fat as a percentage of daily calories and death from degenerative heart disease.

Four years later, in 1957, Yerushalamy published a paper with data from 22 countries [4], which showed a much weaker relationship between dietary fat and death by coronary heart disease than was suggested by Keys’s six country data (see below).

from [3].Keys, A. Atherosclerosis: a problem in newer public health. J. Mt. Sinai Hosp. N. Y.20, 118—139 (1953).

from [4] Yerushalmy J, Hilleboe HE. Fat in the diet and mortality from heart disease. A methodologic note. NY State J Med 1957;57:2343—54

Nevertheless, in 1970, Keys went on to publish his Seven Countries Study in which he maintained that there was an associative relationship between increased dietary saturated fat and Coronary Heart Disease – ignoring the data presented in Yerushalamy’s 1957 study and failing to study countries such as France, in which the relationship did not hold.

In Keys’ paper published in 1989 [5] which was based on food consumption patterns in the 1960s in the seven countries, he found that the average consumption of animal foods (with the exception of fish) was positively associated with 25 year Coronary Heart Disease deaths rates and the average intake of saturated fat was strongly related to 10 and 25 year CHD mortality rates. Keys published this study 32 years after Yerushalamy’s 1957 paper which showed a significantly weaker relationship, yet it seems that people only remember Key’s data.

Countries with coastlines on the Mediterranean Sea on which there was known dietary and disease data in 1957 and that Keys later ignored in 1970 included France (labelled #8 on Yerushalamy’s graph above) and Israel (labelled #11). France is known for the “French paradox” (a term which came about in the 1980s) because of their relatively low incidence of coronary heart disease (CHD) while having a diet relatively rich in saturated fats. According to a 2004 paper about the French Paradox, there was diet and disease data available from the French population that was carried out in 1986—87 and which demonstrated that the saturated fat intake of the French was 15% of the total energy intake, yet such a high consumption of saturated fatty acids was not associated with high Coronary Heart Disease incidence in France [6]. Nevertheless, Keys published his 1989 study [5] ignoring the French dietary and disease data that was available from 1986-1987 [6]. Was it because it didn’t fit his hypothesis?

The diet of the French in the 1960’s was every bit a “Mediterranean Diet” as that of southern Italy, but since Ancel Keys ignored (or did not study) the French data in the 1960s, that “Mediterranean Diet” remains ignored in the guidelines of today.

According to the French Paradox paper, high saturated fat intakes combined with low Coronary Heart Disease rates were also observed in other Mediterranean countries, including Spain and that rates in other non-Mediterranean Europeans countries such as Germany, Belgium are similar [6].

Perhaps then, a ‘true’ Mediterranean Diet which is protective of Coronary Heart Disease ought not to be defined as being largely “plant-based” and “low in consumption of red meat and dairy” – which the French diet clearly is not, but rather should focus on being a diet high in consumption of specific types of vegetables and fruit, nuts and seeds, abundant in the use of olive oil and that includes regular consumption of wine with meals.

As outlined in a recent article, eight recent meta-analysis and systemic reviews which reviewed evidence from randomized control trials that had been conducted between 2009-2017 did not find an association between saturated fat intake and the risk of heart disease. As well, recently published results from the Prospective Urban and Rural Epidemiological (PURE) Study, the largest and most global epidemiological study carried out to date and published in the Lancet in December 2017 found that those who ate the largest amount of saturated fats had significantly reduced rates of mortality (death) and that low consumption of saturated fat (6-7% of calories) was actually associated with increased risk of stroke.

Also as described in a recent article, a study published at the end of March 2017 in Nutrients and which examined health and nutrition data from 158 countries worldwide found that total fat and animal fat consumption were least associated with the risk of cardiovascular disease, and that high carbohydrate consumption, particularly as cereals and wheat was most associated with the risk of cardiovascular disease – with both of these relationships holding up regardless of a nation’s average national income.

Final Thoughts…

The 2018 Clinical Practice Guidelines continue to recommend the health benefits of a “Mediterranean style diet” defined based on the 60-year-old-data of Ancel Keys’ Six Countries Study / 50 year old Seven Countries Study- when we now know that Keys excluded data that was available from countries including France, which did not fit his hypothesis.

Given that there seems to be increasing evidence that Keys’ Diet-Heart Hypothesis (the belief that dietary saturated fat causes heart disease) has been significantly challenged by newer data, is it not time to study the factors in the diet of this region that ARE protective against cardiovascular disease, and to redefine a Mediterranean diet in these terms?

Would you like to have a Meal Plan that emphasizes the foods of this region, including meat and cheese, fish and seafood, vegetables and fruit, nuts and seeds, olive oil and wine and which may play a protective role in heart heath?

Please send me a note using the Contact Me form located on the tab above, and I will reply as soon as possible.

To our good health!

Joy

You can follow me at:

 https://twitter.com/lchfRD

  https://www.facebook.com/lchfRD/


References

  1. Sievenpiper JL, Chan CB, Dwortatzek PD, Freeze C et al, Nutrition Therapy – 2018 Clinical Practice Guidelines, Canadian Journal of Diabetes 42 (2018) S64—S79 http://guidelines.diabetes.ca/docs/CPG-2018-full-EN.pdf
  2. Trichopoulou A, Costacou T, Bamia C et al, Adherence to a Mediterranean Diet and Survival in a Greek Population, N Engl J Med 2003;348:2599-608.
  3. Keys, A. Atherosclerosis: a problem in newer public health. J. Mt. Sinai Hosp. N. Y.20, 118—139 (1953).
  4. Yerushalmy J, Hilleboe HE. Fat in the diet and mortality from heart disease. A methodologic note. NY State J Med 1957;57:2343—54
  5. Kromhout D, Keys A, Aravanis C, Buzina R et al, Food consumption patterns in the 1960s in seven countries. Am J Clin Nutr. 1989 May; 49(5):889-94.
  6. Ferrií¨res J. The French paradox: lessons for other countries. Heart. 2004;90(1):107-111.

Copyright ©2018  The LCHF-Dietitian (a division of BetterByDesign Nutrition Ltd.) 

LEGAL NOTICE: The contents of this blog, including text, images and cited statistics as well as all other material contained here (the ”content”) are for information purposes only.  The content is not intended to be a substitute for professional advice, medical diagnosis and/or treatment and is not suitable for self-administration without the knowledge of your physician and regular monitoring by your physician. Do not disregard medical advice and always consult your physician with any questions you may have regarding a medical condition or before implementing anything  you have read or heard in our content.

A Dietitian’s Journey – defeating discouragement

For the last month I haven’t lost any weight and on top of that, my HbA1C went up a bit (from 6.4% to 6.5%, despite the fact that I’m eating the way I’m supposed to, tracking my macros and exercising. Like anybody else, I was a little discouraged. Defeating discouragement often involves me asking myself what I would I say to a client who was in the same position.

My “Dietitian self” reminded “me” that March 5th, at the beginning of my second year living a low-carb lifestyle, I began resistance training and have been doing it regularly since and muscle weighs more than fat.

In fact, 5 lbs of fat and 5 lbs of muscle take up very different amounts of space, and I’ve certainly lost “inches” this last month, especially off my abdomen.  Loss of fat from deep inside my gut is very likely related to loss of the dangerous and metabolically active visceral fat (the fat around my organs and in my liver).  This is good! At the same time, I’ve gained significant amount of muscle on my arms and legs that I can feel.

So what happened to the fat?

Here is the Science Made Simple explanation:

The fat (triglycerides) in my liver was broken down into glycerol and free fatty acids and the free fatty acids were then moved into my blood and sent to my tissues, which used them for fuel. Since I have been eating a ketogenic level of carbohydrates for approximately 5 months now, my main fuel source is fat and ketones.

The mitochondria in my tissues broke the free fatty acids down using a process known as β-oxidation and the end result is a product called acetylCoA. This acetylCoA was used in a metabolic pathway called the Citric Acid Cycle to make an interim source of energy called NADH2 which then went to the electron transport chain in my mitochondria (the powerhouse of the cells) where it was made into ATP, the energy that the entire body runs on.

Once the glycogen in my muscles was all used up and as I continued to exercise to muscle failure, ketones were made from the AcetylCoA and used as fuel in the mitochondria of all my organs, including my brain.  The brain always has some glucose uptake but that can be made from the same source as the glucose used to maintain blood sugar; from the breakdown of amino acids from protein and the breakdown of fatty acids.

So is that why my blood sugar went up?

When I am doing High Intensity Training (lifting weights very slowly until muscle failure) my body first uses up all the glycogen stored in those muscles.

(Remember, glycogen is the short-term storage location for energy.)

As I keep exercising faster than my body can produce energy via the electron transport chain in my mitochondria, lactic acid builds up. This lactic acid goes to my liver and makes pyruvate which gets converted to glucose – and it’s this glucose which raises my blood sugar. Ahhh, yes. The good ‘ol Cori Cycle and gluconeogenesis (literally “making new glucose”).

During the last month, I lost approximately 5 pounds of fat and gained about 5 pounds of muscle which I estimated from the visible amount of fat lost mostly from my abdomen (also from other areas), and the amount of muscle I gained over the same time period.

Above is a representation of what those 5 pounds of fat looks like in a garbage can – where they belong, not around my organs!

To see the approximate 5 pounds of muscle I gained, I took a ‘selfie”.  Not great, but compared to what I looked like before I changed my lifestyle, it’s certainly an improvement. I’m a work in process.

In case I forgot what I looked like before I changed my lifestyle, yesterday I found a picture of myself barbecuing out back from a year and a half ago.

This photo is quite the glaring reminder of what I looked like before I adopted a low carb lifestyle (Mar 5 2017).

…and here is the thirty pounds of fat (not counting the estimated 5 pounds of additional fat that I lost this month and gained in muscle) – also in a garbage can, where it belongs!

That is a lot of fat.

So, even if I can’t “see” the 5 pounds of fat that I lost this month on the scale, I can see it off my abdomen. At the same time, I can see the 5 pounds of muscle that I gained in the mirror and I weigh the same. The math is easy.

This isn’t ‘water’ loss, as I am well into my weight loss journey.

While I’m not thrilled that my HbA1C went from 6.4% to 6.5% during the last 3 months, it is explainable from the exercise that I am doing which breaks down glycogen to make glucose for my blood.

Increasing my muscle mass in time will make me less insulin resistant, eventually enabling me to lower my blood sugar more quickly after a meal.  As well, as the visceral fat continues to be decreased, my liver should become more insulin sensitive, as well.  This is both a good thing and a challenging thing.  It is good, because it will enable my liver to take glucose out of my blood more efficiently than it can now, but it will be challenging, because the main role of insulin is as a storage hormone. If I eat more than my body can use, it will be stored again in my fat cells (both under my skin and the bigger problem; back in my liver and around my organs).  I will develop the symptoms of Type 2 Diabetes again, and likely the high cholesterol and high blood pressure that I had before. That is why this is a lifestyle and not a “diet”.  It’s easy to do something as if your life depends on it, when it does.

As long as I maintain the lifestyle I have adopted, I can continue to reverse the symptoms of my Type 2 Diabetes and despite the naysayers, this is a very sustainable way to live.  One look at the Science Made Simple articles that I’ve written about the wide range of food we can eat, my food posts with pictures of some of the meals I’ve made and the range of recipes I’ve developed, one can see I am not being deprived and neither are others that follow a well-designed low carb eating style.

Much of what I do as a Dietitian in helping people be successful at losing weight and turning around symptoms of chronic disease is determining how much of which kinds of food will both provide them with the nutrients they need and also enable them to reach their weight loss and health goals.  But I also provide coaching which supports people to be successful over the long term and this is very satisfying work. Sometimes ‘coaching’ may involve ‘tweaking’ their Meal Plan or helping them find some breakfast options or eating-out-at-restaurant options, and other times it is helping them understand why they haven’t loss weight and what approach might be best to turn that around.

Do you have questions about what’s involved with having me design a Meal Plan for you? Please send me a note using the “Contact Me” form located on the tab above and I will reply shortly.

To our good health,

Joy

You can follow me at:

 https://twitter.com/lchfRD

  https://www.facebook.com/lchfRD/


Note: I am a “sample-set of 1” – meaning that my results may or may not be like any others who follow a similar lifestyle. If you are considering eating “low carb” and are taking medication to control your blood sugar or blood pressure, please discuss it with your doctor, first.

Copyright ©2018 The LCHF-Dietitian (a division of BetterByDesign Nutrition Ltd.) 

LEGAL NOTICE: The contents of this blog, including text, images and cited statistics as well as all other material contained here (the ”content”) are for information purposes only.  The content is not intended to be a substitute for professional advice, medical diagnosis and/or treatment and is not suitable for self-administration without the knowledge of your physician and regular monitoring by your physician. Do not disregard medical advice and always consult your physician with any questions you may have regarding a medical condition or before implementing anything  you have read or heard in our content.


Diabetes Canada 2018 Clinical Practice Guidelines – option of a low carb diet


Diabetes Canada has released their long-awaited 2018 Clinical Practice Guidelines [1] which affirms that nutrition therapy is an integral part of people’s self-management of their Diabetes, as well as part of the treatment for the disease.  One of the main goals of nutrition therapy is to maintain or improve the quality of life and nutritional and physical health of those with the disease, while preventing the need to treat both sudden (acute) and long term complications. Effective nutrition therapy can improve blood sugar control, including reducing three-month average blood glucose (i.e. HbA1C, glycated hemoglobin) by 1.0% to 2.0%.

Diabetes Canada 2018 Clinical Practice Guidelines

The new Guidelines mention that since Canada has wide ethnic and cultural diversity, with each group having their distinct foods, preparation methods, and dietary patterns and lifestyles. Effective nutritional therapy needs to take these cultural variations into account and needs to be individualized;  specific to the individual, their age, the duration they’ve had type 2 diabetes, their goals, personal values and preferences, along with their individual need, lifestyle and economic situation. They recognize that nutrition therapy for those with Diabetes is not “one-size-fits-all”.

“Nutrition therapy should be individualized, regularly evaluated, reinforced in an intensive manner and should incorporate self-management education. A registered dietitian (RD) should be involved in the delivery of care wherever possible.”

The Nutrition Therapy Guidelines recommend that those with Diabetes follow the recommendations of Eating Well with Canada’s Food Guide;

“The starting point of nutrition therapy is to follow the healthy
diet recommended for the general population based on Eating Well With Canada’s Food Guide.”

They recommend that those with Diabetes continue to eat 45% to 65% of their daily calories as carbohydrate, 10% to 35% of their daily calories as protein and only 20% to 35% of their daily calories as fat, yet at the same time say that “the ideal macronutrient distribution for the management of diabetes can be individualized”;

“The ideal macronutrient distribution for the management of diabetes can be individualized. Based on evidence for chronic disease prevention and adequacy of essential nutrients, the DRIs (Dietary Reference Intakes) recommend acceptable macronutrient distribution ranges (AMDRs) for macronutrients as a percentage of total energy. These include 45% to 65% energy for CHO, 10% to 35% energy for protein and 20% to 35% energy for fat.”

They recommend that those with Diabetes continue to follow the same macronutrient distribution (percent of carbs, protein and fat) as the general population because it

“may help a person attain and maintain a healthy body weight while ensuring an adequate intake of carbohydrate (CHO), fibre, fat, protein, vitamins and minerals.”

What is encouraging is that they also have said that there is evidence to support a number of other macronutrient-, food- and dietary pattern-based approaches and advise against any rigid adherence to any one approach;

“There is evidence to support a number of other macronutrient-, food- and dietary pattern-based approaches. As evidence is limited for the rigid adherence to any single dietary approach, nutrition therapy and meal planning should be individualized.”

These Guidelines leave it open to individuals to choose other dietary approaches and outline a number of those approaches in the body of the text and in a summary table (Table 1). Figure 1 and Figures 2 and Table 1 in the Clinical Practice Guidelines (below) present an algorithm that summarizes the approach to nutrition therapy for diabetes which includes;

“allowing for the individualization of therapy in an evidence-based framework”.

Figure 1 – Clinical Assessment – Diabetes Canada 2018 Clinical Practice Guidelines

Figure 2 – Stage Targeted Nutrition Flowchart – Diabetes Canada 2018 Clinical Practice Guidelines

Table 1:

Table 1: Properties of Dietary Intervention – Diabetes Canada 2018 Clinical Practice Guidelines

The new Diabetes Canada guidelines recognize that the ideal macronutrient distribution (the ratio of carbs, protein and fat) may vary and depend on, amongst other things, the individual’s values and preferences;

“The ideal macronutrient distribution for the management of diabetes may vary, depending on the quality of the various macronutrients, the goals of the dietary treatment regimen and the individual’s values and preferences.”

That is, they recognize that a person’s individual preference for the amount and type of protein (animal-based, plant-based, both), fat (from animal or plant based sources), as well as the amount and type of carbohydrate in their diet factors into their personal decision for how they choose to manage their diabetes.

The Clinical Practice Guidelines for Nutrition Therapy mentions that based on the 3 systematic and meta-analysis of controlled trials of carbohydrate restricted diets that they looked at (mean carbohydrate intake from 4% to 45% of total daily energy) that consistent improvements in HbA1C, lipids and blood pressure weren’t shown.

“As for weight loss, low-carbohydrate diets for people with type 2 diabetes have not shown significant advantages for weight loss over the short term. There also do not appear to be any longer-term advantages.”

So while they do not believe based on the few studies that they examined that there is any advantage to someone following a low carbohydrate diet, there are no clear disadvantages. It comes down to individual preference.

The Guidelines also highlight that there may be a benefit of substituting monounsaturated fat (MUFAs) such as is found in olive oil for carbohydrate (something I regularly do when I design Meal Plans) and that systematic review and meta-analysis of randomized controlled trials found that monounsaturated fat substituted calorie for calorie for carbohydrate did not reduce HbA1C, but did improve fasting blood glucose, body weight, systolic BP, triglycerides and HDL (so-called “good cholesterol”) in people with type 2 diabetes over an average follow up of 19 weeks.

Another finding they reported is that replacement of refined high glycemic index carbohydrates with monounsaturated fat (up to 14.5% total energy) or nuts (up to 5% total energy) has been shown to improve HbA1C and lipids in people with type 2 diabetes over a 3 month period.

Together, these findings provide support to those who prefer to replace high glycemic carbs in their diet (such as white bread, pasta and rice) with monounsaturated fat sources such as olives, avocado as well as some nuts.

The new Clinical Practice Guidelines outline several popular weight-loss diets highlighting that there are a “range of macronutrient profiles are available to people with diabetes”;

“Numerous popular weight-loss diets providing a range of macronutrient profiles are available to people with diabetes. Several of these diets, including the Atkins™, Zone™, Ornish™, Weight Watchers™ and Protein Power Lifeplan™ diets, have been subjected to investigation in longer-term, randomized controlled trials in participants with overweight or obesity that included some people with diabetes, although no available trials have been conducted exclusively in people with diabetes.

They say that a systematic review and meta-analysis of four trials of the Atkins™ diet and 1 trial of the Protein Power Lifeplan™ diet showed that these diets were no more effective than conventional energy-restricted, low-fat diets in inducing weight loss, or with improvements in triglycerides and HDL for up to one year and have been reported to increase total cholesterol and LDL. As mentioned in an earlier article, without differentiating between particle size of LDL (small, dense versus large, fluffy), LDL and total cholesterol going up has not real meaning.

The Guidelines also mentioned that “The Dietary Intervention Randomized Controlled Trial (DIRECT) showed that the Atkins™ diet produced weight loss and improvements in the lipid profile compared with a calorie-restricted, low-fat conventional diet; however, its effects were not different from that of a calorie-restricted Mediterranean-style diet at two years.”

They add that “another trial comparing the Atkins™, Ornish™, Weight Watchers™ and Zone™ diets showed similar weight loss and improvements in the LDL:HDL ratio without effects on fasting blood sugar at one year in participants with overweight or obesity, of whom 28% had diabetes.

So again, it comes down to a matter of choice as to whether someone would prefer to do a calorie-restricted weight loss diet or a well-designed low carb one.

At the end of the paper, the authors make their final recommendations, some of which include that;

“People with diabetes should receive nutrition counselling by a registered dietitian to lower A1C levels and to reduce hospitalization rates”.

“Individuals with diabetes should be encouraged to follow Eating Well with Canada’s Food Guide in order to meet their nutritional needs.”

“In people with overweight or obesity with diabetes, a nutritionally balanced, calorie-reduced diet should be followed to achieve and maintain a lower, healthier body weight”.

“An intensive healthy behaviour intervention program, combining dietary modification and increased physical activity, may be used to achieve weight loss, improve glycemic control and reduce CV risk.”

“In adults with diabetes, the macronutrient distribution as a percentage of total energy can range from 45% to 60% carbohydrate, 15% to 20% protein and 20% to 35% fat to allow for individualization of nutrition therapy based on preferences and treatment goals.”

“People with type 2 diabetes should maintain regularity in timing and spacing of meals to optimize glycemic control.”

“To reduce the risk of cardiovascular disease, adults with diabetes should avoid trans fatty acids and consume less than 9% of total daily energy from saturated fatty acids, replacing these fatty acids with polyunsaturated fatty acids, particularly mixed n-3 / n-6 sources, monounsaturated fatty acids from plant sources, whole grains or low glycemic index carbohydrates”

“Adults with diabetes should select carbohydrate food sources with a low-GI to help optimize glycemic control to improve LDL and to decrease cardiovacular risk.”

“The following dietary patterns may be considered in people with type 2 diabetes, incorporating patient preferences, including:

(a) Mediterranean-style dietary pattern to reduce major cardiovascular events and improve glycemic control.

(b) Vegan or vegetarian dietary pattern to improve glycemic control and reduce myocardial infarction risk.

(c) DASH dietary pattern to improve glycemic control and reduce major cardiovascular events.

(d) Dietary patterns emphasizing dietary pulses (e.g. beans, peas, chickpeas, lentils) to improve glycemic control, systolic BP and body weight.

(e) Dietary patterns emphasizing fruit and vegetables to improve glycemic control and reduce CV mortality.

(f) Dietary patterns emphasizing nuts to improve glycemic control and LDL cholesterol.

Funding sources for the three authors of the Nutrition Therapy guidelines were as follows; Dr. John L. Sievenpiper, MD, PhD; Canadian Institutes of Health Research (CIHR), Calorie Control Council, INC International Nut and Dried Fruit Council Foundation, The Tate and Lyle Nutritional Research Fund at the University of Toronto, The Glycemic Control and Cardiovascular Disease in Type 2 Diabetes Fund at the University of Toronto (a fund established by the Alberta Pulse Growers), PSI Graham Farquharson Knowledge Translation Fellowship, Diabetes Canada Clinician Scientist Award, Banting & Best Diabetes Centre Sun Life Financial New Investigator Award, and CIHR INMD/CNS New Investigator Partnership Prize; grants and non-financial support from American Society for Nutrition (ASN), and Diabetes Canada; personal fees from mdBriefCase, Dairy Farmers of Canada, Canadian Society for Endocrinology and Metabolism (CSEM), GI Foundation, Pulse Canada, and Perkins Coie LLP; personal fees and non-financial support from Alberta Milk, PepsiCo, FoodMinds LLC, Memac Ogilvy & Mather LLC, Sprim Brasil, European Fruit Juice Association, The Ginger Network LLC, International Sweeteners Association, Nestlé Nutrition Institute, Mott’s LLP, Canadian Nutrition Society (CNS), Winston & Strawn LLP, Tate & Lyle, White Wave Foods, and Rippe Lifestyle, outside the submitted work; membership in the International Carbohydrate Quality Consortium (ICQC) and on the Clinical Practice Guidelines Expert Committees of Diabetes Canada, European Association for the study of Diabetes (EASD), Canadian S74 J.L. Sievenpiper et al. / Can J Diabetes 42 (2018) S64—S79 Cardiovascular Society (CCS), and Canadian Obesity Network; appointments as an Executive Board Member of the Diabetes and Nutrition Study Group (DNSG) of the EASD, Director of the Toronto 3D Knowledge Synthesis and Clinical Trials foundation; unpaid scientific advisor for the Food, Nutrition, and Safety Program (FNSP) and the Technical Committee on Carbohydrates of the International Life Science Institute (ILSI) North America; and spousal relationship with an employee of Unilever Canada. Dr. Chan reports grants from Danone Institute, Canadian Foundation for Dietetic Research, Alberta Livestock and Meat Agency, Dairy Farmers of Canada, Alberta Pulse Growers, and Western Canada Grain Growers. Dr. Catherine B Chan has a patent No. 14/833,355 pending to the United States. Dr. Catherine Freeze, MEd, RD reports personal fees from Dietitians of Canada and Government of Prince Edward Island.

Some Final Thoughts…

Much of the same wording  regarding supporting individual preference was previously embodied in the 2013 Clinical Practice Guidelines of the Canadian Diabetes Association. While not “recommended”, there was previously the same option for individuals to choose to follow a low carb lifestyle, based on personal preference.

As a Dietitian, I keep reading and reviewing the literature in order to provide the most current, evidence-based low carbohydrate diet to support those that choose to follow a low carb lifestyle — or who’s doctors recommend that they do, and in this way allow for the individualization of nutrition therapy in an evidence-based framework.

Do you have questions as to how I can help support your preference to follow a low carb lifestyle? Please send me a note using the “Contact Me” form on this web page and I’ll reply as soon as possible.

To our good health,

Joy

You can follow me at:

 https://twitter.com/lchfRD

  https://www.facebook.com/lchfRD/


References

  1. Sievenpiper JL, Chan CB, Dwortatzek PD, Freeze C et al, Nutrition Therapy – 2018 Clinical Practice Guidelines, Canadian Journal of Diabetes 42 (2018) S64—S79 http://guidelines.diabetes.ca/docs/CPG-2018-full-EN.pdf

Copyright ©2018  The LCHF-Dietitian (a division of BetterByDesign Nutrition Ltd.) 

LEGAL NOTICE: The contents of this blog, including text, images and cited statistics as well as all other material contained here (the ”content”) are for information purposes only.  The content is not intended to be a substitute for professional advice, medical diagnosis and/or treatment and is not suitable for self-administration without the knowledge of your physician and regular monitoring by your physician. Do not disregard medical advice and always consult your physician with any questions you may have regarding a medical condition or before implementing anything  you have read or heard in our content.

Keto Quiche Lorraine

This recipe is posted as a courtesy to those following a variety of low-carb and ketogenic diets (not necessarily Meal Plans designed by me). This recipe may or may not be appropriate for you.

I’ve been thinking about different ways to enjoy eggs and remembered an authentic Quiche Lorraine recipe that I invented  years ago. I used to make it when my grandmother (who was from Paris) would come for lunch, and I remember it rivaled the quiches from the shops in Quebec. It took some searching, but I found the card in one of my four recipe boxes and then pondered how to make a keto crust.

I was busy and didn’t have time to over-think it so I did it instinctively. I threw some almond flour in my food processor and 1/2 the amount of coconut flour (my usual ratio), cut in some ice cold unsalted butter.

[Please do NOT use shortening in this recipe or any recipe.  Here’s why: https://www.lchf-rd.com/2018/04/05/concerns-with-polyunsaturated-vegetable-oils/]

Instead of binding it with ice water (the way I would make a regular pastry crust), I cracked in a cold fresh egg.  I could tell when I pulled it from the processor that this was going to be perfect!  I cut the dough in 1/2 and wrapped it in plastic wrap and let it chill a few hours (a necessary step in making a flaky crust) and went back to work.

Making it before dinner was easier than I imagined, or easier than I remembered it as a younger woman. I preheated the oven to high and began to roll out the dough between pieces of waxed paper and placed them each in large Pyrex (glass) pie plates.

I didn’t flute the edges because there wasn’t quite enough extra dough for that, but for quiche it isn’t necessary anyway.

I pre-baked the crusts and could tell as I pulled them out of the oven that these were going to be amazingly flaky!

I lowered the heat to the temperature to start baking the quiches and proceeded to saute the onion, cut up the smoked turkey leg (used in place of ham) and grate the emmenthal (a Swiss cheese). Then I began cracking the eggs,  discarding the whites and then added fresh heavy cream.

I added the hot onion last (so it wouldn’t cook my eggs before I got the mixture in the crusts). I poured half the mixture into each of the two pre-baked pastry shells and popped them into the oven.

The smell of them baking was divine! I’m not a big ‘egg person’ but do I love quiche!

I put them on two racks to cool and was more than glad that at that point family arrived for dinner hungry.


I made a huge tender ruby red salad and plated the quiche.

It did not disappoint!


Here’s the recipe:

Keto Quiche Lorraine – makes 2 pies

All Butter Flaky Pie Crust

1 cup almond flour
1/2 cup coconut flour
1 cup butter, cold
1 large egg

Add the 2 flours to the bowl of a food processor and add chunks of the ice cold butter. Pulse process it until the flour looks like course sand (don’t run the processor, only pulse it to cut in the butter). Crack in an egg and pulse 2-3 times until the dough comes together.  Remove it from the bowl and finish gathering it together by hand.  Form a ball, cut it in half and place the two halves in the refrigerator for several hours.

When ready to make the Quiche Lorraine;

1. Preheat the oven to 475 F.
2. Roll out the pastry crusts between sheets of waxed paper and place each one in a Pyrex (glass) pie plate.
3. Place in the oven immediately (so the butter doesn’t warm up, otherwise it won’t be flaky).
4. Bake 8 minutes and remove from oven.

While the crusts are pre-baking, saute the onion and make the filling.

Quiche Lorraine Filling

6 egg yolks, plus 2 whole eggs
1 cup diced naturally smoked turkey (or thick cut naturally smoked ham)
1 medium onion, diced finely and sauteed in 1 Tbsp of butter
2 cups heavy cream
1 cup Emmenthal (can use Swiss or Gruyere cheese)
freshly ground pepper
(no salt is needed because the smoked meat and the cheese are salty)

1. saute the onion in the butter
2. in a medium size bowl, beat the egg yolks and whole egg
3. add the diced smoked turkey (or ham)
4. coarsely grate the Emmenthal and add to mixture
5. pour in heavy cream
6. season with plenty of coarsely ground black pepper

When the pie crusts come out of the oven, lower the heat to 400F and when the mixure is ready, fill the pie shells and bake immediately for 20 minutes and 400F, then lower the heat to 350F and continue baking for ~15 minutes more. Watch them closely, because they shouldn’t be too dark on top.

Serve with a large baby green salad and enjoy!

Macros per slice (1/4 of A large quiche -2 servings)

If you would like some information about how I can help you follow a low-carb or ketogenic lifestyle, please send me a note using the “Contact Me” form above.

Remember, I provide both in-person services, as well as appointments via Distance Consultation (telephone / Skype) so whether you live in the greater Vancouver area, in another part of Canada or the world, I’m here to help.

To our good health!

Joy

If you would like to read well-researched, credible ”Science Made Simple”  articles on the use of a low carb or ketogenic diet for weight loss, as well as to significantly improve and even reverse the symptoms of Type 2 Diabetes, high cholesterol and other metabolic-related symptoms, please  click here.

You can follow me at:

 https://twitter.com/lchfRD

  https://www.facebook.com/lchfRD/


Copyright ©2018 The LCHF-Dietitian (a division of BetterByDesign Nutrition Ltd.) 

LEGAL NOTICE: The contents of this blog, including text, images and cited statistics as well as all other material contained here (the ”content”) are for information purposes only.  The content is not intended to be a substitute for professional advice, medical diagnosis and/or treatment and is not suitable for self-administration without the knowledge of your physician and regular monitoring by your physician. Do not disregard medical advice and always consult your physician with any questions you may have regarding a medical condition or before implementing anything  you have read or heard in our content

Concerns with Polyunsaturated Vegetable Oils – Part 2

This article is Part 2 in a two-part series on concerns with Polyunsaturated Vegetable Oils.Part 1 can be read here.

There are a few key things about polyunsaturates vegetable oils that need to be understood to understand this article, so I’ll keep the science simple.

There are two class of polyunsaturated fats; (PUFAs); omega 3 (ρ‰-3 also written n-3) and omega 6 (ρ‰-6 / n-6) which compete with each other for enzymes, and which becomes significant at one branch point (marked with the red and green box).

At that junction point (where the red box is at Arachidonic acid and green box is at Eicosapentanoic acid) if there is more n-6 fats than n-3 fats, then the pathway will favour the n-6 pathway. If there are more n-3 fats than n-6 fats, then the pathway will favour the n-3 pathway. The issue, as I will elaborate on below, is that in the Western diet, the n-6 pathway is always favoured.

Of significance, the n-6 polyunsaturated fats are pro-inflammatory and the n-3 polyunsaturated fats are anti-inflammatory. This is important to understand why eating lots of foods high in n-6 fats can lead to health consequences.

When people take low-dose Aspirin® for example, to lower the risk of heart attack or stroke, it acts on Arachidonic acid in the n-6 polyunsaturated fat pathway, to keep it from making certain inflammatory products that can lead to heart attack or stroke.

In our evolutionary history it was thought that n-6 fats (from nuts and seeds that were gathered in the wild) and n-3 fats (from the fish and meat we hunted) were eaten in close to a 1:1 ratio – providing the two essential fatty acids from both classes. When man began domesticating grain and growing beans and lentils and nuts and seeds for food (all high in n-6 fats), the shift towards a diet higher in n-6 fats occurred. The modern Western diet is estimated to have an omega-6 to omega-3 fatty acids of 15—20:1 in favour of n-6 fats [6].

Many people take omega-3 fish oil capsules in an effort to protect their body from inflammation, but because the amount of n-6 fats in the diet is so much higher than the amount of n-3 fats, the n-6 pathway is still favoured.

Unless we significantly lower the amount of n-6 fats in the diet, taking fish oil doesn’t really help as the n-6 pathway will always be favoured.

Changing the Makeup of Cell Components

Industrial seed oils have very high levels of linoleic acid which is at the top of the n-6 pathway.  These industrial seed oils are pro-inflammatory and will elongate to Arachidonic acid, resulting in many pro-inflammatory products being produced.

When we eat a lot of food made with soybean oil or fried in soybean oil we eat way more linoleic acid then our body has evolved to handle.

A major problem with polyunsaturated fatty acids such as linoleic acid are that they are very unstable fats that are easily oxidized (similar to a fat becoming ‘rancid’ or a metal ‘rusting’). Even if we never buy these industrial seed oils to cook with at home, when we buy French fries at restaurants they are fried in either soybean or canola oil. When we pick up a donuts, same thing.  Bottle salad dressing and mayonnaise (even the one that is called ‘olive oil mayonnaise’) are made with one of these industrial seed oils. These oils are found in products one would never expect to find them, including peanut butter! Start reading labels and you will be shocked how many products they are in – or rather, how few products they are NOT in.

Industrial seed oils are in most of the prepared food we buy and almost all of the food we eat out in fast-food restaurants.

According to a 2011 journal article published in the American Journal of Clinical Nutrition;

“The most striking modification of the US food supply during the 20th century was the >1000-fold increase in the estimated per capita consumption of soybean oil from 0.006% to 7.38% of energy.” [7]

When the linoleic acid content of the diet is high because we are eating foods made with industrial seed oils, important components of our cells membranes incorporate higher amount of linoleic acid into them.

For example, cardiolipin is a phospholipid component found in the inner mitochondrial membrane, which is where all energy metabolism in our body occurs. Cardiolipin plays an important role in the function of several enzymes involved in mitochondrial energy metabolism.

When we eat a lot of pre-made and processed foods and food made in fast-food restaurants, cardiolipin ‘s fatty acid content becomes 90% linoleic acid, making it easily oxidized, affecting its function. If the diet is high in coconut oil and olive oil, cardiolipin will be higher in stearic and oleic acids and these fats are more stable fats than linoleic acid.

Literally, we are what we eat!

Cooking with Industrial Seed Oils

When industrial seed oils are heated such as they are in the making of commercial foods using them, they undergo rapid oxidation which means that they react with oxygen in the air to form toxic substances, including aldehydes and lipid peroxides.  Aldehydes are known neurotoxins and carcinogens, and are documented to contribute to DNA mutations, inflammation and hypersensitivity [8].

Heating polyunsaturated vegetable oils for just 20 minutes produces 20 times the permitted levels of aldehydes recommended as a maximum limit by the World Health Organization [8].

Keep in mind that at fast-food restaurants and in the preparation of commercial donuts and other fried food products, these industrial seed oils are used for frying everything from French fries to donuts and are heated over and over for extended periods of time, creating alarming levels of aldehydes and lipid peroxidation products.

When heated, industrial seed oils produce oxidized metabolites known as oxidized linoleic acid metabolites (OXLAMs) which have been also been implicated in the development of non-alcoholic fatty liver disease (NAFLD)[9].

In the body cell components such as cardioleptin with high amounts of linoleic acid are easily oxidized producing an oxidation product known as 4-hydroxynonenal (4-HNE) which has been implicated in the development of cancer [10].

Increasing Appetite

The high linoleic acid content of industrial seed oils also act on two endo-cannibinoids in the body (2-AG and Anandamide) which results in us feeling hungry, even when we have recently eaten –  in much the same way as cannabis (marijuana) does [11-12].  As a result, these industrial seed oils are believed to contribute to obesity and the associated health risks such as Type 2 Diabetes and high blood pressure.

Final Thoughts…

For fifty years, the public ate industrially-created trans fats in place of natural saturated fats and we only found out later that they were a major contributor to heart disease.

For the last forty years we have been eating industrial seed oils in greater and greater quantities place of natural saturated fat, but (a) given how these industrial seed oils are produced (solvents, high heats for extended period of time, bleach, etc.) and (b) given what is known about the very toxic products they produce when heated in production and how they are oxidized in the body and oxidized through heating when cooking, it is warranted to be very cautious about eating prepared foods made with them.

To avoid these industrial seed oils will take a concerted effort as they are in virtually everything we buy ready-made and many of the foods we eat out, but one solution is to cook real food using healthy sources of fat and to avoid these industrial seed oils that were created and marketed to us as supposedly healthy substitutes for natural fats.

The butter, lard and tallow of years gone by were made from animals that were pasture raised, not fed soybeans and corn as commercial animals are now, but in light of the mounting number of studies that indicate that saturated fat is not associated with increased risk of cardiovascular disease, perhaps it might be preferable to buy grass fed butter or render tallow or lard from the fat of pasture-raised animals for some cooking applications – rather than use these industrial seed oils that were created as substitutes.  Butter, lard and coconut oil (a vegetarian saturated fat) are all very low in linoleic acid and thus are very stable.  They are not easily oxidized in the body or by heating and produce very low levels of aldehyde and lipid peroxidation products when heated, compared with many of the industrial seed oils.

These are all factors we need to consider when deciding which fats our food should be made with.

The chart below shows the linoleic content of some common fats in blue.  Keep in mind that fats with the smallest amount of linoleic acid are the most stable and the least prone to oxidation (either in the body or when heated).

Comparison of Dietary Fats – linoleic acid content

A personal note: For non-heating uses, I use natural sources of monounsaturated fat such as cold pressed macadamia nut oil, hazelnut oil, avocado oil, and extra virgin olive oil and for cooking and heating uses I use a mixture of olive oil and coconut oil (to raise the smoke point), clarified butter (ghee) at higher temperatures and butter at lower temperatures and for baking. I read labels of all products I buy and deliberately avoid purchasing any food products that contain soybean oil, canola oil or sunflower oil and when I eat out, I ask that my food be prepared with coconut oil, butter or ghee.

While the jury is still “out” when in comes to saturated fat, it is my opinion that with the mounting evidence that eating saturated fat does not contribute to heart disease, using moderate use of butter, ghee (clarified butter) and coconut oil seems to me to be a more acceptable risk than eating foods made with, or fried in industrial seed oils.

I trust having the information contained in this article will help you make an informed choice for yourself and for those you cook for.

If you have questions about how I might be able to help you follow a low carb lifestyle -including selecting appropriate fats for use in your own cooking, please feel free to send me a note using the “Contact Me” form located on the tab above.

You can follow me at:

 https://twitter.com/lchfRD

  https://www.facebook.com/lchfRD/

References

(continued from Part 1)

6. A.P. Simopoulos, Evolutionary aspects of the dietary omega-6:omega-3 fatty acid ratio: medical implications,World Rev Nutr Diet, 100 (2009), pp. 1-21

7. Tanya L Blasbalg, Joseph R Hibbeln, Christopher E Ramsden, Sharon F Majchrzak, Robert R Rawlings; Changes in consumption of omega-3 and omega-6 fatty acids in the United States during the 20th century, The American Journal of Clinical Nutrition, Volume 93, Issue 5, 1 May 2011, Pages 950—962.

8. Grootvelt M, Rodada VR, Silwood CJL, Detection, monitoring, and
deleterious health effects of lipid oxidation products generated in culinary oils during thermal stressing episodes, Lipid Oxidation, November/December 2014, Vol. 25 (10)

9. Maciejewska, Dominika & Ossowski, Piotr & Drozd, Arleta & Karina, Ryterska & Dominika, Jamioł & Banaszczak, Marcin & Małgorzata, Kaczorowska & Sabinicz, Anna & Wyszomirska, Joanna & Stachowska, Ewa. (2015). Metabolites of arachidonic acid and linoleic acid in early stages of non-alcoholic fatty liver disease-A pilot study. Prostaglandins & other lipid mediators.

10. Zhong H, Yin H. Role of lipid peroxidation derived 4-hydroxynonenal (4-HNE) in cancer: Focusing on mitochondria. Redox Biology. 2015;4:193-199. doi:10.1016/j.redox.2014.12.011.

11. Alvheim AR, Malde MK, Hyiaman DO et al; Dietary Linoleic Acid Elevates Endogenous 2-AG and Anandamide and Induces Obesity, Obesity (2012) 20;1984-1994

12. Alveim AR, Torstensen BE, Lin YH et al, Dietary Linoleic Acid Elevates the Endocannabinoids 2-AG and Anandamide and Promotes Weight Gain in Mice Fed a Low Fat Diet, Lipids (2014) 49:59—69


Copyright ©2018 LCHF-Dietitian (a division of BetterByDesign Nutrition Ltd.)

LEGAL NOTICE: The contents of this blog, including text, images and cited statistics as well as all other material contained here (the ”content”) are for information purposes only.  The content is not intended to be a substitute for professional advice, medical diagnosis and/or treatment and is not suitable for self-administration without the knowledge of your physician and regular monitoring by your physician. Do not disregard medical advice and always consult your physician with any questions you may have regarding a medical condition or before implementing anything  you have read or heard in our content.

Concerns with Polyunsaturated Vegetable Oils – Part 1

INTRODUCTION: Both the US and Canadian Dietary Guidelines encourage us to limit saturated fat in order to reduce the risk of heart disease and to eat unsaturated fat, including polyunsaturated fats and oils instead but what are these fats, where do they come from and what role might these play in development of obesity, Type 2 Diabetes, non-alcoholic fatty liver disease and even cancer?  This article is part 3 in the series titled Bad Fats and Enduring Beliefs.

Part 1 titled the Vilification of Saturated Fat can be read here and Part 2 titled Saturated Fat and Heart Disease can be read here.

“Polyunsaturated vegetable oils” is really a misnomer, as neither soybeans nor rapeseed / Canola are “vegetables”.  More accurately these should be called “industrial seed oils”, as they are seed crops that have been deliberately engineered for food use.  These are created oil products which are quite unlike natural oils that can be easily expressed from nuts, seeds and fruit using a millstone, as has been done since the Bronze Age [1].

Image result for ancient olive press
Ancient olive oil press

If you simply press olives, almonds, sesame or poppy seeds between your fingers you will be able to express a little bit of their oil on your fingers.

Not so with soybeans!

You can squeeze a soybean as hard as you like and for as long as you like and you are not going to get any oil out of it!

The first attempt at trying to express oil from soybeans occurred in the United States, a few years after the creation of Crisco® shortening in 1911.  For 3 long years (1922 – 1925) scientists tried over and over again to extract oil from soybeans  imported from Manchuria using hydraulic presses,  and time and time again they failed. Finally, in 1925 scientists turned to the use of chemical solvents  to get oil from soybeans and solvent extraction of soybean oil has been used ever since.

Trans Fats and Industrially Produced Shortening

In days gone by, deep-fat frying in restaurants (e.g. for French fries) was done in beef tallow, sometimes in lard. Pastry crusts were made with lard or butter, and baked goods such as cakes and brioches were usually made with butter – that is until 1911 when Crisco® shortening was invented. When it was noticed that hardened cottonseed oil used in the soap-making industry had an appearance like lard, scientists decided to further process it to remove the strong odor inherent with cottonseed oil, and market it to housewives as the ‘modern’ way to bake. You can read more about that here.

Beginning in the 1950s, trans fats (which occurs naturally in very small quantities) were industrially produced from other industrial seed oils such as soybean oil for use in other natural fat substitutes, including  margarine, fat for commercial baked goods and fat for deep-fat frying in the fast food industry [2]. Unfortunately, it was only in the late 1990s and early 2000s that it became widely-accepted by the scientific community that eating foods made with trans fats or fried in trans fats raised LDL-cholesterol while lowering protective HDL cholesterol, and also raised triglycerides; promoting systemic inflammation and contributing to the development of heart disease.

How ironic that the fats that were created to replace naturally-occurring saturated fats ended up being so detrimental to health!

After trans fats were discontinued due to their adverse health effects, industrial seed oils such as soybean oil and canola oil became the number one and number two oils of the food industry. These unsaturated (liquid) industrial seed oils have replaced saturated (solid) trans fat industrial oils in our food supply, however there is considerable evidence emerging which should cause us to question whether these fats are any safer (more on that below).

The Created Market for Industrial Seed Oils

The market for industrial trans fats and liquid industrial seed oils was itself created based a belief that ‘dietary saturated fat led to heart disease’.  Much  of what we have come to believe about this originated with a pathologist named Ancel Keys who proposed his ‘diet-heart hypothesis’ in the 1950s.

In 1970, Keys published his “Seven Country  Study” that reported that populations that consumed large amounts of saturated fats in meat and dairy had high levels of heart disease but when data from 22 countries that was available since 1957 was plotted, it was a great deal more scattered, indicating a much weaker association than Keys’ Seven Country  Study data indicated.

In August of 1967, Stare, Hegsted and McGandy, 3 Harvard researchers paid by the sugar industry published their reviews in the New England Journal of Medicine which vindicated sugar as a contributor of heart disease and laid the blame on dietary fat and in particular, saturated fat and dietary cholesterol (previous article on that topic here). Sponsorship of this research by the sugar industry certainly casts a dark shadow over their findings.

These 3 researchers insisted in their conclusion that there was a link between dietary cholesterol and heart disease and that there was “major evidence” which suggested that there was “only one avenue for diet to contribute to hardening of the arteries and the development of heart disease”,  but as covered in the previous article, it is known that a year after their publications (1968), the report of the Diet-Heart Review Panel of the National Heart Institute made the recommendation that a major study be conducted to determine whether changes in dietary fat intake prevented heart disease because such a study had not yet been done.

Just 10 years after the sugar industry paid Stare, Hegsted and McGandy to write their reviewsHegsted was directly involved with developing and editing the 1977 US Dietary Guidelines which recommended that Americans decrease intake of saturated fat and cholesterol and increase dietary carbohydrate – entrenching the belief that saturated fat caused heart disease into American public health policy. That same year (1977), based on the same body of literature, Canada adopted very similar dietary guidelines around saturated fat…and the rest is history.

Public Health Policy Based Rooted in a Belief

For the last forty years Americans and Canadians have shunned natural fats such as butter, cream and lard in place of man-made margarine, non-dairy creamer and Crisco® – all in the enduring belief that ‘saturated fat is “bad” and leads to heart disease’.  Given that published reports vilifying saturated fat were funded by the sugar industry and that Ancel Keys study left out 2/3 of the nutrition and health data available at the time, it has become evident that public health policy was founded on what is now questionable data.

In addition, more and more current peer-reviewed published studies are concluding that saturated fat is not associated with an increased risk of developing cardiovascular disease. In the recent article titled Saturated Fat and Heart Disease, I outlined the findings of 8 recent meta-studies and systematic reviews and one worldwide epidemiological study which call into question the enduring belief that dietary saturated fat increases the risk of developing heart disease.

In a follow up to the above article, titled More Animal Fat Consumption Less Cardiovascular Disease, I also summarize the findings of a newly published worldwide study which found that total fat and animal fat consumption were least associated with the risk of cardiovascular disease.

If saturated fat is not associated with increased risk of heart disease then should we be eating industrial seed oils that were created and marketed as a replacement for them?

Creation of Industrial Seed Oils

Inexpensive soybean oil has been the leading oil used in food production in the United States since 1945 [3]. It was previously made into a hard fat through hydrogenation and sold to consumers as trans-fat based shortening and margarine and came into wide-spread use as both synthetic hard fat and as a food-based oil product in the late-1960s.

In Canada, soybean oil is just behind canola oil in terms of the most used, and canola is another industrial seed oil that was created by science. In 1978 rapeseed, a prairie weed was specially bred in Canada to produce a novel plant that was lower in erucic acid (a toxin found in rapeseed) and this new plant was named “canola” (‘Canadian Oil’).

A 2015 study on Canadian vegetable oil purchased and eaten in Canada found that in 2013, 42% was canola oil (a Canadian bio-engineered industrial seed oil) and 20% was soybean oil, an industrially-engineered seed oil developed in the US [4]. Keep in mind this figure excludes food products available in Canada that are manufactured in the US, which uses predominantly soybean oil.

Soybean Oil is a Modern, Industrial Product

According to an article titled “Soybeans Are Ancient; Oil Is Not” published in the Wall Street Journal in 2011 [5], soybeans as the basis for tofu and soy sauce is an ancient food in China, but soybean oil was virtually unknown until global food oil shortages during World War I created an interest to extract the fatty part of the soybean for oil. Soybean oil is a modern creation.

How is oil made from seeds such as soybean and canola?

“Soybeans are first crushed into crude oil and then refined to remove impurities like free fatty acids. Over days, the crude is ”neutralized” of acidity with phosphoric acid, ”winterized” through filters that remove wax, bleached at high heat to lighten the color and finally vacuum ”deodorized” to eliminate impurities.” [5]

The extraction of soybean oil involves the industrial processing of soybeans with solvents at very high heats over an extended length of time in order to have the soybean give up its small amount of oil.

Solvent extraction of canola oil occurs in a similar method, beginning with an hour or more ‘wash’ of the rapeseed with a hexane solvent, then a sodium hydroxide wash. Bleach is then used to lighten the cloudy color of the processed oil and then it is steamed injected at high temperatures to
remove the bitter smell.

Yummy! Now this oil is ready to sell to the public to cook with and eat!

Should we even be eating these industrial seed oils?

Are they any safer than trans fats that were approved for consumption for 50 years and later found to contribute to heart disease?

Part 2 of this article will continue in Concerns with Polyunsaturated Vegetable Oils – Part 2.

If you have questions about how I might be able to help you follow a low carb lifestyle -including selecting appropriate fats for use in your own cooking, please feel free to send me a note using the “Contact Me” form located on the tab above.

To our good health,

Joy

You can follow me at:

 https://twitter.com/lchfRD

  https://www.facebook.com/lchfRD/

References

  1. Alfred Thomas (2002). “Fats and Fatty Oils”. Ullmann’s Encyclopedia of Industrial Chemistry. Weinheim: Wiley-VCH.
  2. “Tentative Determination Regarding Partially Hydrogenated Oils”. Federal Register. 8 November 2013. 2013-26854, Vol. 78, No. 217.
  3. Dutton, HJ. Journal of the American Oil Chemists Society, Vol. 58, No.3 Pages: 234-236 (1981),  https://pubag.nal.usda.gov/pubag/downloadPDF.xhtml?id=26520&content=PDF
  4. Schaer, L., Grainews, Canola gets competition from soybeans, Feb 01, 2016, https://www.grainews.ca/2016/02/01/canola-gets-competition-from-soy/
  5. Wall Street Journal, “Soybeans Are Ancient; Oil Is Not”, 2011, https://blogs.wsj.com/chinarealtime/2011/01/03/soybeans-are-ancient-oil-is-not/

Copyright ©2018 The LCHF-Dietitian (a division of BetterByDesign Nutrition Ltd.) 

LEGAL NOTICE: The contents of this blog, including text, images and cited statistics as well as all other material contained here (the ”content”) are for information purposes only.  The content is not intended to be a substitute for professional advice, medical diagnosis and/or treatment and is not suitable for self-administration without the knowledge of your physician and regular monitoring by your physician. Do not disregard medical advice and always consult your physician with any questions you may have regarding a medical condition or before implementing anything  you have read or heard in our content.

Special thanks to Tucker Goodrich for getting me thinking in this regard.


New Study – More Animal Fat Consumption less cardiovascular disease

INTRODUCTION: A brand new study published last week in Nutrients looked at health and nutrition data from 158 countries worldwide and found that total fat and animal fat consumption were least associated with the risk of cardiovascular disease. As well, the study found that high carbohydrate consumption, particularly as cereals and wheat was most associated with the risk of cardiovascular disease. Significantly, both of these relationships held up regardless of a nation’s average national income.

Data from this study adds to the mounting evidence from 8 recent meta-analyses and systemic reviews of randomized control trials (RCT) summarized in this article that did not find an association between  saturated fat intake and the risk of heart disease[1-8]. It also supports evidence from the recent global PURE (Prospective Urban and Rural Epidemiological) study published in The Lancet this past December which found that those who ate the largest amounts of saturated fats had significantly reduced death rates, and that those that ate the lowest amounts of saturated fat (6-7% of calories) had increased risk of stroke [9].

Global Correlates of Cardiovascular Risk: a comparison of 158 Countries

This new study compared the average intake of 60 food items with obesity rates and life expectancy in 158 countries and found that a relationship existed between eating specific foods and raised blood pressure, death from cardiovascular disease and raised blood glucose (high blood sugar) — all of which are associated with cardiovascular disease.  The study examined nutritional data from  1993-2011 and found that total fat consumption and animal fat consumption were the dietary factors least associated with the risk of cardiovascular disease and that high carbohydrate consumption, especially as cereals and wheat was the dietary factor most associated with the risk of cardiovascular disease [10].

These findings add to the mounting evidence which calls into question whether dietary saturated fat is related to heart disease.

Total Cholesterol and Cardiovascular Risk

The present study found that eating animal fat and animal protein raised total cholesterol, however total fat and animal protein consumption were found to have a very impressive negative relationship with cardiovascular death in the European data, and a moderately negative relationship to cardiovascular death, worldwide. That is, the more total fat and animal protein eaten, the lower cardiovascular death rates were.

Often in studies,  the assumption is that high LDL is linked to risk of cardiovascular disease – not that there is a direct relationship between animal / saturated fat and cardiovascular disease.  That is, high LDL is a surrogate marker of cardiovascular disease. But does that assumption hold weight?

Perhaps a better question is “which LDL”? Small, dense LDL cholesterol  which easily penetrates the artery wall is associated with heart disease [11,12,13,14], but the large, fluffy LDL cholesterol is not [15,16], so studies seeking to impute LDL as the cause of cardiovascular diseasee need to differentiate between these LDL particles.

As well, total cholesterol is made up of the different sub-particles of LDL cholesterol, HDL cholesterol, VLDL cholesterol and triglycerides (TG), so lumping them all in together as ‘total cholesterol’ doesn’t tell us anything about risk of cardiovascular disease. We know that dietary saturated fat consistently raises the ”good” HDL-cholesterol — which moves cholesterol away from the arteries and back to the liver where it can either be re-used or eliminated [17,18], so higher saturated fat intake will raise “good” HDL cholesterol, which in turn will raise total cholesterol. Total cholesterol going up is not a ‘bad’ thing.

What is important is not that total cholesterol went up but that along with increased total cholesterol, cardiovascular disease went down.

Higher Blood Sugar Associated with Higher Consumption of Cereals and Wheat

One finding of this study was that higher blood sugar (a known risk factor for cardiovascular disease) was most strongly associated with indicators of obesity such as high body mass index (BMI). What was new however is that higher consumption of cereals, especially cereals and wheat was associated with higher cardiovascular disease.

Researchers remarked that such results were not surprising “because the links between raised blood glucose, obesity, type 2 diabetes and cardiovascular disease are well established [19]”.

“…regardless of the statistical method used, the results always show very similar trends and identify high carbohydrate consumption (mainly in the form of cereals and wheat, in particular) as the dietary factor most consistently associated with the risk of CVDs.

High carbohydrate consumption, particularly as cereals and wheat was the dietary factor most consistently associated with the risk of cardiovascular disease.

Researchers looked at a maximum number of potentially significant variables and compared them to results across different regions and time periods and while they acknowledged that the accuracy of the data from developing countries may be lower, the global results that they found confirmed their earlier 2016 study data from European data only which found a significant link between cardiovascular disease and high carbohydrate consumption [20].

Of significance, the above associations held up regardless of a nation’s average national income.

Given these finding support those of the PURE epidemiological study [9] would lend support the notion that one can compare data between countries of substantially different level of income (as the PURE study did) and that high-carbohydrate and low-fat diets are not necessarily associated with poverty, as claimed [21].

The PURE study findings and those of this present study challenge the very basis of the long-standing ‘diet-heart hypothesis’ and it certainly results in some uncertainty as to what constitutes a healthy diet.

In my view, what is needed are some well-designed randomized controlled trials to determine if saturated fat intake is directly associated with cardiovascular disease – and not associated with a surrogate marker, such as LDL cholesterol.

Purported Weakness of the Data

Self-reported food-frequency questionnaires on which this study is based have long been criticized as being unreliable, however it is important to note that in the United States the NHANES Dietary Data and the Continuing Survey of Food Intakes by Individuals (USA) has also collected data using food-frequency questionnaires and such data is used as the “cornerstone to inform nutrition and health policy” [22].

In Canada, the Canadian Community Health Survey (CCHS) relies on a 24-hour recall data which is known to researchers to result in under-reporting of food intake, especially among those with a high BMI and with adolescents [23].  Given that the 2017 Obesity Update found Canada among its most overweight countries — with 25.8% of the population aged 15 and over considered obese [24], the CCHS data becomes less and less reliable, as obesity rates continue to climb.

Enduring Belief – despite recent evidence

The results of this most recently published study embody the same findings as the recent global PURE (Prospective Urban and Rural Epidemiological) study [9] publish this past December in The Lancet which found a link between raised cholesterol and lower cardiovascular risk.

This study also confirms the findings of the eight recent meta-analysis and systemic reviews of randomized control trials (RCT) summarized in the previous article which did not find an association between saturated fat intake and the risk of heart disease [1-8].

Yet, in spite of recent robust evidence there is an enduring belief that ‘saturated fat causes heart disease’ — a belief which has influenced nutrition guidelines in both the US and Canada for 40 years (since 1977).

As elaborated on in a recent article, it is now known that the ‘diet-heart hypothesis’ originated by Ancel Keys and supposedly confirmed in his ‘Seven Countries Study’ omitted known data from 22 available countries  and that when all countries were factored in there was a great deal more scatter showing a much weaker relationship between dietary fat and death by coronary heart disease than was suggested by Keys’s data.

Also as covered previously, it has been known since December 2016 that the three Harvard researchers who vindicated sugar as the cause of heart disease and blamed dietary fat — were funded by the sugar industry and that one one of those 3 researchers, Dr. DM Hegsted contributed to and edited the 1977 US Dietary Guidelines which embodied his findings of 10 years earlier, advising Americans to reduce their intake of saturated fat and cholesterol in order to reduce their risk of heart disease.

Also covered in a previous article, Canadian Dietary Recommendations regarding dietary intake of saturated fat were based on ‘health claim assessments’ conducted by Health Canada in 2000 (18 years ago) titled Dietary Fat, Saturated Fat, Cholesterol, Trans Fats and Coronary Heart Disease which was based on the US literature available from 1993-2000 and which concluded that a health risk exists between saturated fat and heart disease.

Given all of the factors mentioned above, it is my conviction that before the American and Canadian governments revise their respective national Dietary Guidelines what is needed is for them to conduct a long-overdue external, independent scientific review of the current evidence for the enduring belief that saturated fat contributes to heart disease.

If you have questions as to how I can help you live a low carb lifestyle, please send me a note using the “Contact Me” form located on the tab above.

To our good health,

Joy

You can follow me at:

 https://twitter.com/lchfRD

  https://www.facebook.com/lchfRD/

References

  1. Skeaff CM, PhD, Professor, Dept. of Human Nutrition, the University of Otago, Miller J. Dietary Fat and Coronary Heart Disease: Summary of Evidence From Prospective Cohort and Randomised Controlled Trials, Annals of Nutrition and Metabolism, 2009;55(1-3):173-201
  2. Hooper L, Summerbell CD, Thompson R, Reduced or modified dietary fat for preventing cardiovascular disease, 2012 Cochrane Database Syst Rev. 2012 May 16;(5)
  3. Chowdhury R, Warnakula S, Kunutsor S et al, Association of Dietary, Circulating, and Supplement Fatty Acids with Coronary Risk: A Systematic Review and Meta-analysis, Ann Intern Med. 2014 Mar 18;160(6):398-406
  4. Schwingshackl L, Hoffmann G Dietary fatty acids in the secondary prevention of coronary heart disease: a systematic review, meta-analysis and meta-regression BMJ Open 2014;4
  5. Hooper L, Martin N, Abdelhamid A et al, Reduction in saturated fat intake for cardiovascular disease, Cochrane Database Syst Rev. 2015 Jun 10;(6)
  6. Harcombe Z, Baker JS, Davies B, Evidence from prospective cohort studies does not support current dietary fat guidelines: a systematic review and meta-analysis, Br J Sports Med. 2017 Dec;51(24):1743-1749
  7. Ramsden CE, Zamora D, Majchrzak-Hong S, et al, Re-evaluation of the traditional diet-heart hypothesis: analysis of recovered data from Minnesota Coronary Experiment (1968-73), BMJ 2016; 353
  8. Hamley S, The effect of replacing saturated fat with mostly n-6 polyunsaturated fat on coronary heart disease: a meta-analysis of randomised controlled trials, Nutrition Journal 2017 16:30
  9. Dehghan M, Mente A, Zhang X et al, The PURE Study – Associations of fats and carbohydrate intake with cardiovascular disease and mortality in 18 countries from five continents (PURE): a prospective cohort study. Lancet. 2017 Nov 4;390(10107):2050-2062
  10. Grasgruber P, Cacek J, Hrazdira E, et al, Global Correlates of Cardiovascular Risk: A Comparison of 158 Countries, Nutrients 201810(4), 411.
  11. Tribble DL, Holl LG, Wood PD, et al. Variations in oxidative susceptibility among six low density lipoprotein subfractions of differing density and particle size. Atherosclerosis 1992;93:189—99
  12. Gardner CD, Fortmann SP, Krauss RM, Association of Small Low-Density Lipoprotein Particles With the Incidence of Coronary Artery Disease in Men and Women, JAMA. 1996;276(11):875-881
  13. Lamarche B, Tchernof A, Moorjani S, et al, Small, Dense Low-Density Lipoprotein Particles as a Predictor of the Risk of Ischemic Heart Disease in Men, 
  14. Packard C, Caslake M, Shepherd J. The role of small, dense low density lipoprotein (LDL): a new look, Int J of Cardiology,  Volume 74, Supplement 1, 30 June 2000, Pages S17-S22
  15. Genest JJ, Blijlevens E, McNamara JR, Low density lipoprotein particle size and coronary artery disease, Arteriosclerosis, Thrombosis, and Vascular Biology. 1992;12:187-195
  16. Siri-Tarino PW, Sun Q, Hu FB, Meta-analysis of prospective cohort studies evaluating the association of saturated fat with cardiovascular disease, The American Journal of Clinical Nutrition, Volume 91, Issue 3, 1 March 2010, Pages 502—509
  17. Mensink RP, Zock PL, Kester A, Effects of dietary fatty acids and carbohydrates on the ratio of serum total to HDL cholesterol and on serum lipids and apolipoproteins: a meta-analysis of 60 controlled trials, The American Journal of Clinical Nutrition, Volume 77, Issue 5, 1 May 2003, Pages 1146—1155
  18. Toth PP, The “Good Cholesterol” – High Density Lipoprotein, Circulation 2005;111:e89-e91
  19. Després, J.P.; Lemieux, I.; Alméras, N. Abdominal obesity and the metabolic syndrome. In Overweight and the Metabolic Syndrome; Springer: New York, NY, USA, 2006; pp. 137—152
  20. Grasgruber, P.; Sebera, M.; Hrazdira, E.; Hrebickova, S.; Cacek, J. Food consumption and the actual statistics of cardiovascular diseases: An epidemiological comparison of 42 European countries. Food Nutr. Res. 201660, 31694.
  21. Sigurdsson, AF, The Fate of the PURE Study — Fat and Carbohydrate Intake Revisited, Doc’s Opinion, October 16 2017,  www.docsopinion.com/2017/10/16/pure-study-fats-carbohydrates/
  22. Ahluwalia N, Dwyer J, Terry A, et al; Update on NHANES Dietary Data: Focus on Collection, Release, Analytical Considerations and Uses to Inform Public Policy, Advances in Nutrition, Volume 7, Issue 1, 1 January 2016, Pages 121—134
  23. Health Canada, Reference Guide to Understanding and Using the Data – 2015 Canadian Community Health Survey – Nutrition, June 2017
  24. OECD Health Statistics 2017, June 2017, http://www.oecd.org/els/health-systems/Obesity-Update-2017.pdf

Copyright ©2018 The LCHF-Dietitian (a division of BetterByDesign Nutrition Ltd.) 

LEGAL NOTICE: The contents of this blog, including text, images and cited statistics as well as all other material contained here (the ”content”) are for information purposes only.  The content is not intended to be a substitute for professional advice, medical diagnosis and/or treatment and is not suitable for self-administration without the knowledge of your physician and regular monitoring by your physician. Do not disregard medical advice and always consult your physician with any questions you may have regarding a medical condition or before implementing anything  you have read or heard in our content.

Saturated Fat and Heart Disease – Bad Fat Enduring Beliefs Part 2

This is Part 2 in the series which examines the enduring belief that dietary saturated fat causes heart disease.

INTRODUCTION: The ”diet-heart hypothesis” is the belief that saturated fat and dietary cholesterol cause heart disease was first proposed by Ancel Keys in the 1950s. He encouraged Americans to reduce their fat intake by a third, while at the same time openly admitted as late as 1967 that there was little direct evidence that a change in diet would reduce the risks of arteriosclerosis [1]. As covered in the first part of this article, three Harvard researchers, Stare, Hegsted and McGrady were paid generously by the sugar industry to publish their review in the New England Journal of Medicine vindicating sugar as a cause of heart disease and laying the blame squarely on dietary fat; and in particular on saturated fatThese researchers concluded that there was “only one avenue” by which diet contributed to the development and progression of “hardening of the arteries” (atherosclerosis), resulting heart disease and that was due to how much dietary cholesterol people ate and its effect on blood lipids [2].  This sounds like a very certain claim, however it is known that they lacked evidence because a year later (1968) a report from the Diet-Heart Review Panel of the National Heart Institute made the recommendation that a major study be conducted to determine whether changes in dietary fat intake prevented heart disease – because such a study had not yet been done (see Part 1) [3].

Fast forward ten years and in 1977, one of the three researchers who was paid by the sugar industry, Dr. DM Hegsted contributed to and edited the 1977 US Dietary Guidelines [4], which embodied his findings 10 years earlier. Americans were told they should reduce their intake of saturated fat and cholesterol to reduce their risk of heart disease.

The rest, they say, is history.

The same year (1977), Canada’s Food Guide recommended that Canadians  limit fat to <30% of daily calories with no more than 1/3 from saturated fat, but did not specify an upper limit for dietary cholesterol. This was based on the belief that total dietary fat and saturated fat were responsible blood levels of LDL cholesterol levels and total serum cholesterol, not dietary cholesterol [5].

Recommendations for the continued restriction of dietary fat continued in both the US and Canada in 2015 are based on the enduring belief that lowering saturated fat in the diet will lower blood cholesterol levels and reduce heart disease.

The question is does it?

NOTE TO CANADIANS: Canadian Dietary Recommendations regarding dietary intake of saturated fat are based on ‘health claim assessments’ conducted by Health Canada which are directly tied to American research and recommendations.  Eighteen years ago, Health Canada reviewed the ‘health claim’ regarding Dietary Fat, Saturated Fat, Cholesterol, Trans Fats and Coronary Heart Disease and based on the US literature available from 1993-2000 and concluded that a health risk exists between saturated fat and heart disease, as stated here; “The effectiveness of lowering dietary saturated fat in reducing plasma cholesterol, especially low-density lipoprotein (LDL)- cholesterol, the major risk factor for CHD, is well established.” Since Health Canada’s review in 2000 (18 years ago), the link between dietary saturated fat and heart disease remains public health policy.

While it has been shown that saturated fats can raise LDL-cholesterol such a finding is meaningless unless it is specified which type of LDL-cholesterol  goes up. There is more than one type of LDL-cholesterol, small, dense LDL cholesterol which easily penetrates the artery wall is associated with heart disease [6,7,8,9], whereas the large, fluffy LDL cholesterol is not [10, 11].

Another factor that needs to be considered is that dietary saturated fat also consistently raises the ”good” HDL-cholesterol which moves cholesterol away from the arteries and back to the liver, where it can either be re-used or eliminated [12,13].

What are the findings of current scientific literature?

Eight recent meta-analysis and systemic reviews which reviewed evidence from randomized control trials (RCT) that had been conducted between 2009-2017 did not find an association between saturated fat intake and the risk of heart disease [14-21].

Furthermore, recently published results of the largest and most global epidemiological study published in December 2017 in The Lancet [23] found that those who ate the largest amount of saturated fats had significantly reduced rates of mortality and that low consumption (6-7% of calories) of saturated fat was associated with increased risk of stroke.

Here is a synopsis of the findings of the eight meta-analysis and systemic reviews;

”Intake of saturated fatty acids was not significantly associated with coronary heart disease mortality” and “saturated fatty acid intake was not significantly associated coronary heart disease events”

Skeaff CM, PhD, Professor, Dept. of Human Nutrition, the University of Otago, Miller J. Dietary Fat and Coronary Heart Disease: Summary of Evidence From Prospective Cohort and Randomised Controlled

“There were no clear effects of dietary fat changes on total mortality or cardiovascular mortality”.

Hooper L, Summerbell CD, Thompson R, Reduced or modified dietary fat for preventing cardiovascular disease, 2012 Cochrane Database Syst Rev. 2012 May 16;(5)

“Current evidence does not clearly support cardiovascular guidelines that encourage high consumption of polyunsaturated fatty acids and low consumption of total saturated fats.”

Chowdhury R, Warnakula S, Kunutsor S et al, Association of Dietary, Circulating, and Supplement Fatty Acids with Coronary Risk: A Systematic Review and Meta-analysis, Ann Intern Med. 2014 Mar 18;160(6):398-406

“The present systematic review provides no moderate quality evidence for the beneficial effects of reduced/modified fat diets in the secondary prevention of coronary heart disease. Recommending higher intakes of polyunsaturated fatty acids in replacement of saturated fatty acids was not associated with risk reduction.”

Schwingshackl L, Hoffmann G Dietary fatty acids in the secondary prevention of coronary heart disease: a systematic review, meta-analysis and meta-regression BMJ Open 2014;4

“The study found no statistically significant effects of reducing saturated fat on the following outcomes: all-cause mortality, cardiovascular mortality, fatal MIs (myocardial infarctions), non-fatal MIs, stroke, coronary heart disease mortality, coronary heart disease events.”

Note: The one significant finding was an effect for saturated fats on cardiovascular events however this finding lost significance when subjected to a sensitivity analysis (Table 8, page 137).

Hooper L, Martin N, Abdelhamid A et al, Reduction in saturated fat intake for cardiovascular disease, Cochrane Database Syst Rev. 2015 Jun 10;(6)

“Epidemiological evidence to date found no significant difference in CHD mortality and total fat or saturated fat intake and thus does not support the present dietary fat guidelines. The evidence per se lacks generalizability for population-wide guidelines.”

Harcombe Z, Baker JS, Davies B, Evidence from prospective cohort studies does not support current dietary fat guidelines: a systematic review and meta-analysis, Br J Sports Med. 2017 Dec;51(24):1743-1749

“Available evidence from randomized controlled trials (1968-1973) provides no indication of benefit on coronary heart disease or all-cause mortality from replacing saturated fat with linoleic acid rich vegetable oils (such as corn oil, sunflower oil, safflower oil, cottonseed oil, or soybean oil).”

Ramsden CE, Zamora D, Majchrzak-Hong S, et al, Re-evaluation of the traditional diet-heart hypothesis: analysis of recovered data from Minnesota Coronary Experiment (1968-73), BMJ 2016; 353

“Available evidence from adequately controlled randomised controlled trials suggest replacing saturated fatty acids with mostly n-6 PUFA is unlikely to reduce coronary heart disease events, coronary heart disease  mortality or total mortality. These findings have implications for current dietary recommendations.”

Hamley S, The effect of replacing saturated fat with mostly n-6 polyunsaturated fat on coronary heart disease: a meta-analysis of randomised controlled trials, Nutrition Journal 2017 16:30

Only one recent meta analysis conducted by the American Heart Association (by the authors of the Diet-Heart Policy for Americans, mentioned above) found a relationship between saturated fat intake and coronary heart disease, yet failed to examine cardiovascular mortality (death) or total mortality [22].

NOTE: In 1961, the American Heart Association was the author of the original policy paper recommending to limit saturated fats to protect against heart disease and therefore has a significant interest in defending its longtime institutional position.

With the exception of the American Heart Association review, the conclusion of 9 different meta-analysis and review papers of randomized control trials conducted by independent teams of scientists worldwide do not support the belief that dietary intake of saturated fat causes heart disease.


The PURE (Prospective Urban Rural Epidemiology) was the largest-ever epidemiological study and was published in The Lancet in December 2017 [23]. It recorded dietary intake in 135,000 people in 18 countries over an average of 7 1/2 years, including high-, medium- and low-income nations.  It found;

“High carbohydrate intake was associated with higher risk of total mortality, whereas total fat and individual types of fat were related to lower total mortality. Total fat and types of fat were not associated with cardiovascular disease, myocardial infarction, or cardiovascular disease mortality, whereas saturated fat had an inverse association with stroke. Global dietary guidelines should be reconsidered in light of these findings.”

Dehghan M, Mente A, Zhang X et al, The PURE Study – Associations of fats and carbohydrate intake with cardiovascular disease and mortality in 18 countries from five continents (PURE): a prospective cohort study. Lancet. 2017 Nov 4;390(10107):2050-2062

Those critical of the study say that it has methodological problems, including problems related to the authors dividing consumption of macronutrients (protein, fat and carbohydrate) into 4 groups (quintiles).  Some say that this is reason the data showed an inverse relationship between saturated fat and cardiovascular disease [24]. Criticisms also include that one cannot compare data between countries of substantially different level of income because “low fat consumption is very uncommon in high income countries” and that ‘the ability to afford certain foods may change the dietary pattern (e.g. high-carbohydrate and low-fat diets may be associated with poverty) [24].

Final thoughts…

Both the American and Canadian governments are currently in the process of revising their Dietary Guidelines and I feel that what is needed now is an external, independent scientific review of the current evidence-base for the belief that saturated fat contributes to heart disease.

Have questions or need support following a low carb lifestyle in a way that makes sense for you?

Please send me a note using the “Contact Me” tab above and I will reply shortly.

To our good health!

Joy

You can follow me at:

 https://twitter.com/lchfRD

  https://www.facebook.com/lchfRD/


References

  1. Keys A, Aravanis C, Blackburn HW et al. Epidemiological studies related to coronary heart disease: characteristics of men aged 40—59 in seven countries Acta Med Scand 1967 460: 1—392.
  2. McGandy, RB, Hegsted DM, Stare,FJ. Dietary fats, carbohydrates and atherosclerotic vascular disease. New England Journal of Medicine. 1967 Aug 03;  277(5):242—47
  3. The National Diet-Heart Study Final Report.” Circulation, 1968; 37(3 suppl): I1-I26. Report of the Diet-Heart Review Panel of the National Heart Institute. Mass Field Trials and the Diet-Heart Question: Their Significance, Timeliness, Feasibility and Applicability. Dallas, Tex: American Heart Association; 1969, AHA Monograph no. 28.
  4. Introduction to the Dietary Goals for the United States — by Dr D.M. Hegsted. Professor of Nutrition, Harvard School of Public Health, Boston, MASS., page 17 of 130, https://naldc.nal.usda.gov/naldc/download.xhtml?id=1759572&content=PDF
  5. McDonald BE, The Canadian experience: why Canada decided against an upper limit for cholesterol, J Am Coll Nutr. 2004 Dec;23(6 Suppl):616S-620S.
  6. Tribble DL, Holl LG, Wood PD, et al. Variations in oxidative susceptibility among six low density lipoprotein subfractions of differing density and particle size. Atherosclerosis 1992;93:189—99
  7. Gardner CD, Fortmann SP, Krauss RM, Association of Small Low-Density Lipoprotein Particles With the Incidence of Coronary Artery Disease in Men and Women, JAMA. 1996;276(11):875-881
  8. Lamarche B, Tchernof A, Moorjani S, et al, Small, Dense Low-Density Lipoprotein Particles as a Predictor of the Risk of Ischemic Heart Disease in Men, 
  9. Packard C, Caslake M, Shepherd J. The role of small, dense low density lipoprotein (LDL): a new look, Int J of Cardiology,  Volume 74, Supplement 1, 30 June 2000, Pages S17-S22
  10. Genest JJ, Blijlevens E, McNamara JR, Low density lipoprotein particle size and coronary artery disease, Arteriosclerosis, Thrombosis, and Vascular Biology. 1992;12:187-195
  11. Siri-Tarino PW, Sun Q, Hu FB, Meta-analysis of prospective cohort studies evaluating the association of saturated fat with cardiovascular disease, The American Journal of Clinical Nutrition, Volume 91, Issue 3, 1 March 2010, Pages 502—509
  12. Mensink RP, Zock PL, Kester A, Effects of dietary fatty acids and carbohydrates on the ratio of serum total to HDL cholesterol and on serum lipids and apolipoproteins: a meta-analysis of 60 controlled trials, The American Journal of Clinical Nutrition, Volume 77, Issue 5, 1 May 2003, Pages 1146—1155
  13. Toth PP, The “Good Cholesterol” – High Density Lipoprotein, Circulation 2005;111:e89-e91
  14. Skeaff CM, PhD, Professor, Dept. of Human Nutrition, the University of Otago, Miller J. Dietary Fat and Coronary Heart Disease: Summary of Evidence From Prospective Cohort and Randomised Controlled Trials, Annals of Nutrition and Metabolism, 2009;55(1-3):173-201
  15. Hooper L, Summerbell CD, Thompson R, Reduced or modified dietary fat for preventing cardiovascular disease, 2012 Cochrane Database Syst Rev. 2012 May 16;(5)
  16. Chowdhury R, Warnakula S, Kunutsor S et al, Association of Dietary, Circulating, and Supplement Fatty Acids with Coronary Risk: A Systematic Review and Meta-analysis, Ann Intern Med. 2014 Mar 18;160(6):398-406
  17. Schwingshackl L, Hoffmann G Dietary fatty acids in the secondary prevention of coronary heart disease: a systematic review, meta-analysis and meta-regression BMJ Open 2014;4
  18. Hooper L, Martin N, Abdelhamid A et al, Reduction in saturated fat intake for cardiovascular disease, Cochrane Database Syst Rev. 2015 Jun 10;(6)
  19. Harcombe Z, Baker JS, Davies B, Evidence from prospective cohort studies does not support current dietary fat guidelines: a systematic review and meta-analysis, Br J Sports Med. 2017 Dec;51(24):1743-1749
  20. Ramsden CE, Zamora D, Majchrzak-Hong S, et al, Re-evaluation of the traditional diet-heart hypothesis: analysis of recovered data from Minnesota Coronary Experiment (1968-73), BMJ 2016; 353
  21. Hamley S, The effect of replacing saturated fat with mostly n-6 polyunsaturated fat on coronary heart disease: a meta-analysis of randomised controlled trials, Nutrition Journal 2017 16:30
  22. Sachs FM, Lichtenstein AH, Wu JHW et al, Dietary Fats and Cardiovascular Disease: A Presidential Advisory From the American Heart Association,  Circulation. 2017 Jul 18;136(3)
  23. Dehghan M, Mente A, Zhang X et al, The PURE Study – Associations of fats and carbohydrate intake with cardiovascular disease and mortality in 18 countries from five continents (PURE): a prospective cohort study. Lancet. 2017 Nov 4;390(10107):2050-2062
  24. Sigurdsson, AF, The Fate of the PURE Study — Fat and Carbohydrate Intake Revisited, Doc’s Opinion, October 16 2017,  www.docsopinion.com/2017/10/16/pure-study-fats-carbohydrates/

Note: References 11-23 were from a document prepared by the Nutrition Coalition

Special thanks to Dr. Carol Loffelmann and Dr. Barbra Allen Bradshaw of The Canadian Clinicians for Therapeutic Nutrition for their tireless research.


Copyright ©2018 The LCHF-Dietitian (a division of BetterByDesign Nutrition Ltd.) 

LEGAL NOTICE: The contents of this blog, including text, images and cited statistics as well as all other material contained here (the ”content”) are for information purposes only.  The content is not intended to be a substitute for professional advice, medical diagnosis and/or treatment and is not suitable for self-administration without the knowledge of your physician and regular monitoring by your physician. Do not disregard medical advice and always consult your physician with any questions you may have regarding a medical condition or before implementing anything  you have read or heard in our content.


Low Carb Diets are not one size fits all

Some people imagine that a low carb lifestyle involves plates laden with bacon and eggs, huge steaks and meals devoid of vegetables, dairy foods, and nuts or seeds, but this is a misconception.

While there are individuals that choose to eat ”zero-carb” for a variety of personal reasons, it is not something I promote outside of being prescribed by a physician for therapeutic management of a specific medical condition.

I encourage people to eat a wide variety of low carb vegetables, some fruit and dairy products, as well as nuts and seeds — all of which have some carbohydrate in them. There is no one-size-fits-all low carb diet, but there are a few low carbohydrate approaches which can be chosen from depending on a person’s medical and metabolic conditions, any medications they may be taking, as well as stage of life and lifestyle factors.

Another fallacy is that low carb diets involve ”lots of meat for dinner” and “eggs every morning for breakfast” but people eating low carb can eat a wide variety of food for breakfast and meals can be vegetarian or pescatarian (include fish and seafood) and involve no meat whatsoever. This makes a low carb suitable for those that don’t eat meat or eggs for religious or ethical reasons.

Three main low carb approaches are;

(1) low carb higher protein

(2) low carb higher healthy fat

(3) higher protein / lower fat intake during weight loss, then a moderate protein / high healthy fat intake during weight maintenance.

What makes a low carb diet ketogenic is the low amount of carbohydrate that is eaten relative to the overall caloric intake, so not all low carb diets are ketogenic.

Low carbohydrate and therapeutic ketogenic diets have a variety of clinical applications. For example, a ketogenic diet may be prescribed by a person’s physician for management of epilepsy or seizure disorder, for treatment of some kinds of cancer, or for weight loss before and after bariatric surgery. Different types of low carb diets may be used for improving insulin sensitivity in Type 2 Diabetics or those with pre-diabetes, improving fatty liver disease, for reducing symptoms of Polycystic Ovarian Syndrome (PCOS) or for gradual weight loss.

[Another misconception is that low carb diets are used for ”rapid weight loss”, which is not the case.]

For each type of low carb diet the ratio of protein to fat is specific to the clinical condition and person’s requirements. Everybody’s macronutrient  needs (the amount of protein, carbs and fat they require) as well as overall energy needs are different and are dependent on several factors including their gender, age, height, weight, clinical conditions and any medications they’re taking.

Our body requires essential amino acids found in the protein foods we eat, as well as essential fatty acids found in the different types of fat we eat, along with essential vitamins and minerals however there is no essential requirement for dietary carbohydrate – provided that ”adequate amounts of protein and fat are consumed” (Dietary Reference Intakes for Energy, Carbohydrate, Fiber, Fat, Fatty Acids, Cholesterol, Protein and Amino Acids, 2005). This article will elaborate, but explaining it in simple terms, it means is that our body does not need to have carbohydrate in food if we eat sufficient protein with all the essential amino acids and sufficient fat with the essential fatty acids.

That doesn’t mean that I recommend that people without a clinical reason eat food with no carbohydrate in it (I don’t), as they wouldn’t be able to eat any vegetables, fruit, dairy, nuts or seeds – as these all of these have some carbohydrate in them.

I encourage people to eat a wide range of food from a variety of categories to ensure they have adequate dietary intake. I recommend whole, unprocessed foods that are naturally low in carbohydrate, including non-starchy vegetables, plant fats (such as olive oil, avocado oil, macadamia or walnut oil, coconut oil), low sugar fruit (such as tomato, lemon, lime, cucumber), meat, fish, poultry and seafood of all varieties, and small amounts of animal fat such as butter and cream.

If people working toward losing weight then the fat that is naturally found in meat is okay, but I would encourage them to trim excess visible fat. Unless there is a compelling reason not to, folks can add a bit of cream to their coffee or some butter on top of their cooked vegetables if they like it (especially if they’ll eat more veggies that way) but I don’t encourage people to ‘add fat’ to foods for the sake of adding fat (e.g. ‘bulletproof’ coffee or ‘fat bombs’).  That said, there is nothing intrinsically ‘dangerous’ about eating fat, even saturated fat but what needs to be considered is “how much” and “how often”.

High blood cholesterol and high triglycerides is the result of eating too much carbohydrate, not eating too much saturated fat, or dietary cholesterol.

A healthy person that eats more carbohydrate than their body can use will move the excess carbohydrate they eat off to their liver and will make triglyceride and LDL cholesterol and store the rest as fat.  A person who is insulin resistant or has Type 2 Diabetes may have high blood sugar levels but even if a person has normal blood sugar levels, their high carbohydrate intake may be reflected in their “cholesterol tests”.  Often what we see in such cases is high triglyceride results or high LDL cholesterol results or both. This easy-to-understand article titled Understand High Blood Sugar & High Cholesterol will explain the process in more detail. If eating excess carbohydrates continues for an extended period of time, it ‘s possible that non-alcoholic fatty liver disease (NAFL) may develop.

Each person’s ability to tolerate carbohydrate is different — depending whether they are insulin sensitive, insulin resistant or Type 2 Diabetic. Someone who is insulin sensitive for example can eat considerably more carbohydrate without causing a spike in their blood glucose level than someone who is insulin resistant. For those who are Type 2 Diabetic, both the degree of insulin resistance and the length of time they’ve been Type 2 Diabetic will affect the amount of carbohydrates they can tolerate. To explain this, I like to use the analogy of ‘lactose intolerance’.  Some people who are lactose intolerant can manage to drink and eat milk products, provided the quantities are small and the person doesn’t have it too often. Others who are lactose intolerant can’t even tolerate a small amount of lactose without symptoms. Ability to tolerate carbohydrate is similar.  People who are insulin sensitive or only mildly insulin resistance will be able to tolerate more carbohydrate than those who are very insulin resistant or have had Type 2 Diabetes a long time.

The average intake of carbohydrate in the Canadian diet is ~ 300 g per day, which is a lot. People who are insulin sensitive or mildly insulin resistance may do well lowering their carbohydrate amount to a moderate level whereas those who are insulin resistant or Type 2 Diabetic will likely need to eat considerably less carbohydrate in order to begin to see their blood sugar levels or cholesterol / triglyceride levels come down.

Factors that can affect how much carbohydrate a person can tolerate include gender, whether or not they are insulin sensitive or insulin resistant (and to what degree) and whether they have Type 2 Diabetes and if so, for how long.

What some people find challenging about deciding to follow a low carb lifestyle is knowing how much protein they need to eat, the amount and types of fat they can use, as well as the total amount of carbohydrate they can tolerate, as well as how those carbohydrates should best be distributed throughout the day.

Where it becomes particularly challenging is when people have Type 2 Diabetes or high blood pressure and are prescribed medications for these conditions.  In such cases, it’s not as simple as them just “cutting carbs” because by not doing so gradually it could result in a sudden drop in blood sugar or blood pressure which could be dangerous. People taking medications for these conditions (or for some other conditions) need to be monitored by their doctors and the reality is that not all doctors have more than a few minutes to see patients and may not feel equipped to counsel them on diet. This is where working with a Dietitian that’s knowledgeable and familiar with the use low carb diet is very helpful as they can coordinate dietary and lifestyle changes with your doctor while they monitor your health and adjusts the levels of prescribed medications, as needed.

Another situation where it can be very helpful to have a Dietitian’s support is when youth or teenagers need to lose weight, or bring down their blood sugar, cholesterol or blood pressure levels, because a there’s a need to ensure that they have adequate intake to support healthy growth.

Have questions?

Please send me an note using the “Contact Me” form on the tab above and I will reply as I am able.

To our good health!

Joy

You can follow me at:

 https://twitter.com/lchfRD

  https://www.facebook.com/lchfRD/


Copyright ©2018 The LCHF-Dietitian (a division of BetterByDesign Nutrition Ltd.) 

LEGAL NOTICE: The contents of this blog, including text, images and cited statistics as well as all other material contained here (the ”content”) are for information purposes only.  The content is not intended to be a substitute for professional advice, medical diagnosis and/or treatment and is not suitable for self-administration without the knowledge of your physician and regular monitoring by your physician. Do not disregard medical advice and always consult your physician with any questions you may have regarding a medical condition or before implementing anything  you have read or heard in our content.


Time Frame of an Epidemic

It occurred to me that the time frame for an epidemic to occur is absolutely critical in determining public response. If rates of a disease went from 1 in 10 people to 1 in 3 people in only 10 years, there would be public outcry for scientists to determine the cause and to find a cure quickly. If the disease caused debilitating metabolic effects such as very high blood pressure that resulted in heart attacks or strokes and people of all ages were getting this disease, with many dying – the outcry would be even more urgent.

But what if rates of the same disease went from 1 in 10 people to 1 in 3 people over a period of 40 or 50 years? The current generation would have no recollection of what it was like ‘before’ because things had always been this way since they were kids.  The older generation would remember what it was like ‘before’ and concluding that for whatever reason, that is the way it is now. Doctors and scientists of the older generation that might be able to apply their knowledge and skill to find the cause and a cure would be at the end of their working lives.

The disease is obesity.

Debilitating metabolic side effects of obesity include very high blood pressure that can lead to heart attacks and strokes and Type 2 Diabetes which can result in blindness, amputations and organ failure.

Once a rare disease, obesity has now reached epidemic proportions and the metabolic side effects are not just for the old, but are rampant among youth and young adults.

This disease epidemic has taken place over 50 years but few are noticing because it has fallen between the cracks of time.

Obesity Rates Then and Now

Photographs and videos of what people looked like fifty years ago are widely available, and a simple Google search will provide an abundance of them. Movies, documentaries and TV shows from the mid-1960s also provide a glimpse of what the average American and average Canadian looked like then.

In the 1960s only 10.7% of the US population and 10.2% of the Canadian population were obese; that’s approximately 1 in 10 people.

Below is a US sorority photo of a Sigma Iota Chi chapter from West Virginia from 1967. Look how slim most of the women are compared to today’s young adults.

SIX 1967.png
Sigma Iota Chi Sorority – West Virginia – 1967 (https://sororityhistories.wordpress.com/tag/sigma-iota-chi/)

West Virginia now has one of the highest adult obesity rate in the US.

Related image
1967 Kappa Alpha Fraternity Party Photograph – Cornell University

To the left is another photo from a 1967 Fraternity party at Cornell University. For the most part, the young men and their girlfriends are slim and lean – certainly much slimmer than university students today.

Below is what the average city-dwelling Canadian looked like in 1967, riding the subway in Toronto. Young adults, middle aged adults and older people were very slim compared to today’s standards – especially when compared to what the average public transit rider looks like today.

toronto subway rush hour

Most recent international data from 2015 found that 38.2% of the US population and 25.8% of the Canadian population are obese; that’s more than 1 in 3 people in the US and more than 1 in 4 people in Canada [1].

People in both countries are now some of the most obese in the world;

OECD Health Statistics 2017, June 2017

When one compares what university students looked above to what they look like now in a current photo of Fraternities and Sororities below, the difference in average body weight of the students from 50 years ago to today is quite apparent – despite the fact that university students come from families where the average family income is significantly higher than the national average.

Given this, their higher body weights cannot be dismissed due to low income, socioeconomic status or lack of education. So what is going on?

University of Nevada’s Fraternity and Sorority Community

What changed in the last 50 years that contributed to this obesity epidemic?

As written about in a previous article, in 1967 (fifty years ago) the sugar industry paid three Harvard researchers (Stare, Hegsted and McGandy) very handsomely to critique studies that vindicated sugar as contributing to abnormal fat metabolism and heart disease, and who instead laid the blame on dietary fat, and in particular  saturated fat and dietary cholesterol [2,3].

They concluded;

”Since diets low in fat and high in sugar are rarely taken, we conclude that the practical significance of differences in dietary carbohydrate is minimal in comparison to those related to dietary fat and cholesterol…the major evidence today suggests only one avenue by which diet may affect the development and progression of atherosclerosis. This is by influencing the levels of serum lipids [fats], especially serum cholesterol.” [4]

These researchers who were sponsored by the sugar industry concluded that there was “major evidence” which  suggested that there was only ONE avenue for diet to contribute to hardening of the arteries and the development of heart disease – and that was dietary fat and cholesterol…yet only a year later in 1968, the Diet-Heart Review Panel of the National Heart Institute recommended that a major study be conducted to determine whether changes in dietary fat intake prevented heart disease – because such a study had not yet been done [5].

No major study had yet been done to find out whether changing the types of fat we ate prevented heart disease, yet these researchers were SO certain that there was “only one avenue” for diet to contribute to hardening of the arteries and the development of heart disease. How much was their certainly impacted by their sponsors?

Their influence didn’t end there.

Only ten years later, one of the three Harvard researchers (Hegsted) was directly involved with developing and editing the 1977 US Dietary Guidelines [6] which recommended a decrease in saturated fat and cholesterol  consumption, and an increase in dietary carbohydrate. While Canadian Dietary Guidelines are distinct from the US ones, much of the research on which they are based is the same.

Comparing the US to Canadian dietary recommendations with respect to the consumption of fat in general, as well as the consumption of saturated fat in particular, one finds the recommendations mirror each other.

We are told to limit saturated fat ostensibly because of its negative impact on blood cholesterol and heart disease. We are told to increase consumption of vegetable oils, and to substitute polyunsaturated fats for saturated fat in cooking and baking and to eat 45-65% of our daily calories as carbohydrate.

It is increasingly my conviction that the simultaneous (1) marketing of polyunsaturated vegetable oil – more accurately called industrially-created seed oils, such as soybean oil and canola oil, along with (2) changes in the Dietary Recommendations in both Canada and the US for people to (a) limit calories from fat and especially to (b) limit saturated fat, combined with the recommendations for people to (c) eat 45-65% of calories as carbohydrate created the “perfect storm” that when viewed together,  explains the obesity epidemic we now have and the associated increase in metabolic health problems that we now see 50 years later.

I will be writing more in the days ahead on what is thought to be the role of these industrially-created seed oils in the process of obesity and inflammation that underlies many metabolic conditions, including Type 2 Diabetes.

Why isn’t the public alarmed by this massive increase in obesity?

I believe it’s because it took place over such a long period of time that those old enough to remember what things were like before have either died or are approaching retirement age and have left its solution to the next generation, and those young enough to do something about it have never known it any other way.

I think that looking at the magnitude of the epidemic without the time frame is helpful.

What if only 10 years ago, only 1 in 10 people were obese and now 1 in 3 people were obese? Would there not be a public outcry for scientists to determine what caused this and to research to find a cure quickly?

Obesity underlies debilitating metabolic effects such as very high blood pressure that can lead to heart attacks and strokes and people of all ages are getting this disease – including children and teenagers. Obesity underlies the huge increase in Type 2 Diabetes and when poorly managed can result in blindness, limb amputation and organ failure. People of all ages are dying from these metabolic effects of these disease, which at present are mainly being managed through medication and advising people to “eat less and move more”.

Is that the best we can do to curb this epidemic?

As covered in previous articles, there are peer-reviewed published studies – some a year or two long, that demonstrate that these metabolic effects can be put into remission by eating a diet with less carbohydrates yet government-funded research into use of this is not a priority.

Why?

What role does the sugar industry and the corn-producers (that manufacturer high fructose corn syrup found in much of our packaged food) play?

What role do the grain boards (that market wheat and other grains for baked goods) play?

What about the soybean and canola growers – multi-billion dollar a year  industries in both countries that grows the soybeans and canola seed that are processed into fats sold to consumers for cooking and baking?

These industries and their respective lobby groups play an influential role in the economies of both Canada and the United States and in that way (and others) influence what types of research should be funded.

There is an epidemic going on and people are living with terrible metabolic consequences of them or dying from them.

Before the Dietary Guidelines are updated in both countries, the governments of Canada and the US must approve external, independent scientific review of the evidence-base for the existing dietary recommendation as well as examine the evidence-base for use of a well- designed low carbohydrate diet in reducing obesity and managing the debilitating metabolic effects.

The length of time since the obesity epidemic began does not make this any less urgent.

Do you have questions about how I can help you in tackling obesity and lowering or putting metabolic side effects into remission?

Please send me a note using the “Contact Me” form located on the tab above.

To our good health,

Joy

You can follow me at:

 https://twitter.com/lchfRD

  https://www.facebook.com/lchfRD/


References

  1. OECD Health Statistics 2017, June 2017, http://www.oecd.org/els/health-systems/Obesity-Update-2017.pdf
  2. Kearns C, Schmidt LA, Glantz SA, et al. Sugar Industry and Coronary Heart Disease Research: A Historical Analysis of Internal Industry Documents. JAMA Intern Med. 2016 Nov 01; 176(11):1680-1685.
  3. Husten, L, How Sweet: Sugar Industry Made Fat the Villain, Cardio|Brief, 2016 Sept 13.
  4. McGandy, RB, Hegsted DM, Stare,FJ. Dietary fats, carbohydrates and atherosclerotic vascular disease. New England Journal of Medicine. 1967 Aug 03;  277(5):242—47
  5. The National Diet-Heart Study Final Report.” Circulation, 1968; 37(3 suppl): I1-I26. Report of the Diet-Heart Review Panel of the National Heart Institute. Mass Field Trials and the Diet-Heart Question: Their Significance, Timeliness, Feasibility and Applicability. Dallas, Tex: American Heart Association; 1969, AHA Monograph no. 28.
  6. Introduction to the Dietary Goals for the United States — by Dr D.M. Hegsted. Professor of Nutrition, Harvard School of Public Health, Boston, MASS., page 17 of 130, https://naldc.nal.usda.gov/naldc/download.xhtml?id=1759572&content=PDF

Copyright ©2018 The LCHF-Dietitian (a division of BetterByDesign Nutrition Ltd.) 

LEGAL NOTICE: The contents of this blog, including text, images and cited statistics as well as all other material contained here (the ”content”) are for information purposes only.  The content is not intended to be a substitute for professional advice, medical diagnosis and/or treatment and is not suitable for self-administration without the knowledge of your physician and regular monitoring by your physician. Do not disregard medical advice and always consult your physician with any questions you may have regarding a medical condition or before implementing anything  you have read or heard in our content.