Vilification of Saturated Fat – Bad Fat Enduring Beliefs Part 1

This is Part 1 in a new series titled Bad Fat Enduring Beliefs and this article looks at how and when saturated fat was vilified and why sugar was          vindicated as the cause of heart disease.

The Diet-Heart Hypothesis

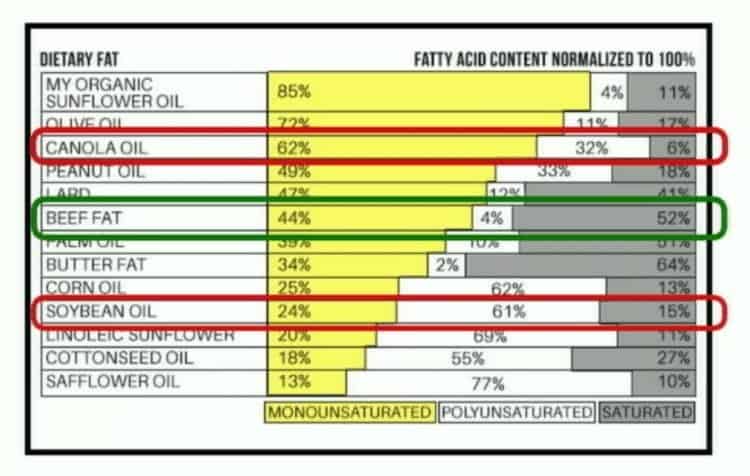
The diet-heart hypothesis is the belief that eating foods high in saturated fat contributed to heart disease was first proposed in the 1950s by a scientist named Ancel Keys who believed that by replacing saturated fat from meat, butter and eggs with newly-created industrial polyunsaturated vegetable oil (such as soybean oil) that heart disease and the deaths allegedly associated with it would be reduced by lowering blood cholesterol levels.

In 1952, Keys suggested that Americans should reduce their fat consumption by 1/3 and in 1953, Keys published a study where he said that he had demonstrated that there was an association between dietary fat as a percentage of daily calories and death from degenerative heart disease [1].

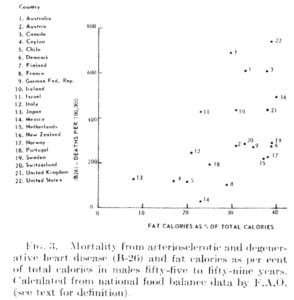
Four years later, in 1957, Yerushalamy et al published a paper with data from 22 countries[2] which showed a weak relationship between dietary fat and death by coronary heart disease — a much weaker relationship than was suggested by Keys’s in 1953. Nevertheless, in 1989 Keys and colleagues published their Seven Countries Study[3] which maintained there was an associative relationship between increased dietary saturated fat and Coronary Heart Disease — basically ignoring the data presented in Yerushalamy’s 1957 study, and which failed to study countries where Yerushalamy found no relationship between dietary fat and heart disease, such as in France. The paper maintained that the average consumption of animal foods (with the exception of fish) was positively associated with 25-year Coronary Heart Disease death rates and the average intake of saturated fat was strongly related to 10 and 25-year Coronary Heart Disease death rates. Keys and colleagues knew of the Yerushalamy’s data from 1957 and seemingly dismissed it.

Keys et al – Epidemiological studies related to coronary heart disease: characteristics of men aged 40—59 in seven countries [1]


Yerushalmy J, Hilleboe HE. Fat in the diet and mortality from heart disease. A methodologic note [2]
The paper has been widely criticized for selecting data only from the 7 countries that best fit their Diet Heart Hypothesis.

The Sugar Industry Funding of Research Vilifying Fat

In August of 1967, Stare, Hegsted and McGandy – the 3 Harvard researchers paid by the sugar industry published their review in the New England Journal of Medicine, titled ”Dietary fats, carbohydrates and atherosclerotic vascular disease”[3] which vindicated sugar as a contributor of heart disease and laid the blame on dietary fat and in particular, saturated fat and dietary cholesterol (previous article on that topic here).

Stare, Hegsted and McGandy concluded that there was “only one avenue” by which diet contributed to the development and progression of “hardening of the arteries” (atherosclerosis) and resulting heart disease and that was due to how much dietary cholesterol people ate and its effect on blood lipids;

”Since diets low in fat and high in sugar are rarely taken, we conclude that the practical significance of differences in dietary carbohydrate is minimal in comparison to those related to dietary fat and cholesterol…the major evidence today suggests only one avenue by which diet may affect the development and progression of atherosclerosis. This is by influencing the levels of serum lipids [fats], especially serum cholesterol.” [4]

These researchers concluded that there was major evidence available at the time which suggested that there was only ONE avenue for diet to contribute to hardening of the arteries and the development of heart disease – yet a year later in 1968 the report of the Diet-Heart Review Panel of the National Heart Institute made the recommendation that a major study be conducted to determine whether changes in dietary fat intake prevented heart disease because such a study had not yet been done [5];

”the committee strongly recommended to the National Heart Institute that a major definitive study of the effect of diet on the primary prevention of myocardial infarction be planned and put into operation as soon as possible. “

This is an important point; prior to a major study having ever been conducted to determine whether changes in dietary cholesterol impacts heart disease, 3 Harvard researchers paid by the sugar industry concluded that there was “only one avenue” by which diet contributed to the development and progression of atherosclerosis (i.e. “hardening of the arteries”) and heart disease and that was due to how much dietary cholesterol people ate and its effect on blood lipids.

Researcher Paid by the Sugar Industry Helps Develop the 1977 US Dietary Guidelines

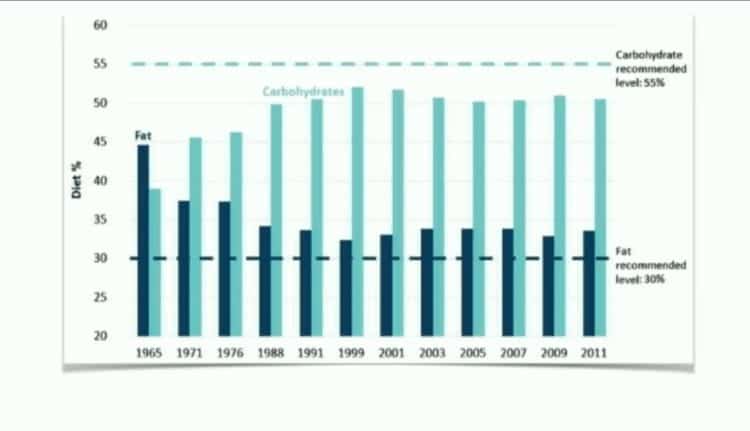
Only ten years after the sugar industry paid Stare, Hegsted and McGandy to write their reviews, the same Dr. Hegsted was directly involved with  developing and editing the 1977 US Dietary Guidelines [6] which recommended an increase in dietary  carbohydrate and a decrease in saturated fat and cholesterol in the diet.

Historic changes in the Dietary Recommendation in Canada have largely been based on changes to the Dietary Recommendations in the US, and as a result both stemmed from a belief that eating saturated fat increases total cholesterol and therefore increases the risk of heart disease.

The problem is this belief is just that, a belief.

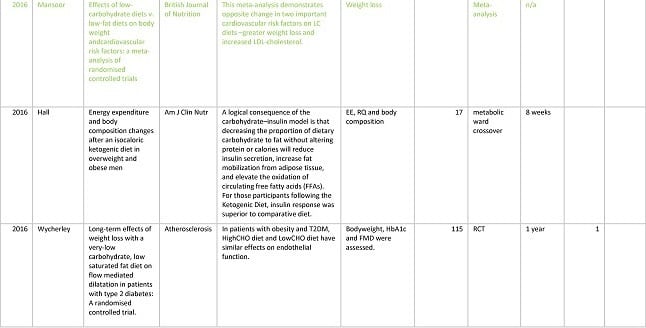
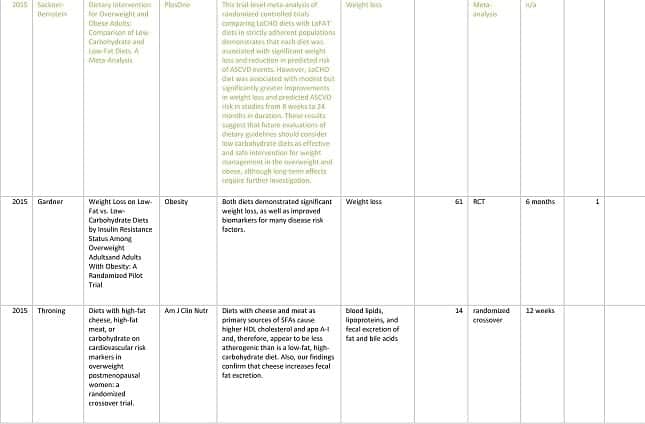
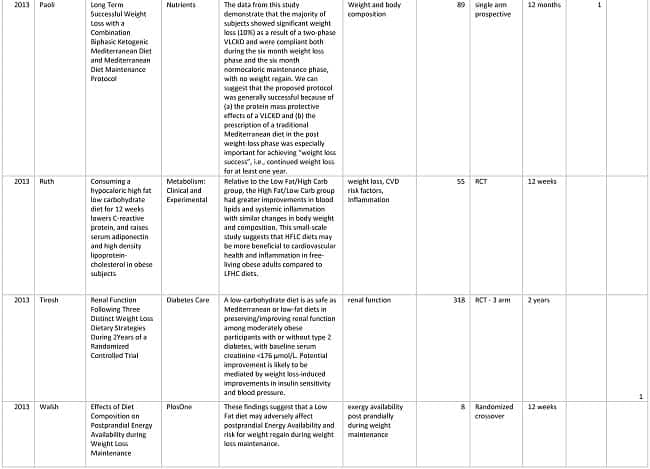
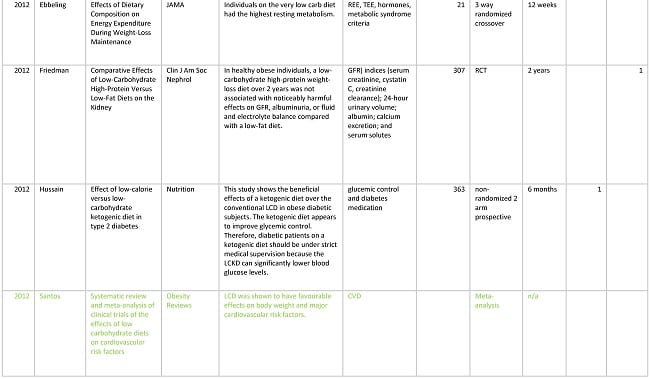
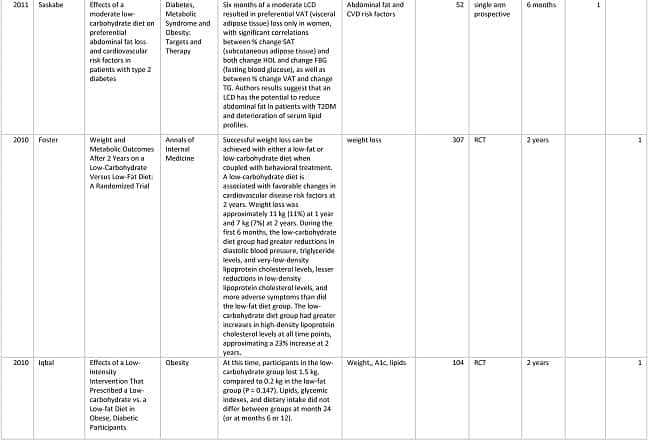
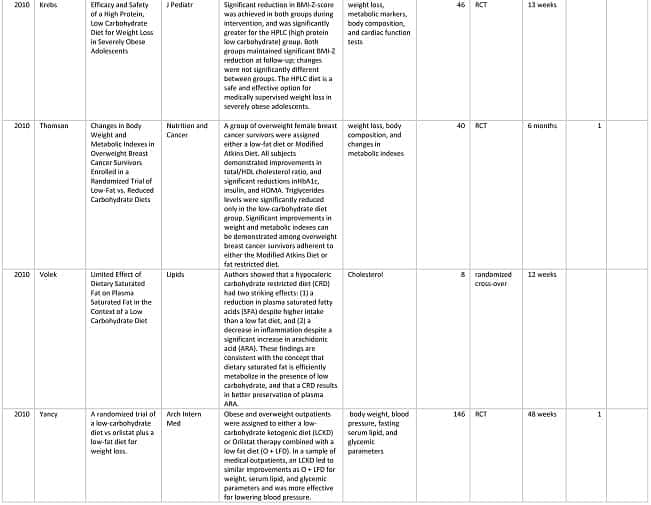
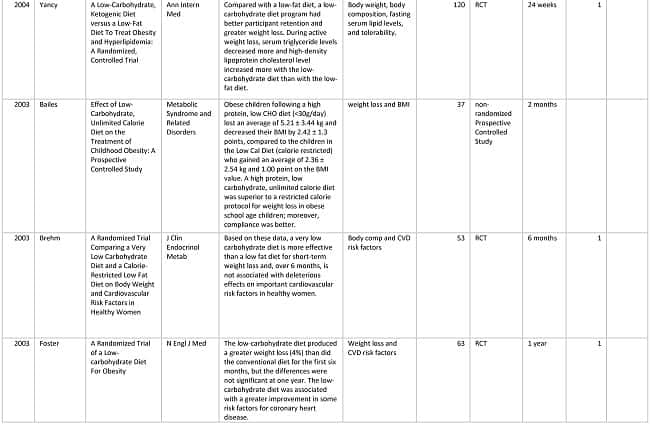
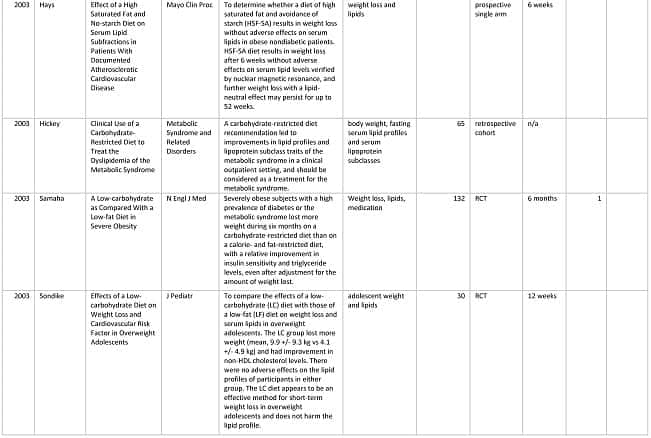
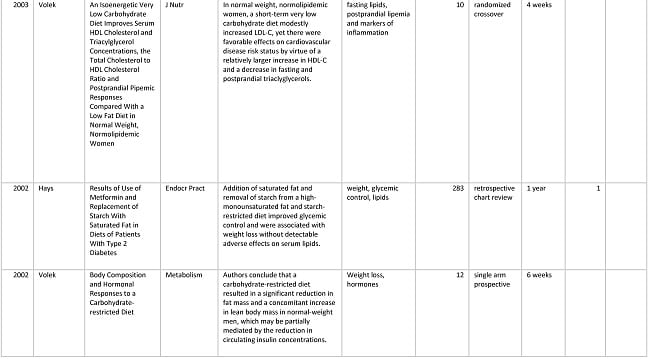
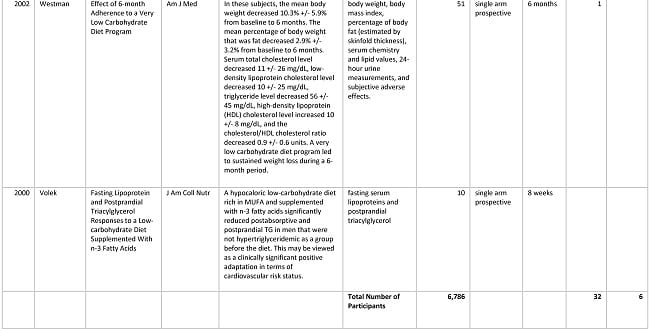
There have been many studies that have disproved this including a  randomized, controlled dietary intervention trial from 2008 which compared a low calorie, low in fat with a low carbohydrate, high fat diet of the same number of calories. This study found that overall heart health is significantly improved when carbohydrate is restricted, rather than fat [7,8].

Not all LDL cholesterol is “bad” cholesterol.

Small, dense LDL (“Pattern B”)  causes more “hardening of the arteries” than the large, fluffy LDL particles (“Pattern A”)[9].

It has been reported that when dietary fat is replaced by carbohydrate, the percentage of the small, dense LDL particles  (the ones that cause hardening of the arteries) is increased, increasing risk for heart disease.  Furthermore,  the low carb diet increased HDL (so-called “good” cholesterol), which are protective against heart disease and HDL and small, dense LDL were made worse on the low fat diet. Quite opposite to the “Diet-Heart Hypothesis, this study demonstrated improvements in the risk of heart disease for those eating a low carbohydrate, high fat diet compared to those eating a low fat, low calorie diet – which is not all that surprising given that it had been reported previously that a diet high in saturated fat actually lowers small, dense LDL (the type of LDL that causes hardening of the arteries) and raises the large fluffy LDL; actually improving risk factors for heart disease [15].

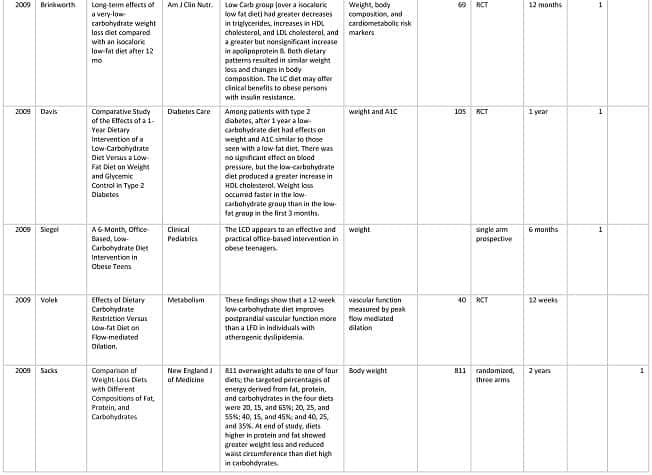
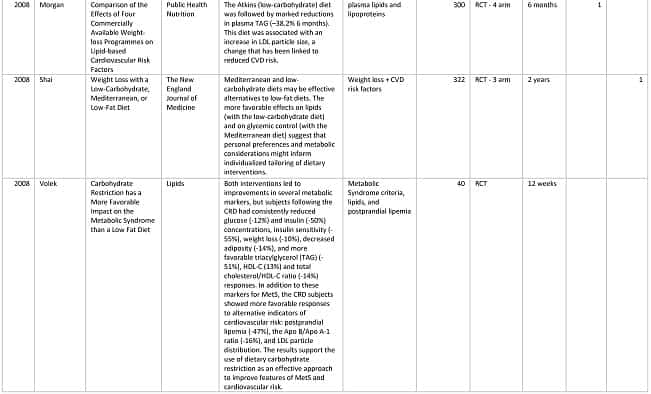
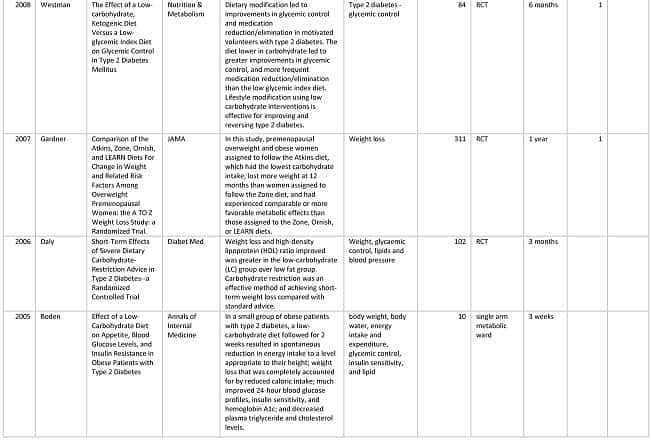
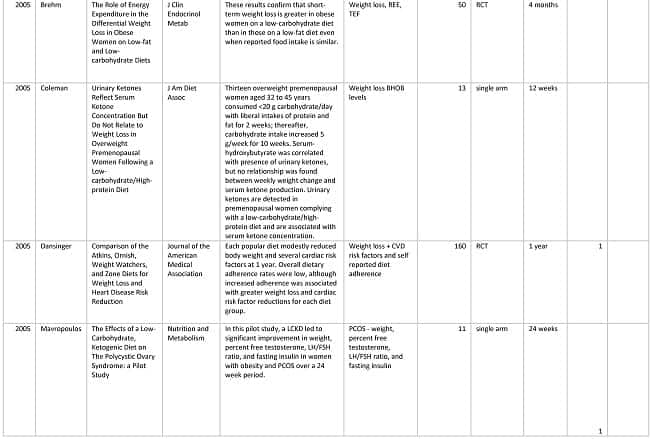
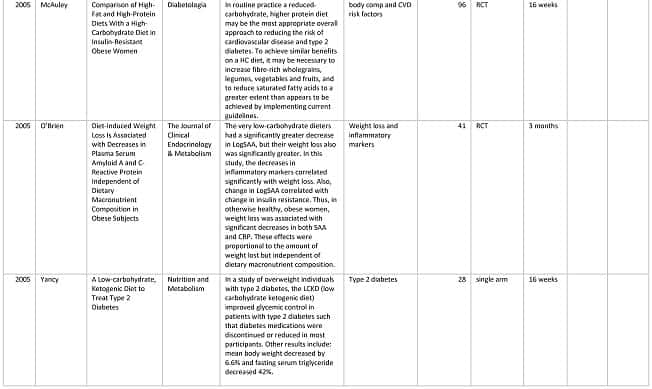
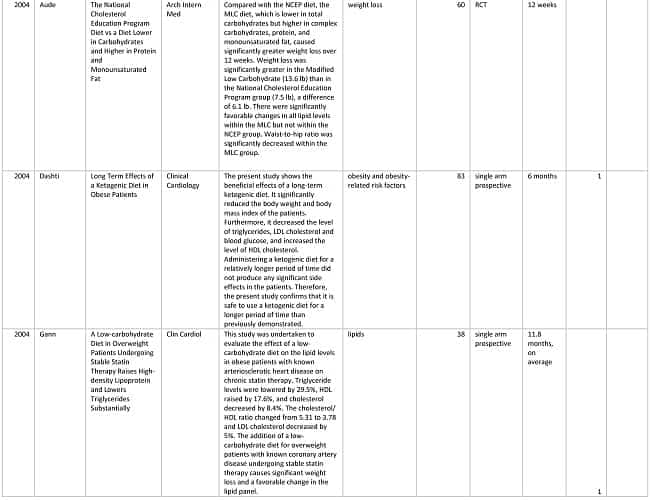
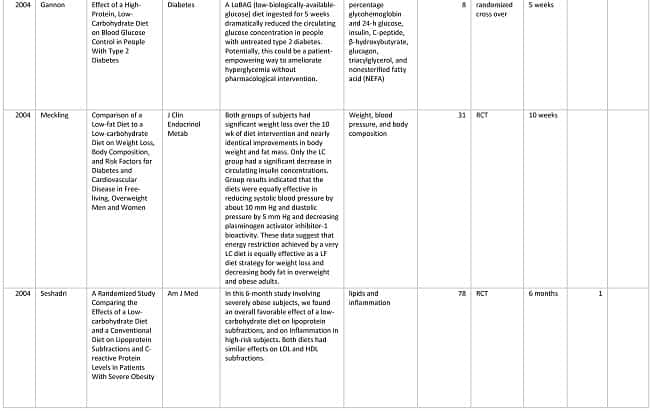
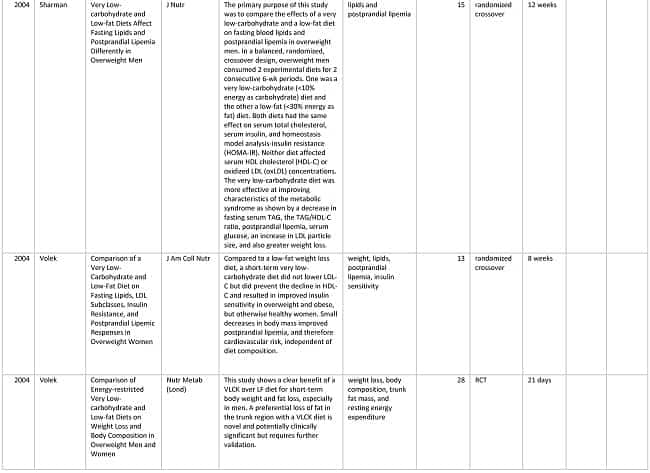
There are also other randomized controlled trials from 2004-2008 which demonstrate that a low carb diet improves blood cholesterol test results more than a low fat diet [10,11,12,13,14] – yet despite this, the belief that eating saturated fat increases blood cholesterol, persists.

Both the American and Canadian governments are in the process of revising their Dietary Guidelines and what is clear is that what is needed is an external, independent scientific review of the current evidence-base for the enduring false belief that dietary fat, especially saturated fat contributes to heart disease.

Have questions about how I can help you follow a low carb lifestyle?

Please send me a note using the “Contact Me” tab above and I will reply shortly.

To our good health!

Joy

You can follow me at:

 https://twitter.com/lchfRD

  https://www.facebook.com/lchfRD/

References

  1. KEYS, A., Prediction and possible prevention of coronary disease. Am J Public Health Nations Health, 1953. 43(11): p. 1399-1407.
  2. Yerushalmy J, Hilleboe HE. Fat in the diet and mortality from heart disease. A methodologic note. NY State J Med 1957;57:2343—54
  3. Kromhout D, Keys A, Aravanis C, Buzina R et al, Food consumption patterns in the 1960s in seven countries. Am J Clin Nutr. 1989 May; 49(5):889-94.
  4. McGandy, RB, Hegsted DM, Stare,FJ. Dietary fats, carbohydrates and atherosclerotic vascular disease. New England Journal of Medicine. 1967 Aug 03;  277(5):242—47
  5. The National Diet-Heart Study Final Report.” Circulation, 1968; 37(3 suppl): I1-I26. Report of the Diet-Heart Review Panel of the National Heart Institute. Mass Field Trials and the Diet-Heart Question: Their Significance, Timeliness, Feasibility and Applicability. Dallas, Tex: American Heart Association; 1969, AHA Monograph no. 28.
  6. Introduction to the Dietary Goals for the United States — by Dr D.M. Hegsted. Professor of Nutrition, Harvard School of Public Health, Boston, MASS., page 17 of 130, https://naldc.nal.usda.gov/naldc/download.xhtml?id=1759572&content=PDF
  7. Volek JS, Fernandez ML, Feinman RD, et al. Dietary carbohydrate restriction induces a unique metabolic state positively affecting atherogenic dyslipidemia, fatty acid partitioning, and metabolic syndrome. Prog Lipid Res 2008;47:307—18
  8. Forsythe CE, Phinney SD, Fernandez ML, et al. Comparison of low fat and low carbohydrate diets on circulating fatty acid composition and markers of inflammation. Lipids 2008;43:65—77
  9. Tribble DL, Holl LG, Wood PD, et al. Variations in oxidative susceptibility among six low density lipoprotein subfractions of differing density and particle size. Atherosclerosis 1992;93:189—99
  10. Foster GD, Wyatt HR, Hill JO, et al. A randomized trial of a low-carbohydrate diet for obesity. N Engl J Med 2003;348:2082—90.
  11. Stern L, Iqbal N, Seshadri P, et al. The effects of low-carbohydrate versus conventional weight loss diets in severely obese adults: one-year follow-up of a randomized trial. Ann Intern Med 2004;140:778—85
  12. Gardner C, Kiazand A, Alhassan S, et al. Comparison of the Atkins, Zone, Ornish, and LEARN diets for change in weight and related risk factors among overweight premenopausal women. JAMA 2007;297:969—77
  13. Yancy WS Jr., Olsen MK, Guyton JR, et al. A low-carbohydrate, ketogenic diet versus a low-fat diet to treat obesity and hyperlipidemia: a randomized, controlled trial. Ann Intern Med 2004;140:769—77
  14. Shai I, Schwarzfuchs D, Henkin Y, et al. Dietary Intervention Randomized Controlled Trial (DIRECT) Group. Weight loss with a low-carbohydrate, Mediterranean, or low-fat diet. N Engl J Med 2008;359:229—41
  15. Dreon DM, Fernstrom HA, Campos H, et al. Change in dietary saturated fat intake is correlated with change in mass of large low-density-lipoprotein particles in men. Am J Clin Nutr 1998;67:828—36

Copyright ©2018 The LCHF-Dietitian (a division of BetterByDesign Nutrition Ltd.) 

LEGAL NOTICE: The contents of this blog, including text, images and cited statistics as well as all other material contained here (the ”content”) are for information purposes only.  The content is not intended to be a substitute for professional advice, medical diagnosis and/or treatment and is not suitable for self-administration without the knowledge of your physician and regular monitoring by your physician. Do not disregard medical advice and always consult your physician with any questions you may have regarding a medical condition or before implementing anything  you have read or heard in our content.


The Marketing of Vegetable Fats to an Unsuspecting Public

Yesterday, in preparing to begin a new series of articles on the relationship between polyunsaturated vegetable fats to obesity, I came across an old, yellowed sheet titled “Comparison of Dietary Fats” that I was given as an undergrad Dietetic student at McGill, in 1989.

(reverse side) Comparison of Dietary Fats — ”Provided as a Professional Service by Proctor & Gamble”, 1989 – full size photo, below

It was designed to help us teach consumers how to choose the “healthiest” dietary fats.

As indicated at the bottom of both sides of the handout (see full size photos, below), it was “provided as a Professional Service by Proctor and Gamble“.

Why would Proctor and Gamble, a soap company provide future Dietitians with a teaching handout on choosing healthy oils for cooking? A bit of understanding about how soap is made, will help.

At the time, the making of soap required a mixture of animal fats and lye, however William Procter and James Gamble (brothers-in-law living in Cincinnati in the late 1800s and who formed Proctor and Gamble) needed to find an inexpensive replacement for animal fat for the creation of individually wrapped bars of soap.

The source of soap fat they turned to was a waste-product of the cotton industry – cottonseed oil. It was literally the garbage leftover when cotton was produced and is cloudy, red and bitter to the taste, and toxic to most animals.

They needed to make cottonseed oil solid in order to make bar soap and utilized a newly patented technology to produce a creamy, pearly white substance out of cottonseed oil. This fat resembled lard (the most popular natural animal fat baking and frying fat at the time), so with a little more tweaking, this hydrogenated cottonseed oil was then sold in 1911 by Procter & Gamble to home cooks as Crisco® shortening.

All that was needed now was for Proctor and Gamble to market this industrially-produced seed oil fat, and market it they did. They hired America’s first full-service advertising agency, the J. Walter Thompson Agency that employed graphic artists and professional writers.

“Samples of Crisco were mailed to grocers, restaurants, nutritionists, and home economists. Eight alternative marketing strategies were tested in different cities and their impacts calculated and compared.

Doughnuts were fried in Crisco and handed out in the streets.

Women who purchased the new industrial fat got a free cookbook of Crisco recipes. It opened with the line, “The culinary world is revising its entire cookbook on account of the advent of Crisco, a new and altogether different cooking fat.” [1]

From the very beginning, Proctor and Gamble marketed their industrially-created solid fat (Crisco®) to “nutritionists” and “home economists” – the forerunners to Dietitians.

When Procter & Gamble introduced Puritan Oil® in 1976, a liquid cooking oil made of sunflower oil which became 100% canola oil by 1988, it was natural for them to market their newly created oil to Dietitians.

Proctor & Gamble now had a lucrative business manufacturing industrial seed oils as dietary fats and they wanted to make sure that we, as Dietitians encouraged people to use their “healthy” fats.

I’ve scanned in both sides of the handout (it’s old and yellowed, having been kept in the back of my “new” 1988 Canada’s Food Guide book for almost 30 years). As can be seen, in first place on the front side of the handout is canola oil identified by the trade name “Puritan Oil®”, a registered trademark of Proctor and Gamble.

(front side) Comparison of Dietary Fats – “Provided as a Professional Service by Proctor & Gamble”, 1989

On the reverse side, is what consumers should know about these oils, including that canola oil is “better than all other types of vegetable oil“.

(reverse side) Comparison of Dietary Fats – “Provided as a Professional Service by Proctor & Gamble”, 1989

I’ve highlighted some of the wording that makes Proctor & Gamble’s bias apparent;

(reverse side) Comparison of Dietary Fats – “Provided as a Professional Service by Proctor & Gamble”, 1989 – red text mine

Some Final Thoughts…

From the very beginning, industrially-produced seed  fats and oils have been marketed to nutritionists, home economists and Dietitians by the companies that created them, in some cases as a “Professional Service”.

As will become clear in the next article we, as Dietitians were tasked by the Dietary Guidelines in both Canada and the US with promoting “polyunsaturated vegetable oils” to the public as ‘healthful alternatives’ to presumably unhealthy saturated animal fats. The manufacturers were there to ‘assist’ as a ‘Professional Service’.

Looking back on the role of fat manufacturers and the sugar industry (outlined in the preceding article) on which foods were recommended and promoted, it makes me question what I was taught and who affected what I was taught. Given that it was known at the time the sugar industry funded the researchers that implicated saturated fat as the alleged cause of heart disease, I wonder what we don’t know about which industry funded which research.  After all, the knowledge about the sugar industry having funded the researchers that implicated saturated fat only ‘came out’ in November 2016 when it had occurred decades earlier.

NOTE: It is increasingly my conviction that the simultaneous (1) marketing of polyunsaturated vegetable oil (soybean oil, canola oil) along with (2) changes in the Dietary Recommendations for people to (a) eat no more than 20- 30% of calories from fat and to (b) limit saturated fat to no more than 10% of calories, combined with the recommendations for people to (c) eat 45-65% of calories as carbohydrate was the “perfect storm” that may well explain the current obesity crisis and associated  increase in metabolic health problems that we now see 40 years later.

In subsequent articles I’ll elaborate on why I believe this is the case.

To our good health,

Joy

You can follow me at:

 https://twitter.com/lchfRD

  https://www.facebook.com/lchfRD/

References

  1. Ramsey, D*., Graham T., The Atlantic. How Vegetable Oils Replaced Animal Fats in the American Diet, April 26 2012 (www.theatlantic.com/health/archive/2012/04/how-vegetable-oils-replaced-animal-fats-in-the-american-diet/256155/)

*Dr. Drew Ramsey, MD is an assistant clinical professor of psychiatry at Columbia University.


Copyright ©2018 The LCHF-Dietitian (a division of BetterByDesign Nutrition Ltd.) 

LEGAL NOTICE: The contents of this blog, including text, images and cited statistics as well as all other material contained here (the ”content”) are for information purposes only.  The content is not intended to be a substitute for professional advice, medical diagnosis and/or treatment and is not suitable for self-administration without the knowledge of your physician and regular monitoring by your physician. Do not disregard medical advice and always consult your physician with any questions you may have regarding a medical condition or before implementing anything  you have read or heard in our content.


A Dietitian’s Journey – featured on Diet Doctor

Waking up to discover that my story and first anniversary health improvements from “A Dietitian’s Journey” was featured on Diet Doctor today was better than coffee. So timely too, as today is International Dietitian’s Day.

For those that haven’t yet read the story yet (located here) this is a summary;

My one year summary as it appears on Diet Doctor (link below with Tweet)

My journey wasn’t a straight path as it took a little bit of time to figure out which type of low carb diet my body responded to best. I started out with a low carb high fat approach and a few months ago switched to a low carb higher protein approach, along the lines of what Phinney and Volek use with great results (more info on the type of low carb approaches here).

Perhaps you’ve heard people say that a low carb or ketogenic lifestyle is somehow ”restrictive”, ”imbalanced” or that it’s ”not sustainable. This new post titled “Low Carb or Keto – what can you eat?” shows pictures of some of the meals that I currently eat (following a low carb higher protein approach) and also posts links to recipes. You’ll see that it is way more diverse than slabs of meat and piles of bacon and eggs!

If you’ve considered getting started eating low carb or keto but would like personalized support, I can help. Whether you live locally (in British Columbia) or far beyond, I provide both in-person and Distance Consultation services via telephone or internet.

If you have questions, please feel free to drop me a note using the “Contact Me” form above and I will reply soon.

To our good health!

Joy

A Dietitian’s Journey – front page news on Diet Doctor – March 14 2018

 https://twitter.com/lchfRD

  https://www.facebook.com/lchfRD/

Copyright ©2018 The LCHF-Dietitian (a division of BetterByDesign Nutrition Ltd.) 

LEGAL NOTICE: The contents of this blog, including text, images and cited statistics as well as all other material contained here (the ”content”) are for information purposes only.  The content is not intended to be a substitute for professional advice, medical diagnosis and/or treatment and is not suitable for self-administration without the knowledge of your physician and regular monitoring by your physician. Do not disregard medical advice and always consult your physician with any questions you may have regarding a medical condition or before implementing anything  you have read or heard in our content.

Low Carb or Keto – what can you eat?

Most criticism of a low carb lifestyle or ketogenic diet centers around a few common misconceptions including that such a lifestyle is “restrictive”, “imbalanced”, or that it’s “not sustainable”. This article addresses all three.

Firstly, as explained in an earlier post there isn’t a single “low carb” diet but basically 3 styles;

(1) low carb high protein
(2) low carb high fat approach
(3) higher protein lower fat intake during weight loss, then a moderate protein high fat intake during weight maintenance

What makes a low carb diet keto” is the amount of carbohydrate that is eaten.

There are different types of therapeutic ketogenic diets which have different clinical applications, including use in epilepsy and seizure disorder, specific types of cancer, Polycystic Ovarian Syndrome (PCOS), weight loss and improving insulin sensitivity and in each case, the ratio of protein to fat is specific to the condition (and in cases of weight loss and improving insulin sensitivity, to the individual).

While our bodies have an absolute requirement for essential amino acids, and essential fatty acids, as covered in detail in an earlier article, according to the Dietary Reference Intakes for Energy, Carbohydrate, Fiber, Fat, Fatty Acids, Cholesterol, Protein and Amino Acids (2005) there is no essential need for dietary carbohydrate provided that ”adequate amounts of protein and fat are consumed“.

That is, a low carb or ketogenic diet can be ‘complete’ as long as it supplies adequate amounts of protein (with all essential amino acids) and fat (with the essential fatty acids) and also provides the other nutrients the body requires (such as vitamins and minerals).

This is where I can help. I’ll design a nutritionally adequate Meal Plan specifically for you, in light of any clinical conditions you may have and factoring in your goals in choosing to eat this way.

Let me address the common (but unfounded) misconceptions that a low carb or ketogenic diet is “restrictive”, “imbalanced” or “not sustainable”.

A Low Carb or Keto Diet is “restrictive”, “imbalanced” or “not sustainable”

Usually, when people make comments like these, they have absolutely no idea that there are different types of low carb and keto diets. Ketogenic diets used in epilepsy and seizure disorder are very specific, as are ketogenic diets used for those with specific types of cancer. Ketogenic diets used to target insulin resistance associated with Type 2 Diabetes or pre-Diabetes are different again.

Foods and ratios of foods eaten when following a low carb diet targeting insulin resistance based on Dr. Jason Fung’s approach will differ somewhat from a low carb diet based on Dr. Eric Westman’s approach. A low carb diet based on Dr. Stephen Phinney and Dr. Jeff Volek’s approach will be different during the weight loss phase than during weight maintenance. As well, some low carb diets target protein and others target fat. Some promote unrestricted saturated fat in all forms, including bacon and cream, while others don’t. For example Dr. Fung’s approach does not limit eggs, cream and bacon and for weight loss, Dr. Westman’s approach does.

Low Carb Food Categories (based on a diagram from Dr. Ted Naiman)

In my practice, I focus on whole, unprocessed foods that are naturally low in carbohydrates and that come from a wide range of food categories, including non-starchy vegetables, plant fats, low sugar fruit, meat fish poultry and seafood, and animal fat.

I encourage people to eat the fat naturally found in the flesh of animal protein, but to trim meat of extraneous visible fat.

If people enjoy eating bacon from time to time, I’d encourage them to obtain one that is naturally cured and smoked and to eat it on occasion rather than daily.

From my perspective, it makes no sense for someone seeking weight loss to ‘add fat’ to foods for the sake of adding fat (e.g. ‘bulletproof’ coffee or ‘fat bombs’).  If people want to have a bit of cream in their coffee or a touch of butter on their asparagus there’s no reason why not, as there is nothing intrinsically ‘dangerous’ about fat, even saturated fat (more on this in upcoming blogs!). However from my perspective, adding coconut oil and butter to coffee for the sake of “adding fat” makes no sense, even for those following a “ketogenic” diet. I encourage folks to pursue health, not ketones.

Note: There are very few physiological conditions that require very high fat intake such as specialized diets for epilepsy or seizure disorder or for specific types of cancer as an adjunct to treatment.

To address the misconceptions that a low carb or ketogenic diet is restrictive, imbalanced or in any way unsustainable, below are some photos of types of foods that I prepare and eat. Everybody has different types of foods that they enjoy, these are simply some of mine.

Keep in mind that in some photos, only the main course is shown not the large salad or side of cooked vegetables which almost always accompanies it. As well, many of the servings shown are of one of my young adult son’s plates, rather than mine (my serving sizes are different because my nutritional needs are different).

I am showing these photos to dispel the myth that eating a low carb diet is in any way “restrictive”, “imbalanced” or “not sustainable” and I hope they give you some ideas of the wide range of whole, delicious food that is available to be enjoyed when pursuing a low carb or keto lifestyle.

Shakshuka is weekend breakfast or brunch food, that I usually serve with a huge mixed green salad or cucumber and tomato salad.

Shakshuka for three
individual serving of shakshuka

Another favourite on the weekend is Vanilla Bean Pancakes – which one of my young adult sons loves to smother in butter (too much butter for me!). That day, he had poached eggs on the side and a mixed green salad with pumpkin seeds and pomegranate arils on top, drizzled with cold-pressed olive oil.

One of my young adult son’s helping of Vanilla Bean pancakes and butter
a close up of a Vanilla Bean pancake

This is one of my favourite breakfast or brunch salads:

Greek salad with mini marzano tomatoes, mini cukes, goat feta and kalamata olives with a drizzle of cold pressed olive oil, rubbed oregano and fresh lemon

Below is a totally decadent plate that I made this past Sunday from the other half of my rib steak that I cooked the night previously (way too much meat for me!!), that I sliced thinly and warmed with stir fried asparagus, roasted peppers (also from the previous night’s supper) and a few thin slices of melted brie on top. This was shared between two for brunch, and served along with a mixed green salad.

Brunch plate made with leftover steak, roasted peppers and asparagus, with melted brie
BBQ’d burgers on a lettuce bun with grilled asparagus and a small side salad

Here’s how we eat “burgers” for dinner.


…and a close up of one of my son’s plates:

BBQ’d cheese burgers served on a lettuce bun

The burgers look bigger than they are, because they are served on a smaller diameter “lunch” plate, rather than a “dinner” plate. The burgers in this case were served with a large mixed green salad, with a few raspberries on top, a light sprinkling of roasted pumpkin seeds along with a drizzle of cold- pressed olive oil.

Below is one of my son’s plates of lamb souvlaki that I also made this past weekend, and served with homemade tzatiki, grilled asparagus and a small Greek salad on the side (my plate had less lamb and a smaller piece of feta and more asparagus – again, because my nutritional needs are different).

a son’s plate of lamb souvlaki with homemade tzatiki, grilled asparagus and small Greek salad

…and finally, this is a popular weekend Middle Eastern style brunch in warmer weather:

Homemade Maza for weekend brunch

Want “noodles”? Sure!  See the “Recipe” tab for details.

low carb broad noodles

These can be cut (or bought pre-cut) in thinner slices like linguine and are wonderful topped with spaghetti sauce or pesto.

Eating low carb or keto need not involve this much cooking, either! One can make a simple piece of grilled, broiled or pan-fried fish or chicken, some cooked veggies in the microwave and/or a salad.  I happen to enjoy cooking (and my sons enjoy eating!) so this is something I do to relax.

Whether the meals are simple with little cooking required or elaborate, there is nothing “restrictive” about eating low carb.

As for eating this way being “imbalanced”, someone would be hard-pressed to demonstrate that eating this way doesn’t provide adequate nutrients. There is cheese and other dairy, nuts, seeds, fruit, vegetables and a wide variety of meat, fish and poultry. The diet provides all essential amino acids, essential fatty acids and ample vitamin and minerals – certainly no less than the average Canadian diet provides!

As for eating this way being “not sustainable”, what is not sustainable about eating fresh, healthy, whole foods that can be eaten with a minimum of preparation or as elaborate as one’s imagination allows?

I know of people that have been eating this way for 15 or 20 years and I personally have been eating this way for just over a year now (see “A Dietitian’s Journey” tab) and there is nothing that I miss!

If I want something, I make it!

When it was blustery out, I wanted to make “Shepherd’s Pie”, so I made it, substituting cut up green and waxed beans with cubed carrot for the usual vegetable medley and topping with mashed cauliflower, instead of mashed potato.

low carb Shepherd’s Pie

Another time, I felt like lasagna so I made it with thinly sliced Chinese eggplant in place of pasta and it was delicious!

low carb lasagna

Oh and bread? No worries!

One of my son’s wanted a “grilled cheese” and so I made him this.

low carb grilled cheese

What if you want a kaiser bun for a sandwich, or a hamburger bun? No problem (see “Recipes” tab).

Low carb kaiser bun sandwich
freshly baked low carb hamburger buns

Crispy, yeasty pizza? Sure! Yes, the full recipe is available on the “Recipe” tab.

crispy, yeast pizza

While “keto pizza” is higher fat than I personally would ordinarily eat as an ‘everyday food’ (because I follow the third type of low carb style of eating and am still in the weight loss phase), if I really wanted a pizza, I’d make it! I can plan for it ahead of time or adjust my eating for a little while afterwards to compensate, but eating this way does NOT involve food restriction.  It does require making some adaptation to prepare it differently, but there are plenty of websites geared to supporting those following a low carb lifestyle that have wonderful recipes.

I hope this post encouraged you that following a low carb or keto lifestyle is entirely doable, provides adequate essential nutrients from a wide variety of food categories. It is certainly not restrictive or nutritionally imbalanced and can be sustained for as long as someone desires to eat this way.

Want to get started, but need some help designing a Meal Plan just for you? I’d be glad to help.

Whether you live here in the Lower Mainland or live far away, the identical services and prices are available in-person or via Distance Consultation.

Have questions?

Please send me a note using the “Contact Me” form and I’ll reply as soon as possible.

To our good health!

Joy

You can follow me at:

 https://twitter.com/lchfRD

  https://www.facebook.com/lchfRD/


Copyright ©2018 The LCHF-Dietitian (a division of BetterByDesign Nutrition Ltd.) 

LEGAL NOTICE: The contents of this blog, including text, images and cited statistics as well as all other material contained here (the ”content”) are for information purposes only.  The content is not intended to be a substitute for professional advice, medical diagnosis and/or treatment and is not suitable for self-administration without the knowledge of your physician and regular monitoring by your physician. Do not disregard medical advice and always consult your physician with any questions you may have regarding a medical condition or before implementing anything  you have read or heard in our content.

Sugar Industry Paid Researchers that Blamed Saturated Fat as Cause of Heart Disease

A year ago, I found out from a fellow Dietitian that a recently published article in the Journal of the American Medical Association revealed that the sugar industry had secretly funded a group of renowned Harvard researchers to write an influential series of articles which downplayed, discredited or outright ignored research known at the time, and which demonstrated that sugar was a contributor to heart disease.

I read the article and was stunned at its significance.

As I am in the midst of a new series of articles on the role of saturated fat and polyunsaturated fat in health and disease, I felt it’s important that people understand the sugar’s industry involvement in potentially skewing of the scientific evidence at the very time that the original 1977 low-fat high carb Dietary Guidelines were being formulated and so I researched further and wrote this article.

Two of the prominent Harvard researchers that were paid by the sugar industry and who wrote articles dismissing that sugar was a significant contributor to heart disease and implicating saturated fat as the cause were the late Dr. Fredrick Stare, chair of Harvard’s School of Public Health Nutrition Department and the late Dr. D. Mark Hegsted, a professor in the same department [2].

POST PUBLICATION NOTE (March 12 2018): Dr. Hegsted, one of the 3 Harvard researchers paid by the sugar industry to write these review articles was directly involved in developing the 1977 US Dietary Guidelines [6].

[Note: April 1, 2021: see this article for documentation.]


A commentary in the Journal of Accountability in Research [4] summarized the significance of those articles as follows;

“Researchers were paid handsomely to critique studies that found sucrose [sugar] makes an inordinate contribution to fat metabolism and heart disease leaving only the theory that  dietary fat and cholesterol was the primary contributor.”

In the mid-1960’s, the Sugar Research Foundation (which is the predecessor to the Sugar Association) wanted to counter research that had been published at the time which suggested that sugar was a more important cause of atherosclerosis than dietary fat. The Sugar Research Foundation invited Dr. Stare of Harvard’s School of Public Health Nutrition Department to join its scientific advisory board and then approved $6,500 in funds ($50,000 in 2016 dollars) to support a review article that would respond to the research showing the danger of sucrose[2].  Letters exchanged between the parties were brought to light in the November 2016 article published by Kearns et al [1] maintained that the Sugar Research Foundation tasked the researchers with preparing ”a review article of the several papers which find some special metabolic peril in sucrose [sugar] and, in particular, fructose [3].”

This would seem akin to the tobacco industry having secretly funded articles demonstrating that something other than smoking was responsible for lung cancer.

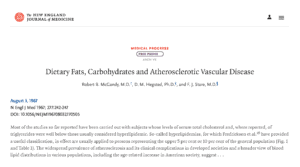
In August 1967 the New England Journal of Medicine published the first review article written by Drs. Stare, Hegsted and McGandy titled ”Dietary fats, carbohydrates and atherosclerotic vascular disease”[3] which stated;

”Since diets low in fat and high in sugar are rarely taken, we conclude that the practical significance of differences in dietary carbohydrate is minimal in comparison to those related to dietary fat and cholesterol”

The report concluded;

”the major evidence today suggests only one avenue by which diet may affect the development and progression of atherosclerosis. This is by influencing the levels of serum lipids [fats], especially serum cholesterol.”

The Harvard researchers went on to say;

”there can be no doubt that levels of serum cholesterol can be substantially modified by manipulation of the fat and cholesterol of the diet.”

The Harvard researchers concluded;

“on the basis of epidemiological, experimental and clinical evidence, that a lowering of the proportion of dietary saturated fatty acids, increasing the proportion of polyunsaturated acids and reducing the level of dietary cholesterol are the dietary changes most likely to be of benefit.”

Stare, Hegsted and McGandy did not disclose that they were paid by the Sugar Research Foundation for the two-part review [4].

In response to Kearns et al article in the Journal of the American Medical Association in November 2016 [1], the Sugar Association responded [5] by stating that it;

”should have exercised greater transparency in all of its research activities, however, when the studies in question were published funding disclosures and transparency standards were not the norm they are today.” [5]

Some final thoughts…

The reviews written by these influential Harvard School of Public Health Nutrition Department researchers and paid for by the sugar industry have the appearance of being a deliberate manipulation of the perception of the scientific evidence known at the time. 

Whether deliberate or inadvertent, the fact that such sponsorship occurred at the very period in time when the Dietary Guidelines were under revision to emphasize that saturated fat intake must be reduced and carbohydrate consumption must be increased cannot be understated — a move which certainly benefited the sugar industry.

POST PUBLICATION NOTE (March 12 2018): Discovered after publication of this article, one of the three Harvard researchers funded by the sugar industry, Dr. D.M Hegsted was one of the scientists that worked on the 1977 US Dietary Guidelines[6].

[Note: April 2, 2021: See this article for documentation.]

How has this turned out for us?

For the last 40 years, Americans and Canadians have diligently eaten more carbohydrate (including foods containing sucrose and fructose) and more polyunsaturated fats (especially soybean and canola oil) just as the Harvard researchers paid for by the sugar industry recommended — and to what end?

Obesity rates have gone from ~10% in the 1950’s and 60’s in both countries to 26.7% in Canada (2015) and ~34% in the US (2017) and Diabetes and high blood pressure (hypertension) rates have risen exponentially.

What’s going on?

Could it be that the shift to a diet abundant in omega-6 polyunsaturated fat (such as soyabean oil) and which supplies 45-65% of daily calories as carbohydrate created the ‘perfect storm‘ which inadvertently fueled the obesity and health epidemic we now see?

This will be the subject of future articles.

Have questions?

I provide both in-person and Distance Consultation services (via telephone or Skype) can help you learn a better and easier way to eat, while you achieve and maintain a healthy body weight long term.

Please send me a note using the “Contact Me” tab above and I will reply shortly.

To our good health!

Joy

You can follow me at:

 https://twitter.com/lchfRD

  https://www.facebook.com/lchfRD/


Copyright ©2018 The LCHF-Dietitian (a division of BetterByDesign Nutrition Ltd.) 

LEGAL NOTICE: The contents of this blog, including text, images and cited statistics as well as all other material contained here (the ”content”) are for information purposes only.  The content is not intended to be a substitute for professional advice, medical diagnosis and/or treatment and is not suitable for self-administration without the knowledge of your physician and regular monitoring by your physician. Do not disregard medical advice and always consult your physician with any questions you may have regarding a medical condition or before implementing anything  you have read or heard in our content.

References

  1. Kearns C, Schmidt LA, Glantz SA, et al. Sugar Industry and Coronary Heart Disease Research: A Historical Analysis of Internal Industry Documents. JAMA Intern Med. 2016 Nov 01; 176(11):1680-1685.
  2. Husten, L, How Sweet: Sugar Industry Made Fat the Villain, Cardio|Brief, 2016 Sept 13.
  3. McGandy, RB, Hegsted DM, Stare,FJ. Dietary fats, carbohydrates and atherosclerotic vascular disease. New England Journal of Medicine. 1967 Aug 03;  277(5):242—47
  4. Krimsky, S. Sugar Industry Science and Heart Disease, Accountability in Research. 2017 Oct 07; 24:2, 124-125.
  5. Sugar Association, The Sugar Association Statement on Kearns JAMA Study, 2016 Sep 12
  6. Introduction to the Dietary Goals for the United States – by Dr D.M. Hegsted. Professor of Nutrition, Harvard School of Public Health, Boston, MASS., page 17 of 130, https://naldc.nal.usda.gov/naldc/download.xhtml?id=1759572&content=PDF

PART 2 of 2: The Evolving Hypothesis of Obesity – how polyunsaturated fat makes us fat

This content of this post is based largely on a presentation titled “A New Hypothesis for Obesity” given by Dr. Michael Eades at the Low Carb Breckenridge Conference, Breckenridge Colorado, Sunday, March 4, 2018 with some details filled in from his website. Dr. Eades has been in full time practice of bariatric, nutritional and metabolic medicine since 1986 and is the Director of Medi-Stat Medical Clinics, a chain of ambulatory out-patient family care clinics in central Arkansas. I have added the Canadian data for the benefit of my readers. This article is Part 2 in the two-part series The Evolving Hypothesis of Obesity. Part 1, which lays the groundwork for this article can be read here.

In the 1970’s the Dietary Guidelines in both the US and Canada advised us to eat more grains, vegetables and fruit and to eat vegetable fat, instead of saturated fat in butter, eggs, whole milk and red meat.

The US has dutifully complied, as indicated by the following graph;

US per capita consumption of grains, vegetables and fruit and vegetable oils compared to red meat, whole milk, eggs, animal fats and butter – Nina Teicholtz via – Dr. Michael Eades – A New Theory of Obesity, Low Carb Breckenridge, March 4 2018

Similar types of increases and decreases have been observed in Canada. According to Statistics Canada;

“In the past two decades, Canadians have shifted towards a diet which includes more fruits and vegetables, cereal products, and nuts and beans. During this time, poultry consumption has increased, while beef and pork consumption has continued to decline.”

In 2016, per capita consumption of beef, pork, lamb and veal in Canada was 47.7 kg (105 lbs) per person per year down from the 73.2 (161 lbs) per person per year it was in 1980. Egg consumption also dropped from 21.96 dozen per person per year in 1980 to 19.93 dozen in 2016. The last time it was measured nationally in 2009, total fresh vegetable intake (excluding potatoes) rose to a record 40.7 kg (89.7 lbs) per person and the amount of potatoes including as french fries was 27.9 kg (61.6) per person, making total vegetable consumption 68.6 kg (151 lbs) per person per year. Total fresh fruit consumption also rose to a record 39.3 kg per person.

The Canadian Canola Growers Association reported that in 2012, 600,000 tonnes of canola oil and soybean oil was consumed by Canadians either as grocery store items or food-service products, including margarine, cooking oil, mayonnaise and salad dressing. In the twelve months ending July 2012, 2.8 million tonnes of Canadian vegetable oil was exported to the US and China, accounting for another 2.4 million tonnes.

In 2012, Sean McPhee, President of the Vegetable Oil Industry of Canada said;

”The vegetable oil industry is an important part of Canada’s growing agri-food sector. The industry’s processing capacity in 2012 is nearly double the capacity of 2007, and it is anticipated that further expansion will increase capacity 50 per cent by 2015.”

As saturated fat intake has declined, carbohydrate intake has continued to increase from the mid-1960s onward.

Decrease in saturated fat consumption, increase in carbohydrate consumption (US data) – Dr. Michael Eades – A New Theory of Obesity, Low Carb Breckenridge, March 4 2018

The Evolving Hypothesis of Obesity

The most significant change since 1976-1980 is that we are eating a great deal more linoleic acid found in soybean, canola and corn oil while simultaneously eating significantly less saturated fat and overall eating more calories.

Three factors together are thought to have produced the “perfect storm” which has resulted in the massive increase in obesity from 1980 until the present;

(1) the vilification of saturated fat
(2) the encouragement to eat industrially produced vegetable oils
(3) the increased consumption of refined carbohydrates.

Simply put, the evolving hypothesis of obesity states that in addition to the (a) increasing amount of carbohydrate in the diet since ~1980, things are made significantly worse by (b) large amounts of industrially-produced  polyunsaturated fats which promote obesity simultaneous to the (c) decrease in naturally occurring saturated fats which protect against obesity.

Dr. Eades credits much of the mechanism for the linoleic hypothesis to Dr. Petro Dobromylskyj, whose is a doctor of veterinary medicine and who writes a technical blog called Hyperlipid which I referred to in order to fill out my understanding in writing this article.

The difference between how the body processes saturated fats versus polyunsaturated fats

To understand the mechanism, the only chemistry you need to understand is the difference between a saturated fat and an unsaturated fat.

Saturated fats are ones where all the carbons in the chain are saturated with hydrogen atoms and there are no double bonds in the middle of the fatty acid chain. Palmitic acid (a 16 carbon fat) is an example of a saturated fat – and is one that our body synthesizes.

Saturated fat – palmitic acid

When a saturated fat is broken down (called “beta oxidation”), 2 carbons are cleaved off at a time, until the fat is completely broken down.

Beta Oxidation of a Saturated Fat – e.g. palmitic acid

Glucose is processed anaerobically in the cytosol of cell, but fatty acids are metabolized inside organelles called mitochondria (the ‘powerhouse of the cell’). All our food (regardless what it is) is metabolized to a combination of FADH2 and NADH.

The NADH and FADH2 enter the Electron Transport Chain at different complexes. NADH enters at Complex I (CI), while FADH2 enters at Complex II (CII).


Saturated fat has a feedback mechanism called the Reverse Electron Transport which keeps the cell from taking in too much energy – – Dr. Michael Eades – A New Theory of Obesity, Low Carb Breckenridge, March 4 2018

The lower the FADH2:NADH ratio is, the lower the local insulin resistance is and the higher the FADH2:NADH ratio, the higher the local insulin resistance.

A saturated fat generates a higher FADH2:NADH ratio, so saturated fat increases local insulin resistance which serves to keeps more carbs in the blood.  A process called Reverse Electron Transport is initiated which results in the making of a signalling molecule known as a superoxide (SO) molecule. This signalling molecule tells the body to stop insulin signalling by inducing local insulin resistance. This way, the cell doesn’t take up too much energy.

An unsaturated fat, on the other hand (such as palmitoleic acid or linoleic acid) has double bonds in the middle of the chain which changes the way the body processes it.

Beta oxidation of Palmitoleic acid (unsaturated fatty acid)
Polyunsaturated fat provide NO feedback mechanism (no Reverse Electron Transport) so there is nothing to keep the cell from taking in too much energy – Dr. Michael Eades – A New Theory of Obesity, Low Carb Breckenridge, March 4 2018

When fat cells (and other cells) are metabolizing an unsaturated polyunsaturated fat (PUFA) such linleoic acid from soybean oil, corn oil or canola oil, they generates a lower FADH2:NADH ratio, so an unsaturated fat reduces local insulin resistance, which means they allow plenty of glucose into the cells along with the PUFA.

These n-6 PUFAs generate energy all the way through the Electron Transport Chain and the Reverse Electron Transport is not triggered, so NO (superoxide) signalling molecule to tell the body to stop insulin signalling (i.e. there is no localized insulin resistance caused). The cell just keeps taking in more and more energy even though it doesn’t need any more!  This means the fat gets driven into the fat cells and is stored there, making it unavailable for use for energy.

Once fat gets stored in the fat cells, the body can only break it down when no more energy is coming in (such as when fasting), so the only way the body can get more energy is to eat more. The glucose is driven into the cells because of the decreased insulin resistance caused by the n-6 PUFAs oils, which results in glucose level falling. This causes the body to produce a strong signal to eat; in other words, it makes you hungry.

Along with carbohydrates, n-6 PUFA vegetable oils have increased dramatically in the typical American and Canadian diet since the 1970s and this mechanism explains why we’ve been getting fatter and fatter since then.

So much of our eating now takes place away from home, or with food made away from home, that much of the fat intake in the diet is n-6 PUFA vegetable oils that signal glucose to come right in along with them.

French Fries then and now

In the 1960’s French fries were fried in beef tallow (which is a saturated fat), and the stearic acid from the beef fat and the glucose (from the broken down potato) would be processed by the fat cell (adipocyte).

When the cell had enough energy, Reverse Electron Transport would kick in and create the signalling molecule (superoxide molecule), which would tell the body that it didn’t need any more energy. This would result in a decrease in hunger and an increase in energy expenditure.

Think of the superoxide molecule as a “bouncer” at a night club.  When there are enough people inside, the “bouncer” simply won’t admit any more people until some leave.

When French fries are fried in polyunsaturated vegetables oil, the linoleoic acid (from the soybean oil or canola oil) and glucose (from the broken down potato) are processed by the fat cell. The problem is, that even when the cell has more than enough energy, Reverse Electron Transport does NOT kick in and there is NO signalling molecule (superoxide) produced. The body doesn’t get any message that it doesn’t need any more energy, and the person doesn’t get any signal that they’re full, so they just keep eating.

In the case of eating foods made with polyunsaturated fat, it would be like a night club that has no “bouncer”.  Even when the club is jam-packed with people, everybody is admitted until there is no room to move!

The absence of a feedback mechanism in processing unsaturated polyunsaturated fats results in fat cells getting bigger and bigger – Dr. Michael Eades – A New Theory of Obesity, Low Carb Breckenridge, March 4 2018

The mechanism simply explained

Fat cells (adipocytes) bind more insulin at a given level of exposure when eating polyunsaturated fats such as soybean oil, canola oil and corn oil, than fat cells bind when eating saturated fat such as butter, lard or beef tallow.

Since insulin has to bind to its receptor to work and more insulin is bound when eating a diet rich in polyunsaturated fats, significantly more glucose is taken up into a fat cell in a diet high in polyunsaturated fats than in a diet rich in saturated fat. That is, the cells are more sensitive to insulin when eating a diet rich in polyunsaturated fats than a diet rich in saturated fat, so polyunsaturated fats allow too much glucose in to cells.

When fat cells and other cells are metabolizing saturated fat they make a superoxide (SO) molecule as a result of Reverse Electron Transport which is used to stop insulin signalling. When fat cells and other cells are metabolizing polyunsaturated fats, there is NO Reverse Electron Transport, so they are unable to generate the  superoxide molecule that is needed to stop insulin signalling. This is because there is too little FADH2 being delivered to ETF.

Saturated fats, such as Palmitic acid have a higher FADH2: NADH ratio and it is believed that this is what drives Reverse Electron Transport (RET).

The FADH2 to NADH Ratio (also called the F:N ration – different with saturated fats and unsaturated fats – Dr. Michael Eades – A New Theory of Obesity, Low Carb Breckenridge, March 4 2018

Oleic acid, the monounsaturated fat found in olive oil drives Reverse Electron Transport (RET) somewhat, but to a lesser degree than a saturated fat.

Unsaturated polyunsaturated fats such as Linoleic acid (found in soybean oil, corn oil and canola oil) have too small a FADH2: NADH ratio which prevents it from initiating Reverse Electron Transport (RET). It is thought that because polyunsaturated fats have such a low FADH2: NADH ratio, they are treated by the body similarly to glucose.

There are two consequences to eating fats with this low FADH2: NADH ratio.

  1. the fat cells (adipocytes) get over-stuffed with fat (because there is no “off switch”)
  2. When these fat cells get over-full they are unable to keep the fat contained as they should, and as a result free fatty acids are released and eventually find their way into other places where fat is not supposed to be found, such as in the liver, pancreas, even muscle and bone cells.  This is known as ectopic fat and the condition that results is called metabolic syndrome.

Summary

What happened after the 1950s and 1960s that caused overweight and obesity to suddenly explode in the 1970’sand just keep rising?

The answer is the types of fat we started eating.

Even though we were eating the same total amount of fat as before, these new industrially-produced polyunsaturated fats (such as soybean oil, canola oil and corn oil) do NOT provide the feedback mechanism that natural fats (such as butter, lard and beef tallow) do, so there is nothing in these manufactured fats to signal us that we are “full”.

This is why we began eating 240 more calories per day in carbohydrates –because the polyunsaturated fat that accompanied the carbs don’t tell us we’ve had enough!

The (1) the vilification of saturated fat, the (2) encouragement to eat and our acceptance and adoption of industrially produced vegetable oils and the (3) increased consumption of refined carbohydrates created the “perfect storm” and which taken together, certainly provide a reasonable mechanism with explains the massive increase in obesity from 1980 until the present.

Final Thoughts…

The different way the body processes natural saturated fats (such as butter, lard and beef tallow) versus the way it processes industrially-produced polyunsaturated fats (such as soybean oil, canola oil and corn oil) explains the mechanism by which the prevalence of obesity graph so closely mirrors the consumption of vegetable oil graph.

Trends in obesity among US Adults Aged 20-74 – Dr. Michael Eades – A New Theory of Obesity, Low Carb Breckenridge, March 4 2018
Added fats and oils compared with trends in obesity among US Adults Aged 20-74 – Dr. Michael Eades – A New Theory of Obesity, Low Carb Breckenridge, March 4 2018

Given that (1) total fat consumption has not changed since the 1960’s, only the type of fat we are eating has and (2) given that the body manufactures saturated fat in the form of palmitate, these naturally occurring saturated fats should not be thought of as “dangerous” or to underlie obesity.

As occurred late in the game with trans fats, it is time that these industrially-produced polyunsaturated fats be examined much more closely.

We ought to ask ourselves if we should even be eating oil from crops not thought of as fat-containing. If we squeeze an olive and fat comes out or we crush a nut and oil comes out, these are natural fats. Fats such as cold pressed olive oil, macadamia nut oil and walnut oil (to name a few) are natural sources of largely monounsaturated fats that are foods our ancestors (or other people’s ancestors) knew.

If “oil” needs to be produced under high pressure, high heat and with the use of solvents and deodorizers, is this even “food”? I think not.

Have questions?

Want to understand how to best nourish your body explained by someone who can make the science simple?  Please feel free to send me a note using the “Contact Me” form above.

To our health,

Joy

You can follow me at:

 https://twitter.com/lchfRD

  https://www.facebook.com/lchfRD/

Copyright ©2018 The LCHF-Dietitian (a division of BetterByDesign Nutrition Ltd.) 

LEGAL NOTICE: The contents of this blog, including text, images and cited statistics as well as all other material contained here (the ”content”) are for information purposes only.  The content is not intended to be a substitute for professional advice, medical diagnosis and/or treatment and is not suitable for self-administration without the knowledge of your physician and regular monitoring by your physician. Do not disregard medical advice and always consult your physician with any questions you may have regarding a medical condition or before implementing anything  you have read or heard in our content.

Reference

Dr. Michael Eades – A New Theory of Obesity, Low Carb Breckenridge, March 4, 2018 (NOTE: here is a similar talk given a Low Carb Down Under on August 11, 2018 and published on YouTube, called A New Hypothesis of Obesity.)

PART 1 of 2: The Evolving Hypothesis of Obesity – the role of polyunsaturated fats

This content of much this post is based on a presentation titled “A New Hypothesis for Obesity” given by Dr. Michael Eades at the Low Carb Breckenridge Conference, Breckenridge Colorado, Sunday, March 4, 2018. Dr. Eades has been in full time practice of bariatric, nutritional and metabolic medicine since 1986 and is the Director of Medi-Stat Medical Clinics, a chain of ambulatory out-patient family care clinics in central Arkansas. I have added Canadian data and photos for Canadian readers. This article is Part 1 of two on The Evolving Hypothesis of Obesity.

The current ‘obesity epidemic’ is often understood in terms of the change in the percentage of obese people in the US or Canada from the early 1950’s, through the early 1970s until today. In Canada in the early 1960s the obesity rates were 10.2% (~8% of men and ~12% of women) and in the US, obesity rates at that time were 10.7%. From 2007 to 2009, obesity in Canada rose to 24.1% and in the US, rose even more to 34.4%.

In addition to statistics, another way to understand the obesity epidemic is through historical photos. Below is a sorority photo from Louisiana from the 1950s (one of the US States that currently has one of the highest rates of obesity).

Louisiana sorority, 1950s

What about Canada?

Here’s a photo of what people looked like in 1967, riding the subway in Toronto.

toronto subway rush hour

As can be seen in another photo (below) from a Toronto rush hour, young adults, middle aged adults and older people were very slim compared to today’s standards.

toronto subway rush hour

In the 1950’s, people in US as in Canada ate carbohydrates at each meal. They ate cereal or toast for breakfast and just about every household had a toaster. Lunch was often sandwiches, as there were no microwaves to heat food up in. Potatoes were a mainstay at dinner, sometimes pasta – yet the majority of young adults and adults were slim. Of course there were always some people that were overweight. Most elementary school classes had one ‘chubby’ kid, but when one looks around the classes of today or on public transit or in stores and supermarkets, most people are considerably heavier than people in the 1950’s and 1960’s.

What happened?  What changed?

What caused overweight and obesity to all of a sudden explode in the 1970’s – and just keep rising?

A clue is in the macronutrient intake between 1971 and 2010.

Macronutrient Intake 1971-2010 – Dr. Michael Eades – A New Theory of Obesity, Low Carb Breckenridge, March 4 2018

The graph on the left above shows macronutrients (protein, fat and carbohydrate) as a percentage of calories. After 1980, carbohydrate intake went up, fat intake went down and protein remained about the same.

As carbs intake went up and fat went down (protein intake stayed about the same), people began to gain weight. But what caused people to start eating more carbs?

The graph on the right above is much more telling as it shows the macronutrient intake in grams eaten per person per day. There are only two lines on the graph because the amount of fat and the amount of protein are superimposed over each other and appear as one line. The amount of fat (in grams) and the amount of protein (in grams) is approximately 75 g  each however keep in mind that fat has 9 calories per gram and protein only has 4 calories per gram. The top line on the graph shows carbohydrate intake in grams and as can be seen around ~1976-1980 carbohydrate intake suddenly skyrocketed by ~ 240 calories per day

What made people start eating 240 calories more per day in carbohydrate?

More on this in Part 2, but the clue is in the type of fat that people began to eat.

The graph below shows the change in the type of fat that people ate from 1970 to 2010. While the total amount of fat remained relatively constant from 1970 – 2010, there was a significant change in the type of fat that people ate. From 1970 onward, there is a huge increase in the consumption of polyunsaturated vegetable oils.

Added fats and oils – 1970-2010 – Dr. Michael Eades – A New Theory of Obesity, Low Carb Breckenridge, March 4 2018

Breaking these vegetable oils down into specific types of oils, one can see that there is a huge increase in the consumption of soybean oil over this period.

Increase in soybean oil consumption 1949 – 1999 – Dr. Michael Eades – A New Theory of Obesity, Low Carb Breckenridge, March 4 2018

Where does good old Canadian “canola oil” place?

Image result for consumption of rapeseed oil 1970 to 2010
Clinical and Metabolic Effects of Altering Omega-3 and Omega-6 Fatty Acids – Dr. Doug Mann MD, Professor of Neurology, University of North Carolina, February 21 2014

The graph at the top of the illustration below is the same graph as the one above and shows that soybean oil consumption reaches 12 kg per person per year. Looking at the graph below that one, canola oil is less than 1 kg per person per year.

It’s important to remember that the per person consumption of these oils is not only the fats that people buy and use at home, but include the oils used in the food that people eat at restaurants and in pre-made foods, including baked goods. Most oils sold as “vegetable oil” are soybean oil and it finds its way into things we’d never expect to find it in. Read labels more closely and you’ll find it everywhere. It’s in peanut butter and infant formula, most  commercial salad dressings, crackers and baked goods, such as muffins.  Its what your mayonnaise is made of (even if it says that its “olive oil mayonnaise”) because soybean oil can turn two ounces of olive oil into 500 ml bottle of ‘olive oil’ mayo or salad dressing. These vegetable oils are what potato chips and tortilla chips are fried in and it’s the fat in almost all commercial bread you eat – from burger buns to wraps.  It’s everywhere!

While the total amount of fat in the diet hasn’t change over time (1970-2010), the type of fat being eaten is very different! We’re eating MUCH more vegetable oils just as the Dietary Guidelines in Canada and the US have encouraged us to do since the 1970s and at the same time, we’re eating less saturated fat from beef, pork, eggs, butter etc. As will be developed in the second part of this article, this increase in the consumption of vegetable oils and decrease in eating saturated fat has served as two sides of a dual-edged sword that has contributed to the obesity epidemic.

One of the reasons for the huge increase in the consumption of vegetable oils is the number of meals that are eaten away from home, as opposed to cooked at home. In the 1950’s and 1960’s people rarely ate out at restaurants unless there was a special occasion, or they were travelling away from home. Meals at home were cooked from scratch (there were very few ‘convenience foods’) and before the creation of vegetable shortening (Crisco®) people used lard (a saturated fat) in their pies and butter in their cakes.  Butter (also a saturated fat) was the used on potatoes and as a spread on bread but with the rationing during World War II, margarine came into use – as did vegetable shortening, which was inadvertently created when extracting fats for the industrial production of soap.

Restaurants in the 1950s and 1960s used either beef tallow or lard in their deep fat fryers, but with the change in the Dietary Guidelines in the 1970s which told us ‘saturated fat was bad for our health’, these natural fats were replaced with industrially produced soybean oil and canola oil which are extracted under high heat and pressure, with the use of solvents, bleaches and deodorizers.

Note: you can squeeze a soybean all day long and you’re not going to get any ‘oil’ out of it – same with a corn kernel or canola (rapeseed).  Gently pressing olives or nuts between one’s fingers will extract some oil so one can easily see that these are rich sources of fat. Soybeans, corn and canola require hours of industrial processing (heat, pressure and solvents) to extract ‘oil’. It has long been known that polyunsaturated omega-6 fats compete for binding sites with anti-inflammatory omega-3 fats (from fatty fish and flax seed) and as a result PUFA oils such as soybean oil, corn oil and canola oil promote inflammation in the body.

Approximately 1/2 of meals now are eaten away from home.  These could be grabbing a coffee and a pastry at Starbucks® or Tim Hortons®, eating lunch at the work or school cafeteria or picking up ready-made sandwiches at a grocery store.  Of course, this amount includes order in pizza and Chinese food, a quick bowl of Pho and any number of snacks bought away from home. The issue with these is the fat used in cooking these foods is now out of our control. Most often, soybean oil is used and behind that, canola.

Let’s take a closer look at these vegetable oils.

Linoleic content of canola oil, soybean oil compared to beef fat – Dr. Michael Eades – A New Theory of Obesity, Low Carb Breckenridge, March 4 2018

As can be seen from this chart, canola oil is 32% polyunsaturated fatty acids (PUFAs), soybean oil is 61% polyunsaturated fatty acids and beef tallow is only 4% polyunsaturated fatty acids. The issue with oils (which will be presented in part 2 of this article) is that canola oil and soybean oil are very high in linoleic acid.

Reflective of the linoleic content of our diet is that the linoleic acid content of human body fat has also increased in a dramatic linear fashion over the last 50 years. The following graph was created by researcher Dr. Stephan Guyenet, PhD (neurobiology) based on various US studies, each of which is represented by an orange dot.

Linoleic Acid in US Body Fat 1961-2008 – Dr. Stephan Guyenet

This graph indicates that as we’ve been eating a lot more linoleic acid in our diet, this is showing up as an increasing amount of linoleic acid in our bodies.  Why these polyunsaturated fatty acids (PUFAs) are being taken up so readily will become clear in Part 2 of this post, which will show the proposed mechanism.

Let’s look at the prevalence of obesity among US adults aged 20-74 from 1960-2010. In 1960-1962, obesity rates in the US were 10.7% which is very comparable to the Canadian obesity rates referred to above. From 2007 to 2009 the prevalence of obesity in the US was 34.4%, which is 10% higher than the obesity rate in Canada which was 24.1%.

[www.statcan.gc.ca/pub/82-625-x/2011001/article/11411-eng.htm]

Trends in obesity among US Adults Aged 20-74 – Dr. Michael Eades – A New Theory of Obesity, Low Carb Breckenridge, March 4 2018

Now let’s compare the above graph on obesity rates to the increased use of vegetable oils over the same period.

Added fats and oils compared with trends in obesity among US Adults Aged 20-74 – Dr. Michael Eades – A New Theory of Obesity, Low Carb Breckenridge, March 4 2018

The parallel rise in the intake of polyunsaturated fats over the same period is striking, and while we know that “correlation is not causation” (i.e. two things being related does not mean that one causes the other) one must wonder if these two factors are related, and if so, how.

The proposed mechanism between the rise in obesity and the rise in the use of polyunsaturated fats (such as soybean oil, canola oil and corn oil) is covered in Part 2,  The Evolving Hypothesis of Obesity – how polyunsaturated fats (PUFAs) make us fat.

To our good health,

Joy

You can follow me at:

 https://twitter.com/lchfRD

  https://www.facebook.com/lchfRD/

Copyright ©2018 The LCHF-Dietitian (a division of BetterByDesign Nutrition Ltd.) 

LEGAL NOTICE: The contents of this blog, including text, images and cited statistics as well as all other material contained here (the ”content”) are for information purposes only.  The content is not intended to be a substitute for professional advice, medical diagnosis and/or treatment and is not suitable for self-administration without the knowledge of your physician and regular monitoring by your physician. Do not disregard medical advice and always consult your physician with any questions you may have regarding a medical condition or before implementing anything  you have read or heard in our content.

Reference

Dr. Michael Eades – A New Theory of Obesity, Low Carb Breckenridge, March 4, 2018 (NOTE: here is a similar talk given a Low Carb Down Under on August 11, 2018 and published on YouTube, called A New Hypothesis of Obesity.)

A Dietitian’s Journey – first anniversary

Last March 5th I wasn’t feeling very well.  It had been ages since I had monitored any of the things that I was supposed to be keeping an eye on.  I had Type 2 Diabetes (T2D) for ~10 years but hadn’t checked my blood glucose in close to 2 years. I had high blood pressure, which is common for those with T2D and even though I had a quality blood pressure monitor, I hadn’t used it in about as long as I hadn’t monitored my blood sugar. Needless to say, I also had not gone to have my glycated hemoglobin (HbA1C) checked  in the same length of time which would have told me my average blood sugar the previous 3-4 months because I didn’t want to know the results. I was in classic denial and facts would interfere with my ability to keep ignoring it all. Denial is simply not thinking about something you know exists.  The problem doesn’t go away – only your conscious awareness of it does. You just don’t think about it.

This time last year I felt unwell and went and took my blood pressure.  The reading was so high it was incomprehensible.  I waited and rested for 10 minutes and took it again, however it was not much better.  It was so high that if I gone to see my doctor that day, he would have had me go to the hospital immediately, perhaps even by ambulance. Looking back, the responsible thing would have been for me to go to my doctor or to the hospital and ALSO changed my lifestyle but I knew what that would lead to; at least one or two medications for high blood pressure and they would have run blood tests at the hospital and then would have likely put me on at least one medication for Diabetes and on statins to lower my cholesterol, too and I didn’t want to do that (more denial). Two years earlier I already had blood sugar that was too high, cholesterol and triglycerides that were imbalanced and had blood pressure that was higher than it should be and was told by my endocrinologist that if I didn’t follow through with my plan of following the low carb diet that I had started at that point, that I would “be on insulin in 5 years, along with medication for high blood pressure and cholesterol“. While I had started with all the good intentions of continuing to follow a low carb lifestyle, I didn’t follow through and my health wasn’t going to get better on its own and I wasn’t living in such a way as to improve it. I was teaching others about the benefits of eating a low carb diet and helping them lose weight and lower their blood sugar and blood pressure and cholesterol but not actually doing it, myself.

My diet was well within the criteria of what Diabetes Canada says those with Type 2 Diabetes should eat; lots of whole grain, low glycemic index foods and since my meals were often below the 60 g of carbs at each of 3 meals and 45 g of carbs at snacks they recommended, I pushed the words of my endocrinologist into my sub-conscious and carried on.  I cooked and ate all home-prepared foods, but avoiding the carbs inherent in a whole-food Mediterranean diet just seemed too difficult. I couldn’t get my head around eating shinglish cheese or hummus without whole wheat pita, or lamb brochettes without the bed of basmati rice underneath. Even though I was serving these foods with beautiful low carb vegetables they didn’t offset the constant flow of carbs every few hours.

I also lived with a secret sense of futility – that achieving a normal body weight when I was obese was simply unattainable. Why even try?

In October 2015, one of my girlfriends I had known since high school and who worked in healthcare dropped dead of a massive heart attack while alone at home. A few months later another girlfriend that I’d known since my early 20’s died suddenly from what I believe was a stroke – the Monday after the Friday she retired from 30 years as a Public Health nurse. My two girlfriends being in healthcare did not protect them from the ravages of chronic health conditions and cardiovascular disease, and last March 5th I realized that being a Dietitian with a post graduate degree wasn’t going to protect me either. I actually had to change. 

That day I decided to do whatever it took to get well and live optimally and every day since then I’ve recommitted myself to that very same decision. 

When I started this journey last year, this is what I looked like:

A Dietitian’s Journey – the road to better health (March 16 2017)

Now, I look like this:

taken at Belcarra Provincial Park, February 12, 2018

So far, I’ve lost;

  • 32 pounds
  • 8 inches off my waist
  • 2 inches off my chest
  • 3 inches off my neck
  • 1 inch off my arms
  • 1/2 inch off my thighs.
  • I no longer meet the criteria for Type 2 Diabetes
  • I have blood pressure that ranges between normal and pre-hypertension
  • I have ideal triglycerides and excellent cholesterol levels.

While I’m still overweight and have approximately another 20 pounds to lose to reach a healthy waist circumference, I am not as desperately unhealthy as I was this time last year.

I am alive, much healthier and committed to continuing this journey.

The last year’s journey was not a straight-forward path as one might think given I’ve taught a low carb lifestyle to my clients for the past 3 years, as it took a bit of time to figure out which type of low carb diet my body responded to best. Everybody’s a bit different. I started out with a low carb high fat approach and a few months ago switched to a low carb higher protein approach, along the lines of what Phinney and Volek use with great results (more info on the type of low carb approaches here).

Beginning Year Two

As I planned to do when I reached this level of health, this past week I began introducing exercise into the equation, but not what I did before (what people called “cardio”).

My focus is on building muscle tissue using slow high intensity exercise (slow HIT), following the protocol of Dr. Doug McGaff. This will have the benefit of improving my insulin sensitivity, and along with eating sufficient protein distributed through the day should enable me to continue to live an active lifestyle, as I age.

Last year I was given a ‘second chance’ and I am taking it!

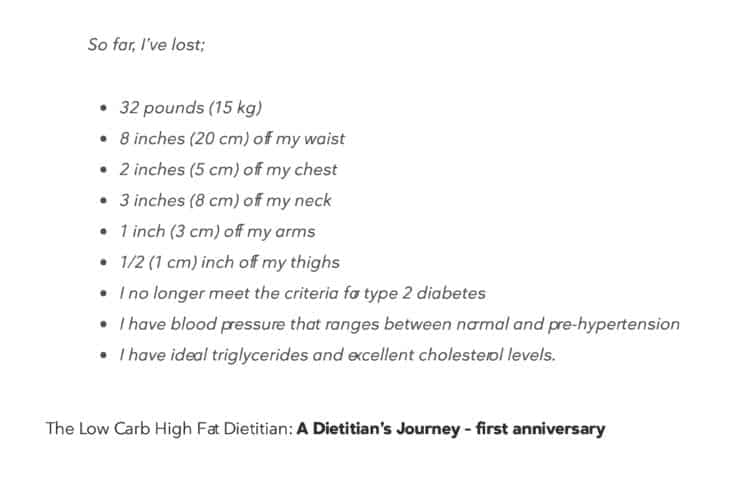
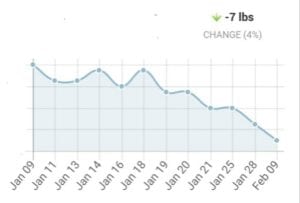
To celebrate my one year anniversary, as a ‘present’ to myself, I bought a weight bench to use with my free weights and resistance bands, and have set it up in a corner of my room.

I’ve folded up the Nordic Track for now, but can open it up to use it should I want to later. I may resume morning walks now that the sun rises earlier, mostly as a way to reduce the muscle stiffness and start the day well – but building muscle mass is, by necessity, a priority.

Motivation for Change

My journey has never been about “looking good” but about being healthy and living optimally. While looking better is a wonderful side-benefit, it is just that – a bonus.

As a Dietitian, I’ve always believed that if people “go on” a diet because they want to lose weight and look better, they will eventually “go off” a diet because there simply isn’t enough internal motivation to continue. It is way too easy to buy the tempting food that is readily available all around us – all the more when our insulin levels are high and we’re always hungry.

To change long-term requires the motivation to change.

As one of my sons says “dying is bad” and since living, and living well was my motivation for changing my lifestyle, it continues to serve as my motivation every day since.

Like many of my clients, I was at a fork in the road and had a choice;

(1) to continue to live in denial about the seriousness of these conditions (high blood sugar, blood pressure and abnormal cholesterol / triglycerides)

or

(2) to face the reality that if I didn’t significantly change my lifestyle I would probably die from one of the chronic health conditions I already had, would get, or from one of the many metabolic results of having these conditions.

I made my choice a year ago and I don’t regret it for a minute!

Are you at a fork in the road – having to choose between continuing to do the same things that haven’t worked previously or like me, ignoring it all and doing nothing?

Perhaps you’ve been told by your doctor or specialists where making such a choice may lead and you ‘don’t want to go there’, but are overwhelmed thinking of making this kind of change on your own.

I can help. I provide personalized low carb and keto services both in-person in my office and by Distance Consultation (telephone, internet).

I have both the clinical knowledge and the personal experience that a low carb lifestyle is not only entirely ‘doable’, but is entirely delightful.

There are those that maintain it’s not sustainable long term, however I know many people that have been eating this way for 15 or 20 years and so that simply isn’t true.

UPDATE: This new post titled ”Low Carb or Keto — what can you eat?” shows pictures of some of the meals that I eat (following a low carb higher protein approach) and also posts links to recipes. You’ll see that it is way more diverse than slabs of meat and piles of bacon and eggs!

I like to compare my decision to pursue a low carb lifestyle to someone that gets diagnosed with a serious food allergy such as Celiac disease. They need to avoid gluten containing foods to live without damaging their bodies and I need to avoid carb containing foods for the same reason.

Few people diagnosed with Celiac disease will walk around their whole lives complaining about how “unsustainable” it is because for them, living itself or living in good health requires them to make this adaptation, and so they do. For me and for many of my clients, choosing to follow a low carb lifestyle enables us to put chronic health conditions into remission, so we make a similar type of adaptation.

Have questions?

Wonder how I might be able to help you? Please send me a note using the “Contact Me” form above and I will reply soon.

To our good health!

Joy

You can follow me at:

 https://twitter.com/lchfRD

  https://www.facebook.com/lchfRD/

Note: I am a "sample-set of 1" - meaning that my results may or may not be like any others who follow a similar lifestyle. If you are considering eating "low carb" and are taking medication to control your blood sugar or blood pressure, please discuss it with your doctor, first.

Copyright ©2018 The LCHF-Dietitian (a division of BetterByDesign Nutrition Ltd.) 

LEGAL NOTICE: The contents of this blog, including text, images and cited statistics as well as all other material contained here (the ”content”) are for information purposes only.  The content is not intended to be a substitute for professional advice, medical diagnosis and/or treatment and is not suitable for self-administration without the knowledge of your physician and regular monitoring by your physician. Do not disregard medical advice and always consult your physician with any questions you may have regarding a medical condition or before implementing anything  you have read or heard in our content.


The Role of Protein in the Diet – importance in adults and older adults

This article is Part 3 in a three-part series on Protein and is based largely on a lecture given by Dr. Donald Layman, PhD – Professor Emeritus from the University of Illinois (Nutrition Forum, June 23, 2013, Vancouver, British Columbia, Canada).

People understand it’s important for children to eat enough protein because they’re growing but adults and older adults need to eat enough protein each day, as well.

After youth have finished growing, they are at their maximum physical capacity between age 20 and 30 years old and after the age of 30 years old, adults begin to lose muscle mass at the rate of 1% per year [1].

We’ve come to expect that as people age, they will gain more fat, loose bone mass and that they’ll have decreased muscle strength and that in time, these will lead to difficulty getting around, a greater risk of falls and eventually to physical disability. We commonly see older people with spindly legs and bony arms and we think of this as ‘normal’, but as discussed in a recent “A Dietitian’s Journey” article, we’ve mixed up what is “common” with what is “normal”.  When we look at seniors in Okinawa, Japan for example, we don’t see this. They continue to do manual jobs and practice martial arts well into their 80’s and 90’s. Aborigine elders in Australia also remain lean, fit and active as seniors. This is normal.

The physical deterioration that we associate with aging including weak bones (osteoporosis) and the loss of skeleton muscle mass (sarcopenia) don’t develop suddenly, but take place over an extended period of time – brought on by less than optimal practices in early middle age.

The Recommended Dietary Allowance (RDA) for protein is set at 0.8 g protein/kg per day and describes the minimum quantity of protein that needs to be eaten each day to prevent deficiency. Protein researchers propose that while sufficient to prevent deficiency, this amount is insufficient to promote optimal health as people age[2].

There have been several recent “position statements” issued by those that work with an aging population indicating that protein intake between 1.0 and 1.5 g protein / kg per day may provide optimal health benefits during aging [3, 4]. This seems at odds with the 2010 Dietary Guidelines Advisory Committee report [5] which states that ‘protein intake in the US is more than adequate’ and that ‘inadequate protein intake is rare’ [5]. These seemingly contradictory positions are largely due to a difference in terms of how protein adequacy is determined.

The RDA – more specifically the Estimated Average Requirement (EAR) is the minimum amount of protein intake required to prevent deficiency and is based on nitrogen balance studies (since nitrogen is the main component of the amino acids which make up proteins). The EAR is set at the amount of protein that allows the body to achieve nitrogen balance (protein making and protein breakdown is equal) and evaluates overall protein intake.  Evaluation of optimal protein intake not only considers total amount of protein eaten, but also evaluates the metabolic roles of individual amino acids. While the EAR may be enough protein for healthy younger adults, higher intakes of specific Essential Amino Acids (ones the body can’t make, e.g.  Leucine and Isoleucine and Valine) have been reported to improve body composition (muscle mass and increased strength) in older adults.

Another factor is that nitrogen balance studies look at the total amount of protein eaten in a day but don’t look at the amount of protein eaten at each meal [6,7] nor the role of the Essential Amino Acid Leucine which is  required to be present for protein synthesis to begin (including synthesis of new protein for muscle and bone)[6].  Leucine is an indispensable amino acid in the making of all types of protein, but has a unique role in signaling the beginning of muscle protein synthesis. Much research has been done with large doses of free leucine, however a 2012 animal study[6] found that in small meals with limited protein intake (often the case for older adults), that there was a specific minimum amount of Leucine required to be be present, before protein synthesis took place. This “Leucine threshold” had to be met or exceeded before the body would even begin the energy-expensive process of making new proteins!

Typically, the average American eats only 10 g protein for breakfast, 15 g protein for lunch and has most of their daily protein at supper (65 g protein at supper) and since the minimum amount of Leucine that needs to be present in a meal (i.e. “Leucine Threshold”) is not enough at breakfast and lunch with this pattern of protein intake, protein synthesis is only triggered after the evening meal. As elaborated on below, it is recommended that this change.

A 2013 study of muscle protein synthesis in adults in their late 30’s found that when the amount of protein is distributed evenly throughout the day (30 g protein at breakfast, lunch and supper) that significantly more muscle protein was made. Of importance, the (a) making of new protein and (b) the threshold at which protein will be triggered to be made differ with age – with older people needing a higher intake of protein and specifically the amino acid Leucine, than younger adults [8]. This reduced muscle protein synthesis has been called “anabolic resistance” (anabolic means to ‘build’) and studies have shown that this “anabolic resistance” can be overcome with meals containing higher amounts of Essential Amino Acids and appears to be related to the Leucine content of the meal [8]. These findings led to Dietary Recommendations for older adults that emphasize a minimum of 20 g of protein per meal containing more than 2.3 g Leucine to optimize the building of new muscle protein [4].

Final Thoughts…

It is not only growing children and youth that need to eat adequate protein daily, but older adults as well. In many Indigenous cultures, the Elders eat first and eat the best of the animal proteins – which may factor in to the preservation of bone and muscle mass we see in many of these cultures.

The average protein intake for men >20 years old in the US is ~98 g per day and for women it is 68 g per day which may be adequate in total for healthy young adults, but is considered imbalanced in terms of distribution, as a minimum amount of Leucine is required for protein synthesis (specific amount in humans has not yet be determined). Dr. Layton recommends that until further research is conducted and the optimal amount of Leucine is determined that young adults and middle aged adults distribute their protein evening throughout the day with ~25 g (women) -30 g (men) of animal-based protein at each meal. The reason high biological value proteins from animal sources (meal, poultry, fish, egg, dairy) are recommended is because these are high in Leucine (rather than having only 10 g protein for breakfast, 15 g protein for lunch and 65 g protein at supper).

The recommendations above for older adults to eat 1.0 – 1.5 g protein / kg per day distributed evening over three meals which would be on average ~30-40g of animal-based protein at each meal to provide for optimal muscle protein synthesis, preventing sarcopenia – the muscle loss we’ve come to see as ‘normal’ in aging.

How much is too much protein?

According to Dr. Layman, the Upper Limit of Protein according to the Recommended Daily Allowance for Protein is set at ~ 2.5 g protein / kg per day which would put the maximum amount for most adult men at ~200 g protein per day.

Recommended Daily Allowance (RDA) for Protein [slide from Dr. Donald Layman, PhD – The Evolving Role of Dietary Protein in Adult Health]
Have questions?

Need help determining how much protein you should optimally be eating at each meal and from what sources? Please send me a note using the “Contact Me” form and I will reply as soon as possible.

To our good health!

Joy

You can follow me at:

 https://twitter.com/lchfRD

  https://www.facebook.com/lchfRD/


References

  1. Keller K, Engelhardt M. Strength and muscle mass loss with aging process. Age and strength loss. Muscles, Ligaments and Tendons Journal. 2013;3(4):346-350.
  2. Volpi E, Campbell WW, Dwyer JT, et al. Is the optimal level of protein intake for older adults greater than the recommended dietary allowance? J Gerontol A Biol Sci Med Sci. 2013 Jun;68(6):677-81
  3. Fielding RA, Vellas B, Evans WJ, Bhasin S, et al, Sarcopenia: an undiagnosed condition in older adults. Current consensus definition: prevalence, etiology, and consequences. International working group on sarcopenia. J Am Med Dir Assoc. 2011 May;12(4):249-56
  4. Bauer J1, Biolo G, Cederholm T, Cesari M, et al. Evidence-based recommendations for optimal dietary protein intake in older people: a position paper from the PROT-AGE Study Group. J Am Med Dir Assoc. 2013 Aug;14(8):542-59
  5. U.S. Department of Agriculture and U.S. Department of Health and Human Services, Dietary Guidelines for Americans, 2010. 7th Edition, Washington, DC.
  6. Norton LE, Wilson GJ, Layman DK, et al. Leucine content of dietary proteins is a determinant of postprandial skeletal muscle protein synthesis in adult rats. Nutr Metab (Lond). 2012 Jul 20;9(1):67
  7. Mamerow MM, Mettler JA, English KL, et al. Dietary Protein Distribution Positively Influences 24-h Muscle Protein Synthesis in Healthy Adults. The Journal of Nutrition. 2014;144(6):876-880.
  8. Layman DK, Anthony TG, Rasmussen BB, et al. Defining meal requirements for protein to optimize metabolic roles of amino acids, The American Journal of Clinical Nutrition, Volume 101, Issue 6, 1 June 2015, Pages 1330S—1338S

Copyright ©2018 The LCHF-Dietitian (a division of BetterByDesign Nutrition Ltd.) 

LEGAL NOTICE: The contents of this blog, including text, images and cited statistics as well as all other material contained here (the ”content”) are for information purposes only.  The content is not intended to be a substitute for professional advice, medical diagnosis and/or treatment and is not suitable for self-administration without the knowledge of your physician and regular monitoring by your physician. Do not disregard medical advice and always consult your physician with any questions you may have regarding a medical condition or before implementing anything  you have read or heard in our content.

A Dietitian’s Journey – how old would you be?

March 5, 2018, it will be one year that I’ve been following a low carb lifestyle and today I took stock of what I’ve accomplished so far and set goals of what I will accomplish this coming year.

A year ago, I set four goals;

(1) blood sugar in the non-diabetic range

(2) normal blood pressure

(3) normal / ideal cholesterol levels

(4) a waist circumference in the ”at or below” recommended values of the Heart and Stroke Foundation

…and I wondered aloud in one of the first blogs in my ‘journey’;

“Will I meet all these goals?  Who knows?! But I won’t know if I don’t try and the alternative of a life of medication for blood sugar, blood pressure and eventually cholesterol too does not appeal to me!”

Well, its a year later and what have I accomplished?

(1) My HbA1C is below the cutoffs for a Diabetes diagnosis and much of the time my fasting blood glucose is as well.

(2) My blood pressure is in the normal range for someone with Type 2 Diabetes and half the time it is in the normal range for someone without it.

(3) I have normal / ideal HDL cholesterol and triglyceride levels and my LDL is in the normal range.

(4) I have a waist circumference that is within the recommended range set by the Heart and Stroke Foundation.

This is good, yes and I am pleased with my progress but I am not content to pat myself on the back, buy a new outfit and rest on my laurels. I have things I still want to accomplish and towards that end, I have set some new goals for the coming year – year two in A Dietitian’s Journey.

I have updated the above goals for this year. I want to have;

(1) HbA1C that is in below the high end of the normal range (i.e. < 5.5 % instead of 6.0%) and to consistently have fasting blood glucose that is also below the high end of the normal range (i.e. ≤ 5.0 mmol/L | 90 mg/dl instead of 5.5 mmol/L | 99 mg/dl),

(2) blood pressure that is in the normal  range for healthy adults without Diabetes,

(3) normal to ideal triglyceride and cholesterol levels – as good, or better than currently,

(4) a waist circumference to be half my height based on research covered in an earlier article,

(5) I want to be fit.

So what is “fit“?

I think that most people think of fitness in terms of what is usual for people of the same age and gender. If that’s the case, I definitely do NOT want that!

I want to be fit enough to shovel the snow off my driveway without needing a break. I want to be fit enough to carry in two 20 kg bags of salt myself – one in each hand.  I want to chop the firewood for my fireplace and stack it myself and I want to be able to change the tire on my car myself, if need be. I can do those things now, but I want to keep being able to do that as the years go on.  I don’t want to be one of those “women of a certain age” that sit in a chair doing “seniors fitness”! I want to be able to manage a resistance or weight training workout of women half my age, when I am in my 60’s and 70’s. Heck I want to live a full and productive life like I do now, when I’m “old”.

My grandmother and I

My grandmother lived until the age of 104 years and was in good health until a few months before she died and like many seniors, it was a ‘fall’ that began the health failure cascade that eventually ended her life.

If I begin strengthening my muscles now, I won’t become one of those frail seniors with spindly little legs. That’s what I mean by “fit”.

With the encouragement of a few doctors that I know that are quite a bit younger that I am, but considerably more knowledgeable in this area, I’ve decided to get fit following two main recommendations;

(1) eat sufficient protein to prevent sarcopenia, the visible loss of muscle mass and strength that is commonly associated with aging

and

(2) to practice high intensity training (HIT) to build up my muscles, so that they are the healthiest they can be for my age.

Something I have learned by listening to the lectures of Dr. Donald Layman (on protein requirement as we age) and to Dr. Doug McGuff (on strength training for health and longevity) is that what is common as people age is not what is normal

It is common in our society to see older adults with muscle loss, however when we look at seniors in other cultures, this is not normal.

Okinawan senior woman, farming

The seniors of Okinawa, Japan for example continue to do manual jobs and practice martial arts well into their 80’s and 90’s and the aborigines of Australia remain lean and fit as seniors.


Aborigine senior

This is “normal“.


We’ve confused “common” with “normal” and instead of visualizing seniors exercising looking like this;

Okinawan man practicing karate

…all too often, we picture this:

“seniors exercising”
“Weight training in your twilight years” – Global News

An article last year on Global News titled “weight training in your twilight years” had the picture to the left accompanying it – as if all one can reasonably expect from a woman in her 60’s is to be able to lift a 1 pound weight.

No, that is not fitness.


…which brings me back to my last goal. I want to be ‘fit’ the way it is normal to be fit – not what is commonly viewed as fitness for “women of a certain age”.

I want to eat optimally and function optimally because anything else is less than what we were created to do and be. This means continuing to eat low carb because as someone who met all the criteria for Metabolic Syndrome, including obesity, Type 2 Diabetes, high blood pressure and high cholesterol, this is what it will take to keep those diseases and disorders in remission. It also means strength training my muscles and eating sufficient protein to accrue new muscle – not to become a body builder, but to be a fit woman.

Final Thoughts…

In the lecture given by Dr. Doug McGuff on strength training for health and longevity that I watched, he told the story of Satchel Paige (1906-1982), considered the best pitcher in baseball history and who began pitching at the age of 42 years.

One of the quotes he is renowned for happens to hang on the wall in my client bathroom and reads;

“How old would you be if you didn’t know how old you are?”

– Satchel Paige


My grandmother was often mistaken for a woman 20 years her junior right up until the last year or two of her life because she didn’t “act old”.  She lived in an apartment for seniors and cooked her own porridge each morning and in good weather walked to the local shopping center two blocks away until she was a centenarian.

I want to be that kind of senior!

And so, as I close off the first year of A Dietitian’s Journey, I begin the second with goals having been met and new ones to be achieved.

So let me ask you this, “how old would you be if you didn’t know how old you are?”.

Have questions about how I can help?

Please send me a note using the “Contact Me” form above.

To our good health!

Joy

If you would like to read well-researched, credible ”Science Made Simple”  articles on the use of a low carb or ketogenic diet for weight loss, as well as to significantly improve and even reverse the symptoms of Type 2 Diabetes, high cholesterol and other metabolic-related symptoms, please  click here.

You can follow me at:

 https://twitter.com/lchfRD

  https://www.facebook.com/lchfRD/


Copyright ©2018 The LCHF-Dietitian (a division of BetterByDesign Nutrition Ltd.)

LEGAL NOTICE: The contents of this blog, including text, images and cited statistics as well as all other material contained here (the ”content”) are for information purposes only.  The content is not intended to be a substitute for professional advice, medical diagnosis and/or treatment and is not suitable for self-administration without the knowledge of your physician and regular monitoring by your physician. Do not disregard medical advice and always consult your physician with any questions you may have regarding a medical condition or before implementing anything  you have read or heard in our content.

Unreliability of Many Blood Glucose Monitors – cause for concern

Yesterday morning, as I always do, I tested my morning fasting blood glucose with my glucometer. As someone with Type 2 Diabetes, this helps me understand the effect that the food I had for supper may have had and also helps guide me as to whether I may begin the day with time-delayed eating. For Type 1 Diabetics or insulin-dependent Type 2 Diabetics however, the accuracy of this information is critical! They base the dosage of insulin they take on this data and count on it being reliable and accurate.

Accuracy is how close the reading on the meter is to the actual blood glucose value and reliability is the likelihood of repeating the measure with the same meter at the same time and getting the same result.

Yesterday, I swabbed by thumb with an alcohol wipe, let it dry and took my blood 
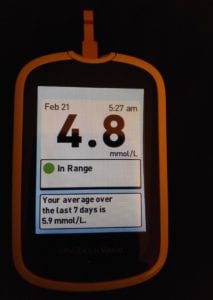
glucose reading at 5:27 am and got a reading of 4.8 mmol/L (86 mg/dl) and thought “that can’t be!“, as I know that is a blood sugar reading that I only obtain after more than 18 hours of fasting.


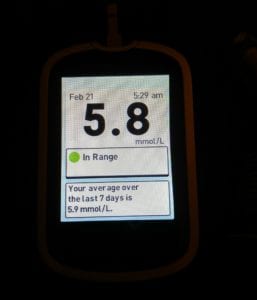
I got another test strip from the same vial (recently opened and not expired) and tested the same thumb in a location immediately beside where I had just tested and got a reading of 5.8 mmol/L (105 mg/dl) and thought “that seems more reasonable, but what’s with the meter?”.

Ironically, only several hours prior a physician-friend sent me the link a report from August 14, 2017 that indicated that only 6 out 18 blood glucose meters tested passed the standard for meter accuracy which is for them to be within 15% or 15 mg/dl (0.8 mmol/L) of the laboratory value in 95% of 100 trials. That means there was only a 1/3 pass rate!

Naturally, the first thing I did was look up to see how my meter – actually both my meters (which are identical) ranked.  It failed!


Even though I had brought my glucometer to the lab with me in July when I last had my fasting blood glucose measured and it matched the lab results exactly, my meter failed the test because when tested 100 times, it was NOT accurate 95% of the time.  

To pass a meter had to match or be within 15% or 15 mg/dl (0.8 mmol/L) of the laboratory value on 95/100 trials.

I only tested my meter against the lab value ONCE and assumed it to be accurate. It was accurate on that one occasion, but it was not reliable, because when repeating the measure 100 times with the same meter it did not produce results within the 15% acceptable variation.

At 5:27 AM my blood glucose reading was 4.8 mmol/L and 2 minutes later with a new strip it was 5.8 mmol/L – on the same meter. That is a huge amount of variation, although depending on what the lab value actually would have been at that time, the results may or may not have fallen with range (see box below).

NOTE: The average of the two readings, 4.8 & 5.8 is 5.3 mmol/L and a ±15% tolerance would be ± 0.795 or ~ ± 0.8, for a range of 4.5 mmol/L to 6.1 mmol/L, so the readings would be within that range, ASSUMING the AVERAGE is the CORRECT result. While 0.8 is +16.7% more than the lower result and -13.8% less than the higher result, the actual ± 0.5 deviation from the mean is +10.4% and -8.6% of the lower & upper results. If either one result was correct, then 4.8 x 1.15 = 5.52 mmol/L, while 5.8 x 0.85 = 4.93 mmol/L, so the other would be erroneous. But, 4.8 í· 0.85 = 5.65 mmol/L, and  5.8 í· 1.15 = 5.04 mmol/L, so if the laboratory serum reading fell between 5.04 and 5.65 mmol/L then the meter’s two readings would be accurate to within ±15%. Now ± 15% is 30% of the value which means that (a) A serum glucose of 3.5 mmol/L (low end of normal) could mean a glucometer reading range of 1.05, or 3.04 mmol/L to 4.12 mmol/L A serum glucose of 11 mmol/L (way too high!) would be a 3x larger range of 3.3, or 9.56 mmol/L to 12.94 mmol/L. [thanks to Dr. L De Foa for the calculations]

Unfortunately, I know that my device(s) are not reliable based on this study data and for people who are insulin-dependent Type 1 or Type 2 Diabetics, they rely on the readings from their blood glucose monitors in order to dose their insulin. When their meters have been proven unreliable, it is cause for major concern.

I am reproducing the main data from this study because it is imperative that people know whether the monitor they are relying on is indeed, reliable.

Overall Results of Blood Glucose Monitoring Systems – Diabetes Technology Society 2018

The full testing protocol and results can be found here.

The rated accuracy from Bayer of the number one rated meter above, the Contour Next USB is 100% within ±0.56 mmol/L for glucose < 5.55 mmol/L and 98.1% within ±10% and 100% within ±15% for blood glucose > 5.55 mmol/L and it was accurate 100% of the time in the tests.

As for me, I have gone back to using a glucometer that I had on hand (which also tests blood ketones), as it is one of the models that passed.

While I am left with almost 1/2 a package of new test strips from the unreliable meter, how much worse could it be for someone who is dosing insulin based on unreliable blood glucose meter reading.

Type 2 Diabetes?

If you have Type 2 Diabetes and have struggled to lower your HbA1C or achieve your weight loss goals and have wondered whether a low carb approach might be helpful for you, why not have a read through some of my other articles documenting the science behind this type of lifestyle.

Eating low carb for Diabetics is hardly a new “fad” but was the standard approach before the discovery of insulin, and has proven to be a very safe and effective approach.

Have questions?

Please send me a note using the “Contact Me” form above and I’ll be happy to reply.

To our good health!

Joy

You can follow me at:

 https://twitter.com/lchfRD

  https://www.facebook.com/lchfRD/


Copyright ©2018 The LCHF-Dietitian (a division of BetterByDesign Nutrition Ltd.)

LEGAL NOTICE: The contents of this blog, including text, images and cited statistics as well as all other material contained here (the ”content”) are for information purposes only.  The content is not intended to be a substitute for professional advice, medical diagnosis and/or treatment and is not suitable for self-administration without the knowledge of your physician and regular monitoring by your physician. Do not disregard medical advice and always consult your physician with any questions you may have regarding a medical condition or before implementing anything  you have read or heard in our content.

New Low Fat versus Low Carb Diet Study – when a tie is not a win

A new one-year study from Stanford University[1] was released February 20, 2018 and reports that low carb diets are no better than low fat diets for losing weight. On one hand, such a conclusion seems like progress when the debate used to be whether low carb diets were “dangerous” – now it’s whether low fat diets are as good as low carb diets.

The conclusion that there was no significant difference in weight loss between a low fat diet and a low carbohydrate diet sounds good on the surface, however closer examination of the methodology indicates that the ‘low carb’ intervention group was only low carb  (≤ 20 g of carbs per day) for the first 8 weeks of a the one year study. After that subjects were instructed to “add carbs back in until they reached the lowest level they believed they could maintain indefinitely. This resulted in subjects in the ‘low carb group’ eating ~100 g carbs per day at 3 months and at the end of the study were averaging 130 g carbs per day ; hardly a ‘low carb’ diet!

The American Diabetes Association (ADA) in its Clinical Practice Recommendations [3] and  Standards of Medical Care in Diabetes [4]  already approves of a 130 g / day intake of carbohydrate as a weight-loss option for those with Type 2 Diabetes in what it calls a ‘low carbohydrate’ diet (more in this article).

The ‘low fat’ intervention group in this study ate an almost equivalent amount of fat and carbohydrate (48% carbohydrate and 29% fat) as the standard ‘low fat diet’ recommendation of the American Diabetes Association, so the fact that they didn’t find a difference between the two groups should come as no surprise, given that the ADA has already concluded that both are equally effective for weight loss (see quotations below).

Keep in mind when you read the quotes below, what the American Diabetes Association defines as “a low carbohydrate diet” is 130 g carbohydrate per day, which is the same as the average intake of carbohydrates at a year in this study. The amount of 130 g carbs per day is a moderate-low carbohydrate diet when compared with the the intake of the first 8 weeks in the study (≤ 20 g carbs / day) and in light of the fact that the average adult US intake is almost 300 g carbs per day.

”The evidence is clear that both low-carbohydrate* [i.e. moderate low carbohydrate] and low-fat calorie restricted diets result in similar weight loss at one year. We’re not endorsing either of these weight-loss plans over any other method of losing weight.  What we want health care providers to know is that it’s important for patients to choose a plan that works for them, and that the health care team support their patients’ weight loss efforts and provide appropriate monitoring of patients’ health.”

– Dr. Ann Albright, RD, President, Health Care & Education, American Diabetes Association, Clinical Practice Recommendations [3]

“For weight loss, either low-carbohydrate* [i.e. moderate low carbohydrate] or low-fat calorie-restricted diets may be effective in the short-term (up to 1 year).”

– Summary of 

In actuality, this “new study” didn’t find anything “new”.

Both the ‘low fat’ and ‘low carb’ [i.e. moderate low carb] groups were instructed to “avoid sugar and refined carbohydrates” but the absolute level of carbohydrate in the ‘low fat’ diet group was not held constant. The
‘low fat’ group actually lowered its carbohydrate intake over the course of the year-long study – from ~242 g carbohydrate per day at the beginning to between 205 g and 213 g carbohydrate per day. This means that the difference  between the two study groups when it came to the level of carbohydrate was decreasing. No wonder there was no significant difference found.

DIETFITS – carbohydrate intake between groups

Final thoughts…

This was not really a study between a ‘low carbohydrate’ diet and a ‘low fat’ diet with fixed grams per day of carbohydrates in each group. This was a study between a flexible moderate carbohydrate diet and a flexible moderately-low carbohydrate diet.

In fact, this “new study” ended up comparing the two diets that have already been approved by the American Diabetes Association and which the ADA has already concluded that neither is more effective than the other for weight loss.

Hardly new.

You can follow me at:

 https://twitter.com/lchfRD

  https://www.facebook.com/lchfRD/

References

  1. Gardner CD, Trepanowski JF, Del Gobbo LC, Hauser ME, Rigdon J, Ioannidis JPA, Desai M, King AC. Effect of Low-Fat vs Low-Carbohydrate Diet on 12-Month Weight Loss in Overweight Adults and the Association With Genotype Pattern or Insulin Secretion – The DIETFITS Randomized Clinical TrialJAMA. 2018;319(7):667—679.
  2. American Diabetes Association, Adjusting the Meal Plan, http://www.diabetes.org/mfa-recipes/2017-07-adjusting-the-meal-plan.html
  3. Dairman T., Diabetes Self-Management, ADA’s New Guidelines OK Low-Carb Diets for Weight Loss, 2008 Jan 7,  www.diabetesselfmanagement.com/blog/adas-new-guidelines-ok-low-carb-diets-for-weight-loss/

Copyright ©2018 The LCHF-Dietitian (a division of BetterByDesign Nutrition Ltd.)

LEGAL NOTICE: The contents of this blog, including text, images and cited statistics as well as all other material contained here (the ”content”) are for information purposes only.  The content is not intended to be a substitute for professional advice, medical diagnosis and/or treatment and is not suitable for self-administration without the knowledge of your physician and regular monitoring by your physician. Do not disregard medical advice and always consult your physician with any questions you may have regarding a medical condition or before implementing anything  you have read or heard in our content.


Curious About Keto?

There isn’t one “keto diet” but rather there are a few different approaches to eating low carb diet that can each be done ketogenically (or “keto”).

Ketogenic diets are used for a variety of clinical conditions, including seizure disorder and epilepsy, specific kinds of cancer, Polycystic Ovarian Syndrome (PCOS), non-alcoholic fatty liver (NAFL) as well as insulin resistance associated with Type 2 Diabetes and Pre-diabetes. It is also sometime prescribed by people’s physicians for use prior to or following bariatric surgery or for weight loss prior to other kinds of surgery.  A well-designed ketogenic diet is not for ‘rapid weight loss’ but for gradual, sustainable long-term weight loss.

Ketosis is the state where a person is burning primarily fat and using ketones to fuel their body rather than using primarily glucose from carbohydrate for that purpose. There are essential fatty acids (fats) and essential amino acids (building blocks of protein) but there are NO essential carbohydrates. The little bit of glucose that the body needs can easily be made from fat or protein in the diet. Ketosis is hardly an usual state, but something everyone experiences when there is a long gap between meals or when they are sleeping.

What makes a low carb diet “keto” is the amount of carbohydrate in grams compared to the amount of total energy in the diet. Since each person’s toleration of carbohydrate is different, how much one can eat and be in “ketosis” varies.

Not all Keto diets result in weight loss

People mistakenly assume that a “keto” diet is automatically a weight loss diet and that’s incorrect. The ketogenic diets that are used in seizure disorder, epilepsy and in the treatment of specific type of cancer and in some forms of dementia that are designed to not result in weight loss.

What makes a diet ketogenic is the amount of carbohydrates, however the amount and types of protein eaten and the amount and types of fat eaten have a large effect on the amount and speed of weight loss. Depending on a person’s health goals and the presence of any medical or metabolic conditions, the ratio of protein to fat will vary.

Is a keto diet one-size-fits-all?

Outside of the clinical application in seizure disorder, epilepsy and cancer , ketogenic diets also have application in Type 2 Diabetes and pre-Diabetes. In these situations, each person’s ability to tolerate carbohydrate is different depending whether they are insulin sensitive, insulin resistant or Type 2 Diabetic. How much carbohydrate each person can eat and still be in ketosis also varies, too.  Someone who is insulin sensitive for example, can eat considerably more carbohydrate than someone who is insulin resistant  without causing a spike in their blood glucose level, accompanied by the release of insulin. For those who are Type 2 Diabetic, both the degree of insulin resistance and the length of time they’ve been Type 2 Diabetic will affect the amount of carbohydrates they can tolerate.

I like to use the analogy of ‘lactose intolerance’ to explain how some people can tolerate more carbohydrate than others.  Some people who are lactose intolerant can manage to drink and eat milk products, provided the  quantities are small and the person doesn’t have it too often. Others who are lactose intolerant can’t even tolerate a small amount of lactose without symptoms. Carbohydrate intolerance is similar.  People who are insulin sensitive or only mildly insulin resistance will be able to tolerate more carbohydrate than those who are very insulin resistant or have had Type 2 Diabetes a long time.

The average intake of carbohydrate in the Canadian and American diet is ~ 300 g per day, which is a lot!  People who are insulin sensitive or mildly insulin resistance may do very well lowering their carbohydrate amount to a moderate ~130 g per day where as others who are ore insulin resistant will very likely need to eat less than that in order to begin to see an effect.

Factors that can affect how much carbohydrate a person beginning to eat a low carb diet include gender (whether they are men or women) and whether they are insulin sensitive or insulin resistant (IR) and to what degree, and whether they have Type 2 Diabetes (T2D). How long a person has been insulin resistant or Diabetic also factors into how much carbohydrate they may be able to tolerate.

Everyone is different and because of this, there is no one way to “keto”.

Different ways to “keto”

There are a few different approaches to eating low carb diet that can each be done ketogenically or “keto”. Three common approaches are;

(1) low carb, higher protein, high fat
(2) a low carb, moderate protein, high fat approach

(3) a higher protein lower fat intake during weight loss, then a moderate protein high fat intake during weight maintenance

Each of the above types of low carb diets can each be done “keto”- with the amount of carbohydrate being individualized based on a person’s gender (male or female) and whether they have any metabolic conditions (including IR or T2D). What is appropriate for each person depends on their clinical conditions, health goals and will vary person to person, depending on their personal food preferences.

Going at it alone

While some people set out to “eat keto” on their own or by following a ‘diet book’ they’ve bought, it can be dangerous for people taking any kind of medication to manage blood sugar or blood pressure to do this. Decreasing carbohydrates suddenly can result in a dramatic drop in blood sugar and/or blood pressure which, depending on the medication that people may be taking, can be very risky. Some types of medication for blood sugar may result in blood sugar dropping too low when following a low carb diet and for people taking medication for high blood pressure, blood pressure can become too low. For people taking these kinds of medications eating a low carb or ketogenic diet must be done with a doctor’s oversight and should ideally be done with a knowledgeable Dietitian such as myself who can decrease carbohydrates gradually, while the person monitors their blood sugar and/or blood pressure daily.

Even for those not on medication, it is also important that people ensure that they are eating a nutritionally adequate diet, not just a low carb or ‘keto’ one. This is where having the help and support of a Dietitian such as myself comes in.

A little bit about me…

I’ve been helping others eat a low carb diet for about 3 years now through my private practice, BetterByDesign Nutrition Ltd. which has been in business for more than a decade providing in-person and remote services to people in the Lower Mainland of Vancouver and beyond.

Since March 5, 2017, I have been eating a low carb (and more recently a keto diet) myself and in May of last year, I opened the LCHF-Dietitian division  to focus on helping people manage a number of health conditions by following a low carb or ketogenic lifestyle.

The photo collage below is of me. The frame on the left was what I looked like when I first learned about a low carb diet, the middle frame is of me in October of 2017 and the frame on the right is what I look like now.
Me on the left 2 1/2 years ago, 4 months ago in the middle, on the right now

I used to be an obese Dietitian with high blood pressure, high cholesterol and 10 years as a Type 2 Diabetic and am now in partial remission from these, as I continue my weight loss journey. You can read my personal story under “A Dietitian’s Journey” on the blog, under the Food for Thought tab.

Also in the blog are articles written about the science behind following a low carb and ketogenic lifestyle, under the category Science made Simple.

Have questions about how I can help you?

Please send me a note using the ”Contact Me” form.

To our good health!

Joy

You can follow me at:

 https://twitter.com/lchfRD

  https://www.facebook.com/lchfRD/

Copyright ©2018 The LCHF-Dietitian (a division of BetterByDesign Nutrition Ltd.)

LEGAL NOTICE: The contents of this blog, including text, images and cited statistics as well as all other material contained here (the ”content”) are for information purposes only.  The content is not intended to be a substitute for professional advice, medical diagnosis and/or treatment and is not suitable for self-administration without the knowledge of your physician and regular monitoring by your physician. Do not disregard medical advice and always consult your physician with any questions you may have regarding a medical condition or before implementing anything  you have read or heard in our content.

A Dietitian’s Journey – changes and progress

A month ago I made some changes in the macro distribution of protein to fat in my Meal Plan which has resulted in some significant progress in terms of weight loss, as well as inches lost.

Weight loss since increasing ratio of protein:fat

I knew that my weight had been decreasing about 1/2 pound a week over the previous several months, and in only the last month I had lost 7 pounds and an inch off my waist since I had increased my protein to fat ratio – that’s more than 1 1/2 pounds per week! 

Over the long weekend, one of my sons took a cell phone picture of me when we were at Burrard Inlet, and he took a few to make at least one came out. This was a  good thing because I would have thought that maybe it was just one photo or the camera angle that made me look slimmer.  No, it wasn’t the camera angle, but the change in my weight over the last few months. It wasn’t until I saw a picture of what I looked like that I could ‘see’ it more objectively.

Here is the photo:

photo taken February 12 2018

When I got home, I remembered that in October I was out at the same location and had a photo from that day. That was 7 months into me following a low carb / ketogenic lifestyle.

I also had a photo of me from 2 1/2 years ago (taken around the time I first learned about the clinical benefits of following a low carb lifestyle) that was also taken in the same location.

Here are those three photos side by side:

Me on the left 2 1/2 years ago, 4 months ago in the middle, on the right now

I am not yet at my goal weight – which will be when my waist circumference is half my height, but I am well on my way.  For me, changing the ratio of my  ‘macros’ (short for ‘macronutrients’ i.e. protein, fat, carbohydrate) has helped overcome a slow and often stalled weight decrease.

Currently, what is working very well is for me is for me to plan my meals around getting sufficient protein and what is ‘sufficient’ is based on research regarding what older adults need to prevent sarcopenia (loss of muscle mass) as they age, as well as to continue to build muscle mass which helps improve insulin sensitivity.

Instead of focusing on how much and what types of fat are in my meals, I now set my attention around getting my individual need for 1.5 g protein / kg of ideal body weight. I eat the natural fat that is found in my protein source (skin on fatty fish or chicken, yolk in egg, etc.) but don’t ‘add’ much fat to my meals, except for maybe a little olive oil on salad. I eat the carbohydrates that come naturally in non-starchy vegetables and the nuts and seeds that I regularly eat, up to my carbohydrate maximum (or “carb ceiling”) for the day. For me, based on my significant degree of insulin resistance, this is working very well – but everyone is different.

My Meal Plan looks different than the Meal Plans I design for my clients because we all have different needs.  Some people are overweight but insulin sensitive, others are normal body weight and insulin resistance and many already have Type 2 Diabetes (T2D).  Even comparing my Meal Plan with those of my clients with T2D, mine is different because my ability to tolerate carbohydrate is very low. Think of the ability to tolerate carbohydrates for those who are insulin resistant like lactose intolerance to those who are lactose intolerant. Some people can drink some milk and be okay, whereas others are unable to tolerate even a small amount.

Something to keep in mind is that having a Meal Plan doesn’t mean it is ‘carved in stone’. Our physiological needs change as we lose weight and for those who are insulin resistant or T2D, as our level of insulin sensitivity improves over time which is why  Meal Plans needs to be modified as weight loss progresses. As well, sometimes we benefit by a tweaking of the ‘macros’ (as I did with mine) to enable a more sustained and consistent weight loss.

Remember that everybody’s journey is different, because we all start from a different place.

As a result of the photo taken of me this past weekend, I have some thoughts about how we can use photos to chart our progress. While clinically, we measure our success in weight and inches lost and improved laboratory test results, often the way we as individuals can best recognize and celebrate our success is by seeing photos of ourselves over time.  Don’t get me wrong, when I was obese I hated seeing photos of myself but now seeing them serves as a “sign post” of the progress I’ve made on my journey. Now, the very photos I detested I post on the internet for all to see, because I am now well on the road to much better health; with normal cholesterol and triglycerides, normal blood pressure and blood sugar levels that no longer meet the criteria for Type 2 Diabetes.

I certainly haven’t “arrived”, but today I take a moment to celebrate that progress, as I encourage my clients to do.

Have questions as to how I can help you achieve your health and nutrition goals? Please send me a note using the “Contact Me” form located on the tab, above.

 To our good health,

Joy

You can follow me at:

 https://twitter.com/lchfRD

  https://www.facebook.com/lchfRD/


Copyright ©2018 The LCHF-Dietitian (a division of BetterByDesign Nutrition Ltd.)

LEGAL NOTICE: The contents of this blog, including text, images and cited statistics as well as all other material contained here (the ”content”) are for information purposes only.  The content is not intended to be a substitute for professional advice, medical diagnosis and/or treatment and is not suitable for self-administration without the knowledge of your physician and regular monitoring by your physician. Do not disregard medical advice and always consult your physician with any questions you may have regarding a medical condition or before implementing anything  you have read or heard in our content.


A Dietitian’s Journey – benchmarking my results

As I’ve been saying from the beginning, my data is “a sample-set of one” (n=1), but yesterday data from 218 subjects that followed a low carb ketogenic diet for one year was published, so now I have something to compare my data with. Like the subjects in the study, when I began on March 5 2017, I was obese and had been diagnosed with Type 2 Diabetes more than a decade ago. The comparison between my results and those of subjects in this study is very encouraging!

Method Comparison

Carbohydrate Intake

Subjects in the study typically ate <30 g total dietary carbohydrates per day, whereas I ate 50 g of net carbohydrates per day which is approximately ~65 g of total carbohydrate per day for the first 5 months (more than double the amount of carbohydrate of those in the study). Most of these carbs came from berries and nuts.

It became clear through lab tests (fasting insulin along with fasting blood glucose) that I was quite insulin resistance and that level of carbohydrate intake was not providing me with the reduction in blood glucose I was seeking. It is only in the last 6 months that I lowered my carbohydrate intake to the level of those in the study and began to see significant progress.

Protein Intake

Subjects in the study had their protein intake targeted to a level of 1.5  / kg based on ideal body weight.

Until very recently, my protein intake was at 1.0 g / kg based on ideal body weight (which is at the minimum level of protein intake) and the bulk of my intake was from fat.

Vegetable Intake

Just as subjects in the study, I ate 3-5 servings of non-starchy vegetables per day.

My 11-month outcomes compared with 1-year data from the study

Blood Glucose Levels

At baseline, the average HbA1c level of participants in the study was 7.6% ±1.5%, with less than 20%  of participants having a HbA1c level of <6.5% (with medication usage).

As I documented in my one-month update, I didn’t measure my HbA1C at baseline, but there are clinical calculators for estimating that from blood glucose levels. From laboratory tests, my fasting blood glucose the previous three years was 7.9 mmol/L (Feb 2013), 9.1 mmol/L (Sept 2014) and 9.7 (Aug 2015). Extrapolating that data to the start of my journey (March 5 2017) brought it to approximately 12 mmol/L. As documented in an earlier progress update, four months into eating low carb high fat, my fasting blood sugar was averaging 8.5 mmol/L.

Here is a graph of my blood sugar levels the first few weeks;

My blood sugar levels a month after starting my journey
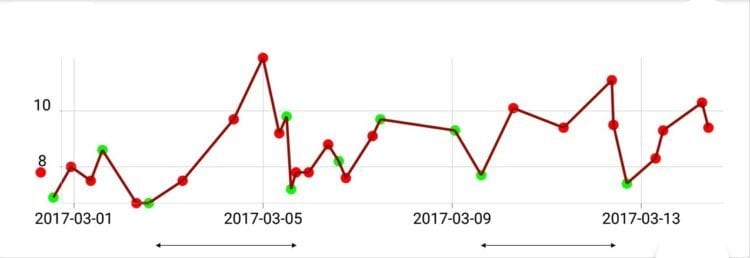
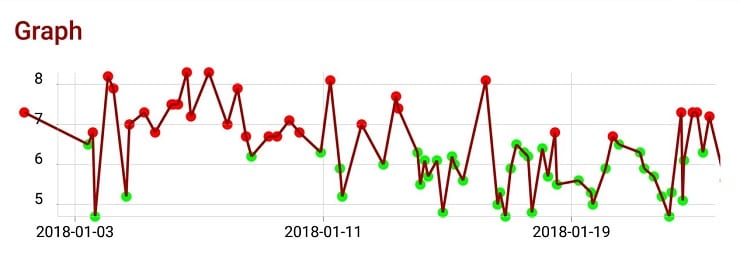
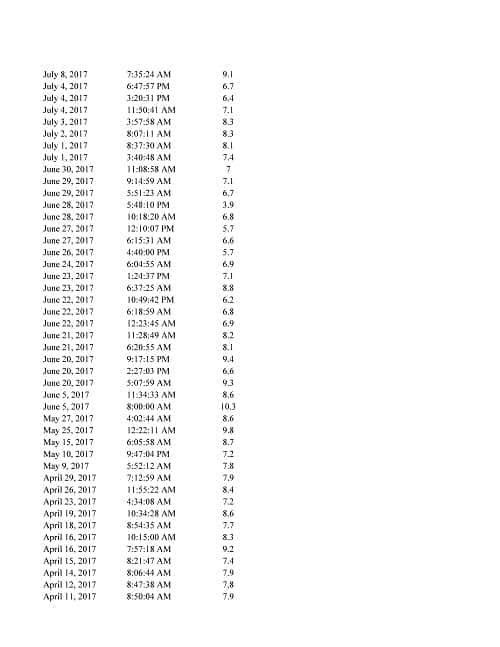
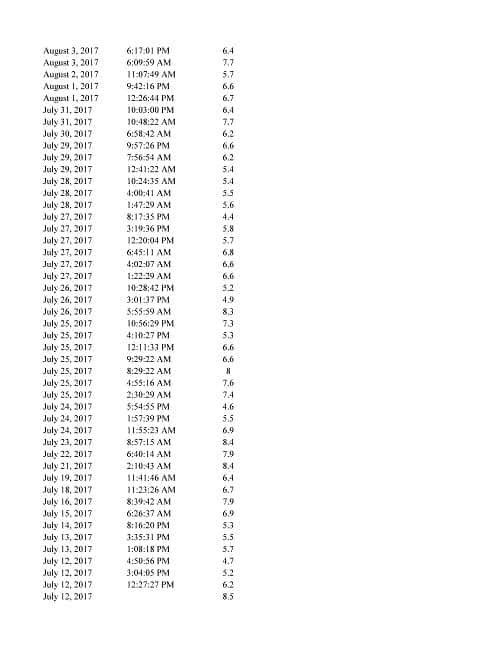
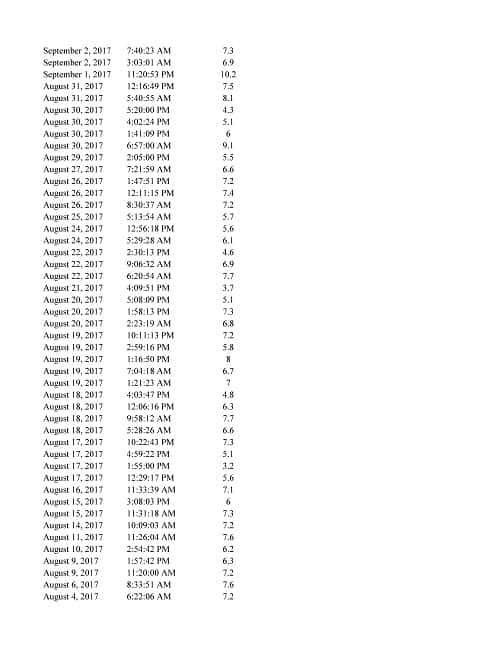
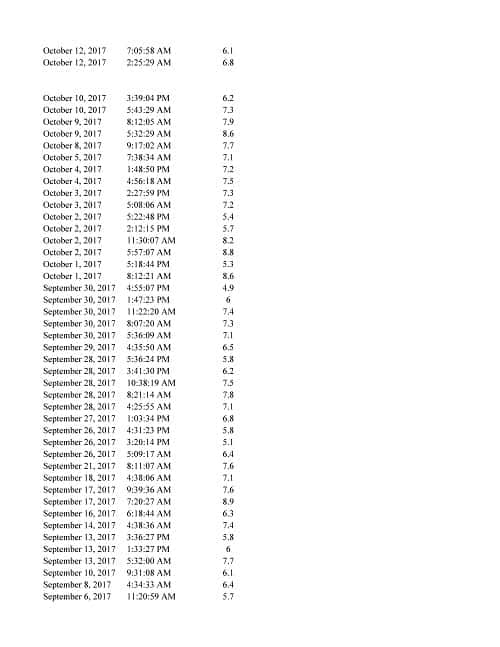
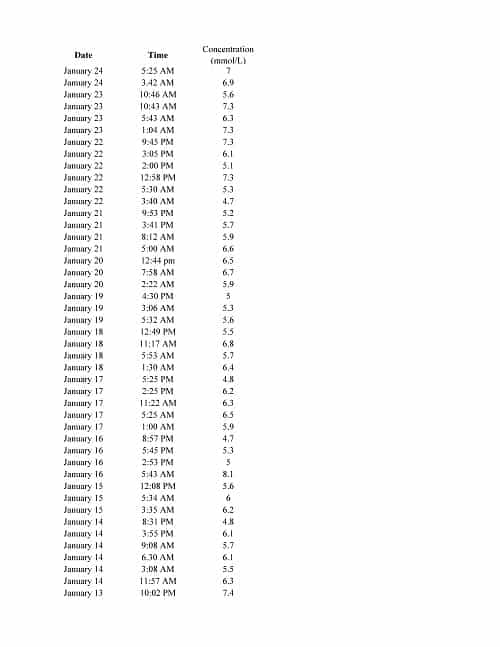
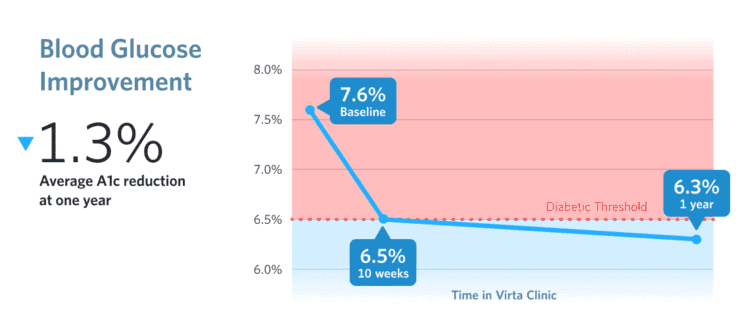
As can be seen from the graph, my blood glucose was at lowest at 7.7 mmol/L (see photo to the left) and I had spikes well above 10 mmol/L, and I was averaging around 8.5 mmol/L over the course of the day – which is slightly higher than the average of those in the study.

On average after 1 year, participants in the study lowered HbA1c from 7.6% to 6.3% — which is in the sub-Diabetes range. A month ago, my laboratory HbA1C came back at 6.4% and in the last month, I am averaging 6.33%.

My average blood glucose readings the last two weeks

My highest ‘spikes’ are just above 7 mmol/L whereas at the beginning they were closer to 10 mmol/L.

Weight Loss

At one year, mean body mass reduction of participants in the study was 12% of their initial body weight, with an average of 30 pounds lost.

Average Weight Loss at One Year [from Effectiveness and Safety of a Novel Care Model for the Management of Type 2 Diabetes at 1 Year: An Open-Label, Non-Randomized, Controlled Study.]
At only 11 months, my body mass reduction has been 17% of of my initial body weight, with 35 lbs lost. Even eating a much higher fat diet for most of my journey and more carbs for the first 5 months, my weight loss so far has been better than the average of those in the study.

Other Metabolic Markers

At 10 months, participants in study experienced a 20% reduction in  their triglycerides levels and after one year, reduction in triglycerides was at 24%.  After one year, LDL increased on average by 10% however HDL increased on average by 18%.

My triglycerides dropped from .95 to .64 from the last time I had them checked in 2015 (with no change in diet until March 2017), which is a decrease of 33%, which is even better than the average 24% subjects in the study obtained. My LDL dropped from 3.26 to 2.60, which is a decrease of 20% – even better than the average of 18% from the new 1-year study data.

My HDL was previously good as I ate a liberal carb Mediterranean diet and not a standard American / Canadian diet, so it only rose 3% (from 1.91 to 1.97) from the last time I had it checked, however with the drop in my triglyceride levels, my TG:HDL ratio is now 0.32 (with <0.87 considered ideal).

Eleven months ago, my blood pressure was 1/3 of the time in Stage 2 Hypertension with one hypertensive emergency (higher than Stage 3 hypertension!) with the rest of the time in Stage 1 hypertension. The last two weeks, my blood pressure is 50% of the time in the normal range for non-Diabetics to 50% pre-hypertension (which is considered the ‘normal range’ for those with Type 2 Diabetes) and I am off Ramipril. Except for stating that participants in the study had improvements in both systolic and diastolic blood pressure, no data was provided, so no comparison is possible.

Conclusion

Even eating almost double the amount of carbohydrates as those in the study ate for the first 5 months, my weight loss and improvements in blood glucose levels the last 6 months enabled me to match or exceed the results of those in the study!

On average after 1 year, participants in the study lowered their HbA1c from 7.6% to 6.3% and I lowered mine from 8.5% to 6.3% after 11 months.

Average weight loss in the study during the first year was 12% of body weight which on average was 30 pounds and my weight loss has been 17% of my body weight with a 35 pound weight loss, in 11 months.

My triglycerides decreased 33% which is even better than the average 24% in subjects in the 1 year study.

My LDL decreased 20% which was also better than the average of 18% from new 1-year study data.

My blood pressure was dangerously high 11 months ago and today is in the normal range for someone with Type 2 Diabetes and half the time is in the normal range for someone without it.

Finally here are two additional ways that I can measure my success to date;

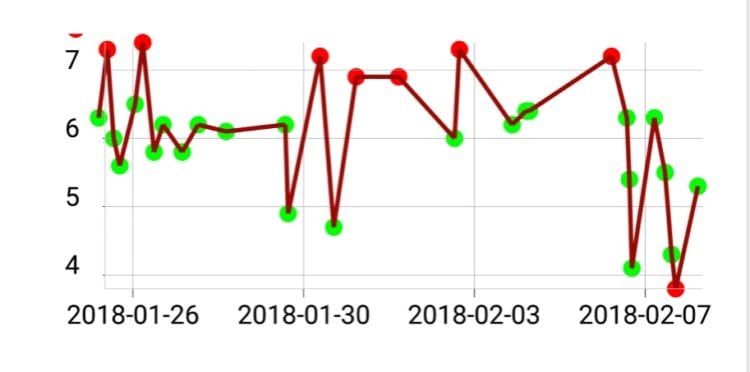
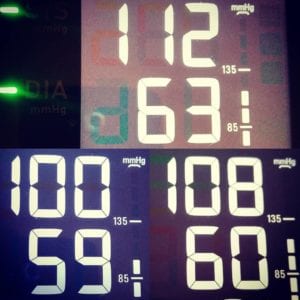
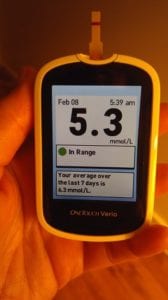
Early this morning, my fasting blood glucose was 5.3 mmol/L (95 mg/dl) which is in the normal non-Diabetic range. This is a first! This was without taking Metformin.


At 10:20 AM while still fasting (today in an intermittent fast day for me), my fasting blood glucose is still 5.3 mmol/L (95 mg / dl) – also with no medication.

This is my body maintaining a stable non-diabetic fasting blood glucose level – which means my liver is not over-synthesizing new glucose (gluconeogenesis)

This is huge progress.

Up until now, my liver and muscle was so insulin resistant that my liver just kept making more and more glucose (via a process called gluconeogenesis).

Normally, the hormone insulin stops excess glucose production by stopping glucagon secretion by the pancreas (alpha cells), but I was SO insulin resistant, glucagon would be released telling my liver to make more glucose!

The fact that my fasting blood sugar has been stable for so many hours, means my liver is starting to respond to signals correctly.  My liver is maintaining my blood sugar at a normal level – without any medication. This is great news.

UPDATE: My morning fasting blood glucose the following morning was just as wonderful (5.3 mmol/L / 95 mg/dl), Feb 9) and my 2 hour post prandial blood glucose after eating a high protein low carb breakfast was also amazing (5.4 mmol/L / 97 mg/dl, Feb 9).  That is, the above result was not a ‘one-off’ event but the start of becoming insulin sensitive!


Finally, here are two photos of me; one from March 2017 and one from February 2018 – taken 10 months apart.  Using the width of my glasses as a reference, it is easy to see the decrease in the width of my face.

Goals compared with results

March 14, 2017, I set very specific goals that I wanted to achieve and they were;

I have a long way to go to get to my goals (plural) because I’ve set the bar very high…and why not? If the literature indicates that this works, then I want;

(1) blood sugar in the non-diabetic range

(2) normal blood pressure

(3) normal / ideal cholesterol levels

(4) a waist circumference in the ”at or below” recommended values of the Heart and Stroke Foundation

Will I meet all these goals?  Who knows?! But I won’t know if I don’t try and the alternative of a life of medication for blood sugar, blood pressure and eventually cholesterol too does not appeal to me!

So join me in my journey — a journey of change, of good health and on a road less traveled.

It is 11 months later this is what I have achieved;

  1. My HbA1C is below the Diabetic range and I am much of the time, I am able to maintain my fasting blood sugar in a normal, non-Diabetic range.
  2. My blood pressure is in the normal range for someone with Type 2 Diabetes and half the time it is in the normal range for someone without it.
  3. I have normal / ideal HDL cholesterol and triglyceride levels and my LDL is in the normal, but not ideal range.
  4. I have a waist circumference that is ”at or below” recommended values of the Heart and Stroke Foundation (see photo , above).

    A waist circumference in the ”at or below” recommended values of the Heart and Stroke Foundation for a Caucasian woman is < 35 inches

Three weeks after setting the above goals, I updated my waist circumference goal to be that I wanted my waist circumference to be half my height.  This was based on a meta-analysis study from 2012 which pooled data from multiple studies with more than 300, 000 adults in several ethnic groups and which found that Waist to Height Ratio (WHTR) was a far better predictor than BMI or Waist Circumference of cardiovascular or metabolic risk factors in both sexes.

from Ashwell M, Gunn P, Gibson S (2012) Waist-to-height ratio is a better screening tool than waist circumference and BMI for adult cardiometabolic risk factors: systematic review and meta-analysis. Obes Rev 13: 275—286

How to take Waist to Height ratio: Measure your waist at the location that is the mid-point between your last rib and the top of your hip bone, with the front and back of a flexible seamstress-type tape measure at the same height, and your belly fully relaxed, not sucked it in! Your waist circumference in inches should be half your height in inches.

Based on having a low-risk waist to height measurement, I still have to lose another 2- 1/2 inches off my waist.  I haven’t yet “arrived” but I am certainly making progress in my own, personal health and weight loss journey.

Comparing my own results over the last 11 months to the 1 year data of over 200 adults with Type 2 Diabetes who were eating a low carb ketogenic diet, I am doing at least as well, and in some cases, better. This is reason for me to be encouraged.

NOTE: There is no “one-size-fits-all” low carb / ketogenic diet and what works for me may not be what is best for you. Before undertaking a major change in diet, please discuss your plans with your doctor.

Have questions?

Wonder how a low carb / ketogenic lifestyle can help?

Please send me a note using the ”Contact Me” form above.

To our good health!

Joy

You can follow me at:

 https://twitter.com/lchfRD

  https://www.facebook.com/lchfRD/

Copyright ©2018 The LCHF-Dietitian (a division of BetterByDesign Nutrition Ltd.)

LEGAL NOTICE: The contents of this blog, including text, images and cited statistics as well as all other material contained here (the ”content”) are for information purposes only.  The content is not intended to be a substitute for professional advice, medical diagnosis and/or treatment and is not suitable for self-administration without the knowledge of your physician and regular monitoring by your physician. Do not disregard medical advice and always consult your physician with any questions you may have regarding a medical condition or before implementing anything  you have read or heard in our content.


References

Hallberg, S.J., McKenzie, A.L., Williams, P.T. et al. Diabetes Ther (2018). Effectiveness and Safety of a Novel Care Model for the Management of Type 2 Diabetes at 1 Year: An Open-Label, Non-Randomized, Controlled Study.  https://doi.org/10.1007/s13300-018-0373-9


New Study: Reversal in T2D Symptoms can be Sustained Long Term

In June of 2017 results of a 10-week outpatient study using a  ketogenic diet intervention  were published and demonstrated significant improvements in subject’s body weight, glycated hemoglobin (HbA1C) and medication usage. One year follow-up data has just been published demonstrating that reversal of Type 2 Diabetes symptoms is sustainable over the long term, as participants continue to eat a ketogenic diet.

Participants

There were 238 participants  enrolled in the continuous care intervention at the beginning of the study and all had a diagnosis of Type 2 Diabetes (T2D) when the study began, with an average HbA1c of 7.6% ±1.5%.

Participants ranged in age from 46 — 62 years of age (mean age = 54 years). Sixty-seven (67%) of participants were women and 33% were men.

Weight ranged from 200 pounds to 314 pounds (117±26 kg), with an average weight of 257 pounds (117 kg).  Average Body Mass Index (BMI) was 41 kg·m-2 (class III obesity) ±9 kg·m-2, with 82% categorized as obese.

The majority of participants (87%) were taking at least 1 glycemic control medication at the beginning of the study.

At the end of a year, 218 participants (83%) remained enrolled in the  continuous care intervention group.

Intervention

Each participant received an Individualized Meal Plan for nutritional ketosis, behavioral and social support, biomarker tracking tools, and ongoing care from a health coach with medication management by a physician.

Subjects typically required <30 g·day−1 total dietary carbohydrates. Daily protein intake was targeted to a level of 1.5 g·kg−1 based on ideal body weight and participants were coached to incorporate dietary fats until they were no longer hungry. Other aspects of the diet were individually tailored to ensure safety, effectiveness and satisfaction, including consumption of 3-5 servings of non-starchy vegetables and enough mineral and fluid intake. The blood ketone level of β-hydroxybutyrate was monitored using a portable, handheld device.

Ten Week and One Year Outcomes

Medication Use

At baseline, 87% of participants were taking at least one medication for Diabetes and at 10 weeks, almost 57% had one or more Diabetes medications reduced or eliminated.

After one year, Type 2 Diabetes medication prescriptions other than metformin declined from 57% to just below 30%.

Insulin therapy was reduced or eliminated in 94% of users and sulfonylurea medication was entirely eliminated in the  continuous care intervention group.

Glycosylated Hemoglobin (HbA1C)

At baseline, the average HbA1c level was 7.6% ±1.5%, with less than 20%  of participants having a HbA1c level of <6.5% (with medication usage).

After 10 weeks, HbA1c level was reduced by 1.0% and the percentage of individuals with an HbA1c level of <6.5% was 56%.

Average HbA1C Reduction after One Year [from Effectiveness and Safety of a Novel Care Model for the Management of Type 2 Diabetes at 1 Year: An Open-Label, Non-Randomized, Controlled Study.]
On average after 1 year, participants in the intervention group lowered HbA1c from 7.6% to 6.3% – which is in the sub-Diabetes range.

Weight Loss

At 10 weeks, mean body mass reduction was 7.2% from a baseline average of 117 kg (257.4 pounds) ±26 kg / 57 lbs.

Average Weight Loss at One Year [from Effectiveness and Safety of a Novel Care Model for the Management of Type 2 Diabetes at 1 Year: An Open-Label, Non-Randomized, Controlled Study.]
At one year, mean body mass reduction of participants was  12% of their initial body weight.

Other Metabolic Markers

At 10 months, participants experienced a 20% reduction in triglycerides and after one year, reduction in triglycerides was at 24%.  After one year, LDL increased on average by 10% however HDL increased on average by 18%. Serum  creatinine and liver enzymes (ALT, AST, and ALP) also declined.

Conclusion

This intervention study demonstrated that individualized nutrition care plans that encourage nutritional ketosis can significantly resukt in reduced weight, HbA1c and medication use within 10 weeks, and that these outcomes can be sustained, or even improved on  over the long term, as participants continue to eat a ketogenic diet.

Do you have questions about how a carefully-designed low carbohydrate or ketogenic diet can help you improve symptoms of Type 2 Diabetes?

Please send me a note using the ”Contact Me” form above to find out more about how I can provide you with in-person or Distance Consultation services (via Skype or long distance telephone).

To our good health,

Joy

You can follow me at:

 https://twitter.com/lchfRD

  https://www.facebook.com/lchfRD/

Copyright ©2018 The LCHF-Dietitian (a division of BetterByDesign Nutrition Ltd.)

LEGAL NOTICE: The contents of this blog, including text, images and cited statistics as well as all other material contained here (the ”content”) are for information purposes only.  The content is not intended to be a substitute for professional advice, medical diagnosis and/or treatment and is not suitable for self-administration without the knowledge of your physician and regular monitoring by your physician. Do not disregard medical advice and always consult your physician with any questions you may have regarding a medical condition or before implementing anything  you have read or heard in our content.


References

McKenzie AL, Hallberg SJ, Creighton BC, Volk BM, Link TM, Abner MK, Glon RM, McCarter JP, Volek JS, Phinney SD, A Novel Intervention Including Individualized Nutritional Recommendations Reduces Hemoglobin A1c Level, Medication Use, and Weight in Type 2 Diabetes, JMIR Diabetes 2017;2(1):e5, URL: http://diabetes.jmir.org/2017/1/e5, DOI: 10.2196/diabetes.6981

Hallberg, S.J., McKenzie, A.L., Williams, P.T. et al. Diabetes Ther (2018). Effectiveness and Safety of a Novel Care Model for the Management of Type 2 Diabetes at 1 Year: An Open-Label, Non-Randomized, Controlled Study.  https://doi.org/10.1007/s13300-018-0373-9

A Dietitian’s Journey – discontinuation of medications since beginning to eat low carb

NOTE: A “Dietitian’s Journey” is my “sample set of one” (n=1) personal story. My results following a low carb / ketogenic lifestyle are just that; my results. There is published scientific evidence of physicians discontinuing patient’s medication following adoption of a low carb / ketogenic diet, but this post should not be viewed as objective data. This is simply me documenting my own, personal journey. Do not discontinue any medication without first consulting with your doctor.

Three years before I adopted a low carb lifestyle, I was diagnosed by the head of Immunology and Allergy at a Canadian university with a relatively rare immunological condition known as Mast Cell Activation Disorder / Syndrome (MCAD / MCAS).  I had numerous debilitating symptoms that are not unlike those that accompany other immunological / autoimmune disorders such as Lupis, Rheumatoid Arthritis (RA) and fibromyalgia – plus a few unique to MCAD (such as food and environmental sensitivities and pronounced flushing).  According to the Immunologist, the MCAD was likely triggered from my exposure to toxic mould exposed in a basement repair in November 2012. I was prescribed a whole host of medications in order to manage many debilitating symptoms.

In April of 2013, my Immunologist prescribed two types of antihistamines (H1 and H2) in very large quantities, including Cetirizine HCL 10 mg (H1) 4 times a day and Ranitidine 150 mg (H2) three-four times per day in an effort to lower my body’s release of inflammatory products. The dosage of Cetirizine is 4 times the amount used for treating seasonal allergies and the dosage of Ranitidine was twice the dosage typically used for treating acid reflux. These medications were in addition to two tablets of diphenhydramine hydrochloride 25 mg (Benedryl) that I took every 4 hours four times per day. It’s amazing I could function at all, taking that much Benedryl, but I had no choice. I also needed to use a Salbutamol (asthma) inhaler four times per day to manage my environmental sensitivity to various odors, including laundry soap and the smell of certain foods.

In November 2013, the Immunologist prescribed Sodium Nalcrom 100 mg, a mast cell stabilizer in an effort to reduce and eventually discontinue taking all the Benedryl. I took 2 capsules of Nalcrom before each meal three times per day and 2 capsules at bedtime – a total of 8 capsules per day.

Sleep disruption is one of the inconvenient symptoms of MCAD, so I was prescribed Trazadone 100 mg before bed to assist with that.

I took all of these medications as prescribed above until shortly after I began eating a low carb diet in March of 2017.

Within 3 months of beginning to eat a low carb diet (~50 gm carbohydrate per day), I was able to take less and less Nalcrom – first dropping it in the morning, then at lunch time, but continuing to take it at supper and occasionally before bed.

After about 6 months eating low carb (still ~50 gm carbohydrate per day), I was able to reduce the Cetirizine to three times per day from four and was also able to reduce the Ranitidine from 3-4 times a day to twice a day. I stopped taking the Nalcrom completely. With the MCAD much better, I was able to lower my Trazadone for sleep to half.

Once I reduced my carbs further, down to 35 gm per day (in order to better manage continued high glucose readings), I was able to reduce the Cetirizine to twice a day and the Ranitidine to just once per day, at night (which at that point was more to manage GERD than for any symptoms of MCAD). I continued to take the Trazadone ~ 3 times per week as needed for sleep.

It’s been about 3 months since I stopped taking the Ceterizine completely and about a month since I stopped taking the Ranitidine.  This left me with the “baby dose” of Ramipril 2.5 mg that I asked for in July 2017, as my blood pressure had begun to creep back up. When I saw my doctor in December, we discussed when I should discontinue the Ramipril, to which he said “when your blood pressure gets too low”.  I asked him to give me a number, so I could continue to monitor it.  He said, when it goes below 110 / 65 then you can discontinue it.

my blood pressure readings last night

Two days ago I felt a little light headed but didn’t stop to think it might be my blood pressure.  I drank more water and carried on.  Yesterday late in the afternoon (when my blood pressure is usually the highest) it was 119/79. I continued to monitor it in the evening, and it continued to drop to 112/63, 109/59, 100/59 and then back up to 108/60. Based on my doctor’s instructions to me, it seemed it may be time for me to discontinue the Ramipril. Last night I didn’t take it, but this morning I took 1/2 of it as I want to make discontinuing it gradual. I will take a 1/2 dose for a few days and keep monitoring my blood pressure to make sure my body is adapting to maintaining my blood pressure without medication

This morning as I anticipate putting the Ramipril container in the pile of discontinued medication that I have on a shelf in my closet, I realized just how big that pile is! 

Pile of discontinued medication (excluding the Benedryl which was discontinued before I began eating low carb)

I am not “cured” of MCAD, or of my Type 2 Diabetes, or my hypertension (high blood pressure) or GERD, or my abnormal lipids (referred to in my 11 month update). I am reasonably certain that if I began eating a high carb diet again, all, if not most of the symptoms I experienced previously would resume. I am in remission from these conditions and likely will remain in remission, provided I continue to eat low carb and continue to lose weight (until I achieve a low-risk waist to height ratio). The discontinuation of my past medications serve as “sign-posts” of my journey.

If you would like to know how I can help you on your own health and nutrition journey, please send me a note using the ”Contact Me” form above.

To our good health,

Joy

You can follow me at:

 https://twitter.com/lchfRD

  https://www.facebook.com/lchfRD/

Copyright ©2018 The LCHF-Dietitian (a division of BetterByDesign Nutrition Ltd.)

LEGAL NOTICE: The contents of this blog, including text, images and cited statistics as well as all other material contained here (the ”content”) are for information purposes only.  The content is not intended to be a substitute for professional advice, medical diagnosis and/or treatment and is not suitable for self-administration without the knowledge of your physician and regular monitoring by your physician. Do not disregard medical advice and always consult your physician with any questions you may have regarding a medical condition or before implementing anything  you have read or heard in our content.


A Dietitian’s Journey – competent to counsel

A week or two ago, there was some discussion on a Twitter thread that some “wouldn’t trust a fat Dietitian” and yesterday I was told “once you get in shape then you can dish out advice” – as if my past or current health status makes me less credible or competent to counsel others. Both of these got me thinking, is a ‘slim Dietitian’ really more credible? What is a Dietitian’s credibility and competency based on?

There is no question that there is a ‘fat bias’ and am not arguing whether there should be or shouldn’t be, but what makes any clinician credible is the scientific evidence on which we stand. What makes me credible in teaching others to follow a low carb / keto lifestyle has nothing to do with my body weight; it has to do with the 76 studies with almost 7000 subjects over the past 18 years which provides the scientific basis on which I base my practice. What makes me competent to counsel is my education, as well as my experience in clinical practice.

I have a post graduate degree in Human Nutrition, am a published researcher and have over a decade of experience in private practice and my learning didn’t stop there.  If it had, I would not have made the transition in thinking that I did approximately 3 years ago. It took a huge amount of research and reading and very strong scientific evidence for me to come to the conviction that what constitutes best-practice in helping people address overweight, obesity and insulin resistance, including Type 2 Diabetes is following a low carb / keto lifestyle. I continue to spend most of my free time reading scientific studies in order to more fully understand the strength of the evidence on which my clinical practice is based.

Competence is the ability to achieve a desired result and my ability to help others lose weight and lower their metabolic markers is independent of my body mass. My competence is dependent on the scientific research.

My current body weight does not make me less competent to counsel others. I am a “sample set of one” (n=1) and my personal health and weight-loss journey is just that – personal, anecdotal evidence. It encourages my clients and those that read my articles that I actually understand what is involved in living a low carb / keto lifestyle, and when I say that it can be done fairly easily and over the long-term, I know this first-hand.

Someone pointing out that I am not skinny is not news, as my past and current health status is on my web page and plastered all over the internet in Technicolor, for all the world to see. But, eleven months ago, I was an obese Dietitian with a host of metabolic issues including Type 2 Diabetes, hypertension, dyslipidemia, high visceral adipose, etc.). I was the poster woman for Metabolic Syndrome. I started “practicing what I preach” and the results speak for themselves.

My progress is well documented, I’ve lost 35 pounds, 7½ inches off my waist and have only 2 ½ more inches to lose to achieve an ideal waist to height ratio. I am in partial remission from my Type 2 Diabetes, have almost normal blood pressure and have a lipid profile that is considered ‘ideal’, and no longer take medication for chronic gastroesophageal reflux disease (GERD) – something I have done for years.

If you want to read the technical details of my progress, you can read this article.

…and I have the mirror.

Eleven months ago (March 16 2017), this is what I looked like;

March 16 2017

Today, this is what I look like:

January 28 2018

Sure, I still have 15 pounds to lose to be in the normal weight category and probably closer to 25 pounds to lose to be at my ideal body weight and waist circumference, but eating low carb isn’t a ‘diet’ for me, but a permanent change in lifestyle. It has to be because of the degree to which I have become intolerant to more than a small amount of carbohydrate. I just need to keep doing what I am doing and continued improved health and appearance will come. This is my journey.

If you would like to know how I can help you on your own health and nutrition journey, please send me a note using the ”Contact Me” form above.

To our good health,

Joy

You can follow me at:

 https://twitter.com/lchfRD

  https://www.facebook.com/lchfRD/

Copyright ©2018 The LCHF-Dietitian (a division of BetterByDesign Nutrition Ltd.)

LEGAL NOTICE: The contents of this blog, including text, images and cited statistics as well as all other material contained here (the ”content”) are for information purposes only.  The content is not intended to be a substitute for professional advice, medical diagnosis and/or treatment and is not suitable for self-administration without the knowledge of your physician and regular monitoring by your physician. Do not disregard medical advice and always consult your physician with any questions you may have regarding a medical condition or before implementing anything  you have read or heard in our content.


PART 2: The Role of Protein in the Diet – Evolutionary Exposure to Macronutrients

This article is Part II in a series titled The Role of Protein in the Diet and looks at macronutrients in our diet from an evolutionary perspective.

Over the course of man’s existence, there have been a number of major shifts in the human diet and with that change, came the necessity of the body to adapt by producing enzymes capable of digesting and absorbing nutrients from these novel foods. This required the human genome (our genes) to adapt, evolve and change [1].  This takes time.

In the ~4.4 million span of mankind’s existence, solid evidence for use of human-controlled fires, which would have given us the ability to cook our meat is only about 800,000 years old [2] with less certain sites dating back 1,500,000 years [3,4].

The origin of domestication of animals is considered to be ~10,000 – 12,000 years and represent another relatively recent shift in the human diet [1], moving mankind from a hunting and gathering species, to an agricultural one. With this shift came the need to domesticate crops, which dramatically changed the human diet. The innovation of human agriculture greatly reduced diversity in the human diet. Instead of ‘food’ being what hunter-gatherers were able to find, ‘food’ was what each group grew and raised.

Of even more  significance, it is estimated that 50%—70% of calories in the agricultural diet are from starch (carbohydrates) alone [5]. The advent of animal domestication and an agricultural diet may also resulted in an over-abundance of starch-based calories, which exceeded growth and energetic requirements [1].

The remainder of this article is based largely on a lecture given by Dr. Donald Layman, PhD – Professor Emeritus from the University of Illinois (Nutrition Forum, June 23, 2013, Vancouver, British Columbia, Canada).

Looking at it from the perspective of man’s evolutionary history, the appearance of cereal grains is very recent. Cereal grains as food were non-existent in the evolutionary diet. Same with legumes, such as chickpeas and lentils.  These too were non-existent in the evolutionary diet. Refined sugar (made up of sucrose) was also non-existent in the evolutionary diet. Humans would eat wild fruit (fructose) and on the rare occasion when available they would eat honey (half glucose, half fructose), but this idea of a diet centering around sucrose and fructose was simply non-existent.

Consumption of dairy products and alcohol are also very recent in terms of human history. We didn’t milk wild animals, we ate them. Fermentation of fruit for wine is also very recent in terms of the evolutionary diet.

Our body did not evolve to see cereal grain, legumes, refined sugar, dairy foods and alcohol and all of these are very rich in carbohydrate.

We are exposed to carbohydrate in a way that were never evolved to see.

Our bodies developed metabolism patterns around our dietary intake of protein and fat.

We have very extensive and elaborate pattern for handling protein; for digesting and metabolizing it. We also have developed a very high ‘satiety’ (feeling full) to protein, such that we simply won’t over eat it.  It is the only macronutrient that provides sufficiently strong feedback such that we can’t over eat it.

Fat, contrary to common belief is a very passive nutrient. It has very little direct effect on our body. We store it effectively and this ability to store excess intake as fat is what enabled us to survive as hunter-gatherers.

The macronutrient that is at odds in this picture is carbohydrate.

We have very little evolutionary exposure to carbs; in fact the body responds to it has if it were highly toxic. Carbs have to be rapidly cleared after we eat it because our body must maintain our blood sugar within a very narrow range between 3.3-5.5 mmol/L (60-100 mg/dl). When we eat carbohydrate,  the body breaks it down to simple sugar (glucose) and insulin takes the extra sugar out of the blood and moves it into cells. Our only mechanism to protect us from carbohydrate is insulin. The problem is, when we eat carbohydrates every few hours, the ability for insulin to respond becomes overwhelmed.

We have a biological system for handling carbohydrate and the traditional teaching is that carbs are handled in the muscle, which is true if one exercises 2-3 hours per day.  When were were hunter-gatherers and we came across a bee hive, for instance or a fruit tree in season, our muscle was able to process the short spike in glucose load because we were very active. The average North American or European is not typically exercising that much, with ~75%  considered sedentary (inactive).

So where are those carbs going?

They’re going to body fat.

Carbohydrate regulation is very important to think about. Carbs are among some of the most regulated substances in the body. Blood sugar is controlled and kept within an extremely tight range between 3.3-5.5 mmol/L (60-100 mg/dl).

If we don’t burn off the 30 gm of carbs (equivalent to ~ 6 tsp of sugar) we ate for breakfast by the time we have a fruit mid-morning (another 15 gm of carbs / equivalent to 3 tsp of sugar), we have to store the carbs somewhere.  Comes lunch, most people eat another 30 – 45 gm of carbs (~6 – 9 tsp of sugar) if they’re eating a lunch brought from home and even more than that if eating out at the food court. Maybe another fruit is eaten mid-afternoon, and without realizing it, people have consumed the equivalent of 24 tsp of more of sugar, eating what they’ve believed is a healthy diet. As explained in a previous post, the blood can only have at most the equivalent of ~ 1 tsp of sugar in it at any one time, so where does all the sugar go?

It goes to fat stores.

Fatty Acid Processing [slide from Dr. Donald Layman, PhD – Nutrition Forum, June 23, 2013, Vancouver, British Columbia, Canada.]
To synthesize the excess sugar into fat, the glucose (sugar) comes into the liver and is synthesized into free fatty acids.

Our body is constantly pulling out free fatty acids from our fat stores (adipose tissue) when we are sleeping or exercising, for example to use as a fuel source, so the free fatty acids that are coming in from adipose tissue (fat stores) and those that are being synthesized from glucose (the excess carbs we took in our diet) mix in the liver, and are then packaged into very-low-density lipoprotein (VLDL).

Think of these VLDL as ”taxis” that move cholesterol, triglycerides and other fats around the body. Once these VLDL “taxis” deliver their payload, the triglyceride is stripped out and absorbed into fat cells. The VLDLs shrink and becomes a new, smaller, lipoprotein, which is called Low Density Lipoprotein, or LDL — the so-called bad cholesterol’.

[Calling LDL ‘bad cholesterol’ is a misnomer, because not all LDL is harmful.  LDL which is normally large and fluffy in texture is  a good cholesterol (pattern A) that can become bad cholesterol (pattern B) when it becomes small and dense. In a healthy person, LDL is not a problem because they find their way back to the liver after having done their job of delivering the TG to cells needing energy. In a person with insulin resistance however ,the LDL linger a little longer than normal, and get smaller and denser, becoming what is known as ”small, dense LDL” and these are the ones that put us at a risk for cardiovascular disease.]

The origins of high triglycerides is the beginning of Metabolic Syndrome (also called Syndrome X). This is the point at which the body is getting too many carbs and the system is breaking down. The result is high than normal blood sugar after meals (called post prandial glucose), an increase in free fatty acids, and the increase in triglycerides and these together contribute to fatty liver. These are all symptoms Metabolic Syndrome.

If one is eating more than 30 gm of carbohydrates per day then they either need to have very high exercise to account for it, or they’re going to be making fat from it.

With an average carb intake of 300 gm per day and 75% of North Americans sedentary, it is easy to see where the problem of excess fat stores comes from.

Since our only mechanism for dealing with carbohydrate is insulin, by continually overwhelming the body with a steady supply of glucose – way above the small amount of carbohydrate that our genome has adapted to see, the system fails. This is where the origins of the overweight and obesity statistics elaborated on in the first part in this series (located here).

To address this carbohydrate excess, we can lower carbohydrate intake and either raise fat intake or raise protein intake. In Part III of this series, we will shift the focus to the benefits of increasing protein in the diet.

You can follow me at:

 https://twitter.com/lchfRD

  https://www.facebook.com/lchfRD/


Copyright ©2018 The LCHF-Dietitian (a division of BetterByDesign Nutrition Ltd.) 

LEGAL NOTICE: The contents of this blog, including text, images and cited statistics as well as all other material contained here (the ”content”) are for information purposes only.  The content is not intended to be a substitute for professional advice, medical diagnosis and/or treatment and is not suitable for self-administration without the knowledge of your physician and regular monitoring by your physician. Do not disregard medical advice and always consult your physician with any questions you may have regarding a medical condition or before implementing anything  you have read or heard in our content.


References

  1. Luca F, Perry GH, Di Rienzo A. Evolutionary Adaptations to Dietary Changes. Annual review of nutrition. 2010;30:291-314. doi:10.1146/annurev-nutr-080508-141048.
  2. Goren-Inbar N, Alperson N, Kislev ME, Simchoni O, Melamed Y, et al. Evidence of hominin control of fire at Gesher Benot Ya’aqov, Israel. Science. 2004;304:725—727
  3. Brain CK, Sillent A. Evidence from the Swartkrans cave for the earliest use of fire. Nature. 1988;336:464—466.
  4. Evidence for the use of fire at zhoukoudian, china
    Weiner S, Xu Q, Goldberg P, Liu J, Bar-Yosef O
    Science. 1998 Jul 10; 281(5374):251-3.
  5. Copeland L, Blazek J, Salman H, Chiming Tang M. Form and functionality of starch. Food Hydrocolloids. 2009;23:1527—1534.


Evidence that Low Carb Diets are Safe and Effective

Claims are sometimes made that “low carb diets are a fad” and “there needs to be scientific evidence to demonstrate they are both safe and effective“. What is the evidence?

In fact, a low carbohydrate diet is not new and was the standard recommendation for treating Diabetes prior to the discovery of insulin. More than 150 years ago, the first weight-loss diet book (ironically written by William Banting, a distant relative of Sir Frederick Banting, the co-discoverer of insulin) focused on the limiting the intake of carbohydrates, especially those of a starchy or sugary nature. The book was titled Letter on Corpulence — Addressed to the Public (1864) and summarized the advice of the author’s physician, Dr. William Harvey that had enabled Banting to shed his portly stature’.

Recent 10 week results of a nonrandomized, parallel arm, outpatient intervention using a very low carb diet which induced nutritional ketosis  was so effective at improving blood sugar control in Type 2 Diabetes, that at the end of six months >75% of people had HbA1c that was no longer in the Diabetic range (6.5%). Details of the findings from this study titled A Novel Intervention Including Individualized Nutritional Recommendations Reduces Hemoglobin A1c Level, Medication Use, and Weight in Type 2 Diabetes are available here.

I recently reviewed 2 two-year studies that demonstrated that low carb diets are both safe and effective for weight loss and improving metabolic markers;

  1. This long-term study titled Weight Loss with a Low-Carbohydrate, Mediterranean, or Low-Fat Diet clearly demonstrated that a low carb non—calorie-restricted diet was both safe and effective and produced the greatest weight loss, lower FBS and HbA1C, the most significantly lower TG and higher HDL and lower C-reactive protein (when compared with a  low-fat calorie-restricted diet and a Mediterranean calorie-restricted diet).
  2. This 2-year, randomized control study of more than 300 participants  titled Low Fat Calorie Restricted Diet versus Low Carbohydrate Diet — a two year study found that both diet groups achieved clinically significant and nearly identical weight loss (11% at 6 months and 7% at 24 months) and that people who ate the low-carbohydrate diet had greater 24-month increases in HDL-cholesterol concentrations than those who ate a low-fat calorie restricted diet. As well, a significant finding of this study was a very favourable lowering of LDL for the first 6 months and lowering of both TG and VLDL for the first year.

These long-term data provide evidence that a low-carbohydrate diet is both a safe and effective option for weight loss and that this style of eating has a prolonged, positive effect on metabolic markers.

But is this all the evidence we have?  By no means!

Below is a list of research studies and meta-analyses (complied by Dr. Sarah Hallberg) that used a low-carb intervention. These span 18 years, 76 publications, involve 6,786 subjects, and include 32 studies of 6 months or longer and 6 studies of 2 years or longer. At the bottom of this post is a downloadable pdf of this list. [Note: text in green represents meta-analyses.]

Hardly a passing fad!

Low carb diets have been well-studied and found to be both safe and effective.

Many thanks to Dr. Sarah Hallberg, a Physician and exercise physiologist from West Lafayette, Indiana (Twitter: @DrSarahHallberg) for compilation of this list.

A complete list of the Low Carb Diet studies to date (compiled by Dr. Sarah Hallberg) is available here.

You can follow me at:

 https://twitter.com/lchfRD

  https://www.facebook.com/lchfRD/

Copyright ©2018 The LCHF-Dietitian (a division of BetterByDesign Nutrition Ltd.) 

LEGAL NOTICE: The contents of this blog, including text, images and cited statistics as well as all other material contained here (the ”content”) are for information purposes only.  The content is not intended to be a substitute for professional advice, medical diagnosis and/or treatment and is not suitable for self-administration without the knowledge of your physician and regular monitoring by your physician. Do not disregard medical advice and always consult your physician with any questions you may have regarding a medical condition or before implementing anything  you have read or heard in our content.

Misconceptions About the Keto Diet

Alarming social media posts cry out dire warnings about the supposed “dangers” of the ‘keto diet’ but are they founded? What is “the keto diet”?

The Keto Diet

There is no one “keto diet”, but many variations of ketogenic diets that are used for different therapeutic purposes.

Some therapeutic ketogenic diets are used in the treatment of epilepsy and seizure disorder and are extremely high in fat. Other types of therapeutic ketogenic diets are used in the treatment of various forms of cancer (those that feed on glucose), such as brain cancer. There are ketogenic diets that are used in the treatment of Polycystic Ovarian Syndrome (PCOS), as well as for weight loss and for increasing insulin sensitivity in those with Type 2 Diabetes and insulin resistance. Even among those using a nutritional ketogenic diet for weight loss and to increase insulin sensitivity, there is no one “keto diet”.  There are ketogenic diets with a higher percentage of fat than protein, with a higher percentage of protein than fat and mixed approaches which may have different ratios of protein to fat – depending on whether the individual is in a weight loss phase or a weight maintenance phase. There are as many permutations and combinations as there are people following a keto diet for these reasons.

What makes a diet ketogenic (or keto) is that the amount of carbohydrate relative to the amount of protein and fat results in the utilization of fat as a primary fuel source rather than carbohydrate. 

Macronutrient Percentages of Keto Diets

Another assumption is that a keto diet used for weight loss (as if there were only one?) is 20% protein, 70% fat and 10% carbohydrate (and such posts are often accompanied by photos of large plates piled high with bacon and eggs), however therapeutic ketogenic diets used for weight loss ranges from those with a higher percentage of fat than protein (which may focus on mono-unsaturated fats and omega 3 fats), a higher percentage of protein than fat (thus no piles of bacon!), and a mixed approach with different ratios of protein to fat depending on whether the individual is in a weight loss phase or a weight maintenance phase.

This idea that a “keto diet” has a specific percentage of fat to protein to carbs in itself is very  confusing, because the percentage of calories of any of these macronutrients will depend on how many calories a person is eating in a day. For example, two different people may be eating ~30% of their calories as protein but one person is eating just over 55 gm of protein on an 800 calorie a day diet, while another person is eating 160 gm of protein on a 2000 calories diet. When discussing macronutrients, we have to specify grams of protein, grams of fat and grams of carbohydrate, otherwise the figures are meaningless.

What makes a diet ketogenic is that the amount of carbohydrate in the diet results in people’s body utilizing fat as its primary fuel and depending on the individual, how insulin resistant (IR) they are, how long they have been IR or had Type 2 Diabetes and whether they are male or female will affect the degree of carbohydrate restriction. Some may do very well with 100 gms of carbohydrate, while others may need to consume less.

Not everyone with lactose intolerance for example, needs to restrict milk to the same degree; some can tolerate 1 or 2 cups whereas other can only tolerate a few ounces. It is the same case with those that have become intolerant to carbohydrate. Different individuals depending on their metabolic state and clinical conditions,  have varying ability to process carbohydrate. That is why there is no “one size fits all” ketogenic diet.

The “Dangers” of Keto Diets

Some articles warn that “ketosis is actually a mild form of ketoacidosis” which is simply not true.

Ketones are naturally produced in our bodies during periods of low carb intake, in periods of fasting for religious or medical tests, and during periods of prolonged intense exercise. This state is called ketosis. It is normal and natural and something everyone’s body does when using glucose as its main fuel source.

Once our glycogen levels are used up, fat is broken down for energy and ketone bodies are a byproduct of that. These ketones enter into the mitochondria of the cell and are used to generate energy (as ATP) to fuel our cells.

Ketosis is a normal, physiological state and we may produce ketones after sleeping all night, if we haven’t gotten up and eating something in the middle of the night.

Ketoacidosis on the other hand is a serious medical state that can occur inuntreated or inadequately treated Type 1 Diabetics, where the beta cells of the pancreas don’t produce insulin. It may also occur in those with Type 2 Diabetes who decrease their insulin too quickly or who are taking other kinds of medication to control their blood sugars.

In inadequate management of Type 1 Diabetes or in insulin-dependent Type 2 Diabetes, ketones production will be the first stage in ketoacidosis. This is not the case when the above medical issues are not present.

Final Thoughts…

There is no one “keto diet” but rather  many variations of ketogenic diets that are used for different therapeutic purposes. Depending on the condition for which a person is using a therapeutic ketogenic diet, the number of grams of fat, protein and carbohydrate will vary. Even in those utilizing a ketogenic diet for weight loss or lowing insulin resistance, the number of grams of carbohydrate will vary considerably person to person.

People following a ketogenic diet need to work closely with their doctor. For those on blood sugar- or blood pressure lowering medication this is very important, because clinical studies have demonstrated that the dosage of medication needs to be adjusted downwards as glycemic control is restored.

As with anything we read in magazines or on the internet, a healthy dose of discernment is needed. The person writing the article may not be current with the research in this field and be sincerely operating on an older paradigm. I encourage you to ask questions, read reviews of current studies using ketogenic diet for the condition of relevance (whether on this site or others) and to speak with your doctor. Let your decision will be an informed one, not fueled by dramatic headline with dire warnings and misinformation.

Have questions?

Please send me a note using the “Contact Me” form above.

To our good health,

Joy

You can follow me at:

 https://twitter.com/lchfRD

  https://www.facebook.com/lchfRD/

Copyright ©2018 The LCHF-Dietitian (a division of BetterByDesign Nutrition Ltd.) 

LEGAL NOTICE: The contents of this blog, including text, images and cited statistics as well as all other material contained here (the ”content”) are for information purposes only.  The content is not intended to be a substitute for professional advice, medical diagnosis and/or treatment and is not suitable for self-administration without the knowledge of your physician and regular monitoring by your physician. Do not disregard medical advice and always consult your physician with any questions you may have regarding a medical condition or before implementing anything  you have read or heard in our content.

A Dietitian’s Journey – a picture tells a thousand words

Sometimes a photo can say more than all the words in the world.

The two photos below are a comparison of me 11 months ago and today. I certainly haven’t “arrived”, but like any journey there are markers along the way – markers that you are headed in the right direction, markers as to how far you’ve come and markers as to how far you’ve left to go. This photo is such a marker.

Me – 11 months ago (left) and today (right)

Everybody’s road to better health is different and “A Dietitian’s Journey” tells mine. You can read my story from the beginning with all the ‘gory details’ – from my “fat pictures”, to my lab work, and everything in between.  It tells the story of my struggle with denial and how the pain of remaining the same was greater than the pain of changing, and so I changed.

I keep making small, corrective changes in my path to ensure that it time I arrive at my ‘destination’ – which for me is to have a waist circumference  (in inches) that is half my height (in inches). This is not an arbitrary goal based on vanity, but is based on me having the lowest risk of cardiovascular events (heart attack and stroke), given my lab work continues to improve, as time goes on.

A summary of where I am on this journey now is here.

If you have questions as to how I could help you achieve your own health and nutrition goals, please send me a note using the “Contact Me” form on the tab above.

To our good health!

Joy

You can follow me at:

 https://twitter.com/lchfRD

  https://www.facebook.com/lchfRD/

Bone Broth – a rich source of protein and essential amino acids

This recipe is posted as a courtesy to those following a variety of low-carb and ketogenic diets (not necessarily Meal Plans designed by me). This recipe may or may not be appropriate for you.

To those who are new to a Low Carb High Fat or Ketogenic lifestyle, “bone broth” may be something new.  At first glance it may seem like a stock, but it is very different. A stock is made with meat and is cooked for ~ 2 hours, whereas bone broth is made with animal bones (beef or chicken, usually) and only whatever meat clings to it and is simmered for 18 hours or more.

Bone broth is the beverage of choice for many when they are intermittent fasting (also called ‘time restricted eating’) – more on that here.  Intermittent fasting is really a misnomer as a “fast” involves a period of time without nutrition, a temporary form of starvation.  During therapeutic intermittent fasting, bone broth is often taken as it provides a good rich of protein and electrolytes, so the body is not put in starvation mode (which slows metabolism). Drinking bone broth while intermittent fasting would be similar to following a ‘protein-sparing modified fast’.

Below is the nutrient comparison done by a professional food lab, showing the difference between an ’18 hour bone broth’ and a ‘2 hour meat stock’.

Here is a 2 hour meat stock;

2 hr meat stock nutrition
Nutrient Analysis – 2 hr Meat Stock – Anresco Laboratories, San Francisco CA, Jan 22 2015

Here is an 18 hour bone broth;

18 hr bone broth nutrition
Nutrient Analysis – 18 Hour Bone Broth – Anresco Laboratories, San Francisco CA, Jan 22 2015

As you can see, the 18-hour bone broth has more than 3 times the amount of protein – almost 10 g of protein per 1 cup (244 g) serving.  The 2 hour meat stock pales in comparison.

Here are the nutrition labels written the way they would be if you purchased these in a store;

18 hr bone broth nutrients
Nutrient Analysis – 18 hour Bone Broth – Anresco Laboratories, San Francisco CA, Jan 22 2015
2 hr soup stock nutrition
Nutrient Analysis – 2 hr Meat Stock – Anresco Laboratories, San Francisco CA, Jan 22 2015

Stock versus Bone Broth

In addition to the significant difference in nutrients, there is a fundamental difference in a meat stock compared to bone broth and that is gelatin. I’m not talking about the flavoured, coloured stuff that our mothers or grandmothers  fed us for dessert, but the protein that is extracted by simmering animal bones, cartilage and other connective tissue to extract the collagen, the protein that connects muscle and cartilage to bone in animals. When bone broth is simmered for 18 hours or more, collagen breaks down and is transformed to the flavourless, colorless substance called gelatin. That is why after bone broth cools, it has a jelly-like texture.

gelatin
gelatin texture of chilled beef bone broth
gelatin2
natural gelatin from the chicken bones and feet results in this texture, when chilled

Gelatin also contains the amino acids glycine, proline, lysine, alanine, arginine and valine which is an essential amino acid that cannot be produced by the human body, which means it must come from the diet.

In addition to giving bone broth it’s characteristic body, there are some clinical studies that seem to indicate that gelatin may reduce pain and improve joint mobility in those with osteoarthritis.

Beef Bone Broth Recipe

Making bone broth is less about a recipe and more about a method.  It takes the right ingredients and lots and lots of time.

bones
beef marrow and beef foot bones

1 – When I make beef bone broth, I used both beef marrow and beef foot bones.  The marrow bones are round with the marrow in the centre and the beef foot bones have lots of cartilage, which helps form the gelatin.


bones and herbs
beef marrow and foot bones with onion, peppercorns and sea salt

2 – I brown the marrow and foot bones on both sides in a little coconut oil and add a small onion for flavour, some fresh or dry peppercorns and sea salt, then cover with cold, filtered water.  The reason I use cold water, is to enable me to skim off the “foam” which is produced as the bone broth begins to simmer.

[Note: Be careful not to put in too much water, otherwise the bone broth won’t ‘gel’.]


add time - beef
the most important ingredient is time

3 – The most important “ingredient” in making bone broth is time; at least 18 hours at a low, slow heat.  It shouldn’t boil, but be held just below the boiling point the entire time.  A slow-cooker works well for those who work or study outside of home.


beef bone broth cup
A cup of 18-hour beef bone broth

4. Enjoy!

Chicken Bone Broth Recipe

Like a beef bone broth, a chicken bone broth is about a few essential ingredients and lots and lots of time. A stewing hen is essential for making chicken bone broth because it is mostly bone and connective tissue with almost no “meat” on it.  On a whole hen, there is maybe 1 cup of meat. These fowl are usually birds that have outlived their usefulness for laying eggs and it’s the age of the chicken and all it’s connective tissue that makes it perfect for making bone broth (or soup).

The other essential ingredient is the addition of chicken feet.  Yes, chicken feet.  Like the beef feet in beef bone broth, the chicken feet have lots of connective tissue which results in the production of gelatin. I chop the nails off of them before making bone broth but many butchers that sell them will do this for you, if you ask.

fowl
Stewing Chickens

1 — Put two or three stewing hens at the bottom of a large stock pot.


ingredients for magic soup
Stewing chickens, chicken feet and herbs

2- Place the chicken feet on top, and any herbs or small amount of vegetables used only for flavour.  Cover with cold, filtered water and add sea salt. [Note: Be careful not to put in too much water, otherwise the bone broth won’t ‘gel’.]


skimmer
skimming mesh

3 — Skim off the foam with a small mesh designed for this purpose until it stops producing foam.


magic soup
Chicken bone broth

4 -Lower the heat to medium low and simmer soup for at least 8-10 hours, overnight if possible. Be careful not to boil.


magic soup
Chicken bone broth

5 – Enjoy!


Want to know more about how I could help you reach your health and nutrition goals following a low carb or ketogenic lifestyle?

Please feel free to have a look around my website and send me a note with your questions using the “Contact Me” tab above. You can also download a complete summary of my services here.

To our good health,

Joy

If you would like to read well-researched, credible ”Science Made Simple”  articles on the use of a low carb or ketogenic diet for weight loss, as well as to significantly improve and even reverse the symptoms of Type 2 Diabetes, high cholesterol and other metabolic-related symptoms, please  click here.

You can follow me at:

 https://twitter.com/lchfRD

  https://www.facebook.com/lchfRD/


A Dietitian’s Journey – remission from Type 2 Diabetes

My journey began on March 5, 2017 when I was a fat Dietitian with all the benchmark symptoms of Metabolic Syndrome including Type 2 Diabetes, high blood pressure, high LDL cholesterol and triglycerides, abdominal adiposity (i.e. “a belly”) and high BMI (high weight for height). Physically I was a mess but my biggest problem was that I was in denial. It had been months since I had monitored my own blood sugar or blood pressure even though I had been diagnosed with Type 2 Diabetes 10 years earlier. I knew better.

I would occasionally step on the scale and weigh myself, but how my clothes fit (or didn’t) already told the story. I was overweight. Actually, I was obese.

Shortly before my own turning point in March 2017, I had two girlfriends my own age – one who I knew since high school and one since university die of preventable diet-related disease within two months of each other. Both were in healthcare and took care of others practicing their profession, just as I do. I had two degrees on the wall but didn’t take care of myself.

March 5, 2017 all that changed. That was the day that the pain of remaining the same became greater than the pain of changing. So I changed.  That story and the progress since then are in previous articles in A Dietitian’s Journey.

Like many others, I once believed that “Diabetes is a chronic, progressive, disease” and that it will only get worse in time. I realize now that if I had continued to eat more carbs than my body could handle, then it most certainly would have gotten worse but I have almost 11 month of evidence that supports that if I don’t, it CAN and DOES get better.

I am not “cured” by any means, but my symptoms are now in what the American Diabetes Association defines as partial  remission and I may very well be able to achieve full remission, as I continue to eat a low carb diet. I will only know in time.

To achieve remission with Type 2 Diabetes (T2D) is like someone being in remission with Celiac disease; we can get well and stay well provided that we don’t eat the foods that we can’t tolerate; for a Celiac that’s gluten and for someone with T2D it is more carbohydrates than their body can handle.

I do eat some carbohydrate each day, mostly as non-starchy vegetables, the occasional berries or pomegranate seeds on a salad, as well as some nuts and seeds but I am careful to keep the amount at any one time below what my body can process while maintain blood glucose control as close to a ‘normal’ (non-Diabetic) level as possible.

This article explains how and why my body is no longer able to handle more than a small amount of carbohydrate at a time.

The good news is that I no longer meet the criteria for diagnosis with Type 2 Diabetes, as demonstrated by the  Diagnostic Criteria[1] for the disease:

Abbreviations: 2hPG , 2-hour plasma glucose; A1C , glycated hemoglobin; FPG , fasting plasma glucose; IFG , impaired fasting glucose; IGT , impaired glucose tolerance; OGTT , oral glucose tolerance test; PG , plasma glucose.

Diabetes Partial Remission and Remission

It does not appear that Diabetes Canada define these concepts, however the American Diabetes Association (ADA) defines “remission” as having test results below the range for Diabetes (i.e. Fasting Blood Glucose less than or equal to 5.5 mmol/L (100 mg/dL) without taking Diabetes medications or having bariatric surgery.

“Partial remission” according to the ADA is having test results lower than the range for Diabetes i.e. Fasting Blood  Glucose less than or equal to 5.5 – 6.9 mmol/L (100—125 mg/dL) or HbA1C between 5.7 — 6.4%  for at least 1 year.

  1. my Fasting Blood Glucose is less than or equal to 7.0 mmol/L , so I no longer meet the diagnostic criteria and fall in the partial remission range.  As you can see from the following picture, the average of my  twenty-four Fasting Blood Glucose readings from January 1 2018 – January 24, 2018 has  been 6.0 mmol/L. Out of the 24 glucometer readings (with a meter that I standardized with the lab when I had my tests done), only once was my blood sugar higher than the cutoff. This would indicate that I am in partial remission, by the ADA definition.

    glucometer readings average fasting
    Self monitored blood glucose – January 1 2018 – January 24, 2018 – averages

  2. I have taken seventy-five glucometer readings during the month of January so far (see photos at the bottom of this article) and none of them were greater than or equal to 11.1 mmol/L. Here is a graph of my January results:

    glucometer readings graph
    Self monitored blood glucose – January 1 2018 – January 24, 2018 – graph

3. My 3 month glycated hemoglobin test, also known as a HbA1C (or “A1C” for short) is less than or equal to 6.5 %  which means that I no longer meet the criteria for the disease and my results fall in the range for partial remission.

non-diabetic HbA1c
Glycated Hemoglobin below criteria for Type 2 Diabetes – January 23, 2018

Cholesterol and Lipids

My LDL was at the high-end cutoff two years ago, after only 4 months on a low carb high healthy fat diet, it was approaching what is considered by the existing / popular standards of ”optimal LDL” for someone who is high risk (family history of cardiovascular disease).

My LDL was 2.60 mmol/L (1.14 mg/dl), my triglycerides (TG) were 0.64 mmol/L and my HDL was 1.97 mmol/L.

Using more significant measures, my TG:HDL ratio was 0.32 (with <0.87 considered ideal). A very low TG:HDL ratio is associated with lots of large, fluffy LDL — the kind associated the lowest risk of cardiovascular disease  (CVD) such as heart attack and stroke. It is the higher density, small LDL particles that are associated with CVD.

Blood Pressure

My blood pressure has been ranging from between just below the normal range to pre-hypertension for months, but to protect my kidneys I am continuing to take a ”baby dose” of Ramipril® (2.5 mg per day) that I asked the doctor to put me on until my blood pressure is consistently below normal and the meds need to be reduced or discontinued.  The dose I’m on is the smallest it comes in and my doctor has switched me to tablets, which can be split if my blood pressure is consistently on the low side.

Weight and Waist Circumference

Weight

I’ve lost 35 pounds.  I feel better about how I look than I have in many years, and I am a little more than half way there.  I am celebrating my progress, but not letting it be ‘enough’ because health-wise, it isn’t. To truly reduce my risk of heart attack and stroke, I need to lose another 25 pounds, or whatever weight will actually put my waist circumference at half my height.

Waist Circumference

I’ve loss 7 inches off my waist. That’s more than 1/2 a foot!  Crazy, eh?  I only have another 3 inches to lose off my waist for me be in the low-risk category and I am guessing that will correlate to another 30 pounds of weight loss.  Maybe it will be less, maybe more, but my weight loss goal is whatever it takes for my waist to be half my height. The scale won’t determine my goal, the tape measure will.

My hard earned success in achieving partial remission from Type 2 Diabetes and these significant improvements in metabolic markers would be very short-lived if I began to eat more carbohydrates than my body can handle. I am still learning how much of which kinds of foods I can eat while maintaining my blood glucose levels but my own “n=1 results” seems to indicate that  full remission of Type 2 Diabetes may very well be possible. The literature seems to support that it is possible- but whether I can achieve that level has yet to be seen.  I still have much more to achieve, but I am definitely on the road to better health!

If you would like to know how I can help you on your own health and nutrition journey, please send me a note using the “Contact Me” form above.

To our good health,

Joy

You can follow me at:

 https://twitter.com/lchfRD

  https://www.facebook.com/lchfRD/

Copyright ©2018 The LCHF-Dietitian (a division of BetterByDesign Nutrition Ltd.) 

LEGAL NOTICE: The contents of this blog, including text, images and cited statistics as well as all other material contained here (the ”content”) are for information purposes only.  The content is not intended to be a substitute for professional advice, medical diagnosis and/or treatment and is not suitable for self-administration without the knowledge of your physician and regular monitoring by your physician. Do not disregard medical advice and always consult your physician with any questions you may have regarding a medical condition or before implementing anything  you have read or heard in our content.


P.S. For those that would like to see the “numbers” to understand my progress to date, below are 10 photographs showing all my glucometer readings since March 5, 2017 until today.

Blood Glucose Mar 5 2017 – January 24 2018 – pg 1

Blood Glucose Mar 5 2017 – January 24 2018 – pg 2

Blood Glucose Mar 5 2017 – January 24 2018 – pg 3
Blood Glucose Mar 5 2017 – January 24 2018 – pg 4
Blood Glucose Mar 5 2017 – January 24 2018 – pg 5

Blood Glucose Mar 5 2017 – January 24 2018 – pg 6

Blood Glucose Mar 5 2017 – January 24 2018 – pg 7
Blood Glucose Mar 5 2017 – January 24 2018 – pg 8
Blood Glucose Mar 5 2017 – January 24 2018 – pg 9
Blood Glucose Mar 5 2017 – January 24 2018 – pg 10

References

  1. Canadian Diabetes Association Clinical Practice Guidelines Expert Committee. Canadian Diabetes Association 2013 Clinical Practice Guidelines for the Prevention and Management of Diabetes in Canada. Can J Diabetes 2013;37(suppl 1):S1-S212, Chapter 3

Why Grazing Can Look Like a Scene From Hoarders

INTRODUCTION: Most people know that prediabetes and diabetes is having “high blood sugar” but just how much sugar is actually in the human body? And how does grazing on food, rather than eating set meals affect this?

An adult has 5 liters of blood circulating in their body at any one time.

A healthy person’s body keeps the range of sugar in the blood (called ‘blood glucose’) tightly-controlled between 3.3-5.5 mmol/L (60-100 mg/dl) — that is, when they eat food with carbohydrate the body breaks it down to sugar,  and insulin takes the extra sugar out of the blood and moves it into cells.

Where does it put it?

First, the body makes sure that glycogen stores are sufficient, which is the body’s “emergency supply of energy”. There’s about a day’s worth of energy (2000 calories) in our muscle and liver glycogen. Once the liver and muscle glycogen is full, the rest of the blood sugar is moved to the liver where it is converted into LDL cholesterol and triglycerides and then the rest stored in fat cells. Fat is where the sugar that we make from the food we’ve eaten goes if it is not needed right away. Fat is storage for later.

So how much sugar is there in the blood of a healthy adult?

Doing the math (see illustration below), there are only 5 grams of sugar in the entire adult human body — which is just over one teaspoon of sugar.

That’s it!

One heaping teaspoon of sugar in the entire adult body!

understand sugar in body
The amount of sugar in the blood of a healthy adult

How Do We Understand Diabetes in Terms of Blood Sugar?

How much sugar does someone with diabetes have in their blood compared to a healthy person?

Someone with a fasting plasma glucose level of 7 mmol/L (126 mg/dL) meets the diagnostic criteria for Diabetes — which is just 6.25 grams of sugar or 1 -1/4 teaspoons. That is, the difference between the amount of sugar in the blood of a healthy person and the amount of sugar in the blood of someone with  Diabetes is just a quarter of a teaspoon of sugar.

That’s it!

A quarter teaspoon of sugar is such a small amount but it makes the difference between someone who is healthy and someone who has Diabetes.

The difference between the amount of sugar in the blood of a healthy person and the amount of sugar in the blood of someone with Diabetes is just a quarter of a teaspoon of sugar.

In a person with type 2 diabetes, the once tightly-controlled system that is supposed to keep the range of sugar in the blood between 3.3-5.5 mmol/L  (60-100 mg/dl) is “broken” — and it may get this way by them “grazing” all day long, or eating more carbohydrate than their body can handle. When someone with diabetes eats food with carbohydrate in it, their insulin is unable to take the sugar out of their blood fast enough, so the sugar stays in their blood longer than it should. Just as with a healthy person, the body of someone with type 2 diabetes takes the sugar that results from the food they’ve eaten and ‘tops up’ their liver and muscle glycogen stores, then the rest is sent to the liver where it is converted into LDL cholesterol and triglycerides, and then the rest is stored in fat cells. But what if the person is grazing all day long? The sugar just keeps on coming!

Some people have the ability to store the excess sugar in the form of fat under the skin (called sub-cutaneous fat). In this way, obesity is a way of protecting the body from this sugar overflow.  Eventually though, if the constant flow of carbohydrate continues, the ability of the body to store the excess as sub-cutaneous fat is limited and then fat around the organs (called visceral fat) increases and this is what ends up contributing to type 2 diabetes and fatty liver disease. It is easy to pack away excess carbohydrate when one is grazing instead of eating, because they don’t eat enough at anyone time to feel satiated (full).

subcutaneous vs visceral fat
Sub-cutaneous fat (LEFT) versus visceral fat (RIGHT) – from Klí¶ting N, Fasshauer M, Dietrich A et al, Insulin-sensitive obesity, Am J Physiol Endocrinol Metab 299: E506—E515, 2010, pg. 5

The problem often is that we never get to access our fat stores because we are grazing on food with carbohydrate in it every few hours, storing the excess sugar in our fat stores. According to recent statistics, three-quarters of us lead sedentary (inactive) lives and barely get to make a dent in the energy we take in each day.  We just keep getting fatter and fatter.

We eat breakfast — maybe a bowl of cereal (30 gms of carbs) or two toast (30 gms of carbs) or if we’re in a rush we grab a croissant breakfast sandwich at our favourite drive-through (30 gms of carb). Each of these contains the equivalent of a bit more than 6 teaspoons of sugar. Mid-morning, maybe we eat a fruit – say, an apple (30 gm of carbs) to hold us together until lunch — and take in another 6+ teaspoons of sugar in the process. If we didn’t bring a fruit, maybe we go out for coffee and pick up an oat bar at Starbucks® (43 gms of carbs) — the equivalent of almost 10 teaspoons of sugar. The grazing continues…

At lunchtime, maybe we’ll have a sandwich (30 gm of carbs) or some leftover pasta from the night before (30 gm of carbs) or we’ll go to the food court and have a small stir-fry over rice (30 gm of carbs) — the equivalent of another 6+ teaspoons of sugar. Then, believing grazing is better than eating 3 big meals, maybe we eat another piece of fruit mid-afternoon, this time an orange (30 gms of carb) — and we’ve provided our body with the equivalent of another  6+ teaspoons of sugar.

In the scenario above, by mid afternoon (assuming we didn’t eat any fast-food or convenience foods, but only eating the food from home) we’ve eaten the equivalence of 24 teaspoons of sugar! But isn’t grazing, and eating food we bring from home supposed to be healthier?

What if we go to MacDonald®’s and eat a Big Mac® (20 g of carbs), large fries (66 g of carbs) and a large soft drink (86 g of carbs) – we’ve eaten a total of 172 g of carbs – which is equivalent to 43 teaspoons of sugar in just one meal!

In short, a healthy person will keeps moving the excess carbohydrate they eat off to their liver and will keep making triglyceride and LDL cholesterol out of it and storing the rest as fat and a person who is not insulin resistant or does not have type 2 diabetes will have normal blood sugar level, but their high carbohydrate intake can be reflected in their “cholesterol tests” (called a lipid panel) — where we may see high triglyceride results or high LDL cholesterol results or both.

The body takes the triglycerides into very-low-density lipoprotein (VLDL) cholesterol. Think of these as “taxis” that  move cholesterol, triglycerides and other lipids (fats) around the body. When the VLDL reach fat cells (called ”adipose tissue”), the triglyceride is stripped out and absorbed into fat cells. The VLDLs shrink and becomes a new, smaller, lipoprotein, which is called Low Density Lipoprotein, or LDL — the so-called bad cholesterol’. This is a misnomer, because not all LDL is harmful.  LDL which is normally large and fluffy in texture is  a good cholesterol (pattern A) that can become bad cholesterol (pattern B) when it becomes small and dense.

In a healthy person, LDL is not a problem because they find their way back to the liver after having done their job of delivering the TG to cells needing energy. In a person with insulin resistance however, the LDL linger a little longer than normal, and get smaller and denser, becoming what is known as “small, dense LDL” and these are the ones that put us at a risk for cardiovascular disease.

There are two important points here: (1) the only source of LDL is VLDL not the fat we take in though our diet and (2) only the “small dense LDL are “bad” cholesterol and these occur as a result of insulin resistance.

People often believe that because their blood sugar is ‘normal’ on a lab test, that there isn’t any problem, but as Dr. Joseph Kraft discovered in his 25+ years of research measuring blood glucose and insulin response in some 10,000 people, 75% of people with normal glucose levels are actually insulin resistant and are at different stages of pre-diabetes or “silent Diabetes” (what Dr. Kraft called “Diabetes in situ”).

These people (and maybe their doctors) think they are “fine” because their blood sugar seems normal. Perhaps however, their triglycerides and LDL blood tests come back high. The origin of the problem is not because they are eating too much fat, but grazing on too much carbohydrate.

The body is trying to store the excess sugar somewhere.  First it stores it in glycogen, then the rest is made into triglyceride and LDL and shipped all over the body, with the rest stored as fat.  The fat cells in the body keep filling up — in the muscle, in and around our organs, and some get “fatty liver disease” and some even get fat cells in their bones if their body needs a place to put it.  Bone is not supposed to have fat cells it in, but the body has to store it somewhere, because the carbohydrates just keep arriving every few hours!

Think of grazing it this way;

Imagine you are at home and you hear the doorbell ring. You go to the door and there’s a package and it’s for you.  You take the package, close the door and head to the kitchen table to open it.  Just as you’re about to open it, the door bell rings again.  You go to the door, and there’s another package — and it’s for you, again.  You take the package and head back to the kitchen and set it down beside the first, when (you guessed it) the doorbell rings again. You take that package and the ones that keep arriving, finding places to put them.  When the kitchen table is full, you put the packages on the floor underneath the table, but then you get a delivery of several packages.  You set those down wherever there’s a spot, just in time to answer the door yet again.  Package after package arrives and before you know it, you look like something out of the TV series Hoarders.  You can barely move for all the boxes, and all of them are unopened.

This is what grazing on meals and snacks with carbohydrates in them every few hours is like.

We overwhelm our body’s tightly-regulated system that is supposed to maintain our blood sugar level between 3.3 and 5.5 mmol/L (60-100 mg/dl) by continually requiring it to process the equivalent of anywhere from 6 teaspoons of sugar in a bowl of cereal or two toasts to the equivalent of 43 teaspoons of sugar in a fast-food meal.

This is how the system gets “broken”.

In time, we may get Type 2 Diabetes or fatty liver disease or high triglycerides or high cholesterol or group of symptoms called Metabolic Syndrome. This is the result of the constant strain we put our bodies under by eating a steady diet of foods containing a large percentage of  carbohydrate.

It is easy to see where the high rates of obesity and Diabetes have come from. We have become a nation of “hoarders”.

What’s the solution?

We stop the constant delivery of packages of carbohydrate every few hours.

We feed our body the protein and the nutrients it needs with enough fat to use as fuel (in place of carbs) and allow it to take the extra energy it needs from our “stored fat”.  We finally take the fat out of storage and we do this by following a low carb high fat diet.

Science made simple.

Want to know more?

Please send me a note using the “Contact Me” form above and for a complete summary of my services (pdf format), click here.

To our good health!

Joy

https://twitter.com/lchfRD

https://www.facebook.com/lchfRD/

Reference

Michigan State University, How to convert grams of sugars into teaspoons,  http://msue.anr.msu.edu/news/how_to_convert_grams_of_sugars_into_teaspoons

Klí¶ting N, Fasshauer M, Dietrich A et al, Insulin-sensitive obesity, Am J Physiol Endocrinol Metab 299: E506—E515, 2010 – http://www.physiology.org/doi/10.1152/ajpendo.00586.2009


Copyright ©2018 The LCHF-Dietitian (a division of BetterByDesign Nutrition Ltd.) 

LEGAL NOTICE: The contents of this blog, including text, images and cited statistics as well as all other material contained here (the ”content”) are for information purposes only.  The content is not intended to be a substitute for professional advice, medical diagnosis and/or treatment and is not suitable for self-administration without the knowledge of your physician and regular monitoring by your physician. Do not disregard medical advice and always consult your physician with any questions you may have regarding a medical condition or before implementing anything  you have read or heard in our content.