As of October 17th 2018, marijuana (cannabis sativa, cannabis indica) will be legal to be sold to or possessed by adults 18 years or older in Canada and to be consumed for recreational use. Medical marijuana has been available for sometime in Canada (and in some US states) to those with authorization from their healthcare provider, but will now be widely available to the general adult population. So why am I, as a Dietitian writing about marijuana? Because food cravings, commonly referred to as the “munchies” are one of the known side-effects of cannabis and result in people eating even when they’ve just eaten. For those who have made a decision to lose weight and keep it off, knowing how marijuana affects appetite is something that needs to be considered. As well, for those that are at risk for Type 2 Diabetes, knowing how marijuana impacts blood glucose and serum insulin levels is also important. So as a public service, this article is about the effect of marijuana and the “munchies” on blood sugar, serum insulin and weight gain.
The “Munchies”
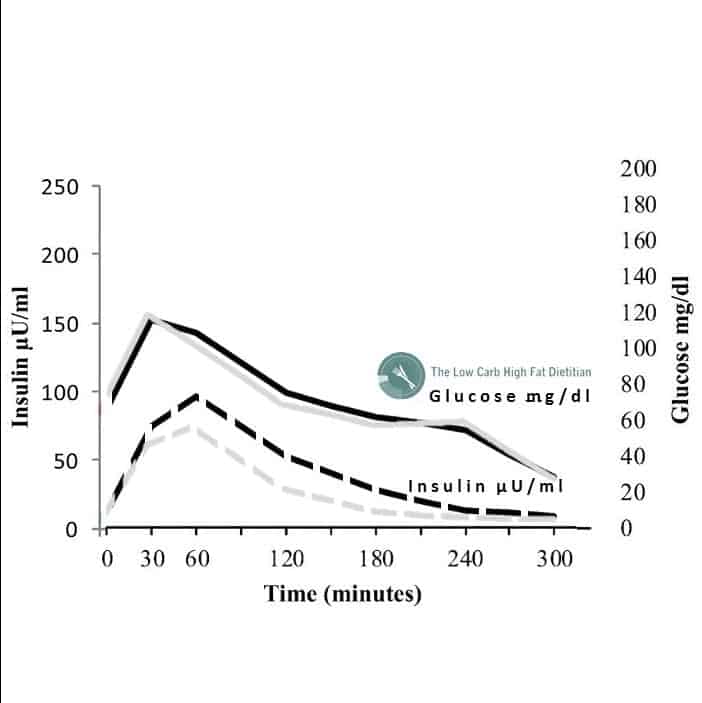
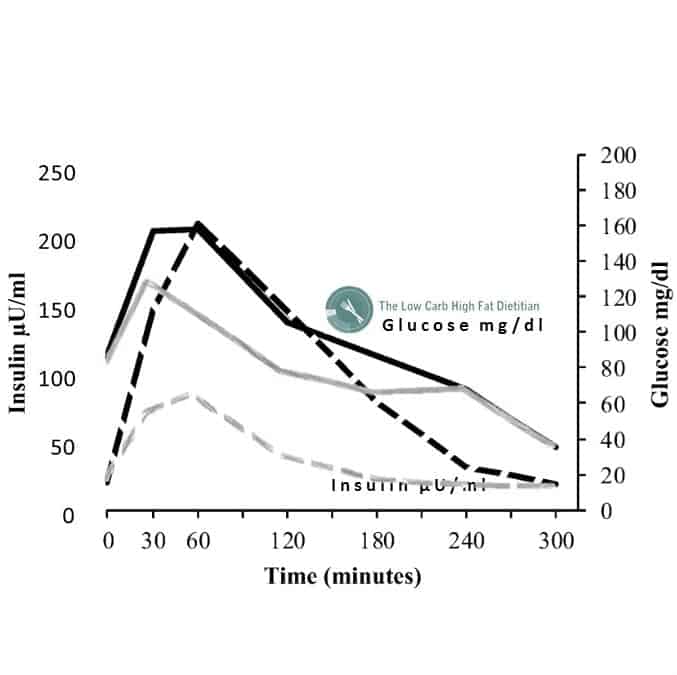
Tetrahydrocannabinol (THC) is one of the active components in marijuana that is responsible for people feeling “high” and is also responsible for “the munchies”. It’s been know for sometime that the THC in cannabis activates a cannabinoid receptor in the brain (called CB1R) which triggers an increased desire to eat but a 2015 study indicates that a group of neurons (nerve cells) called pro-opiomelanocortin (POMC) which normally produce feelings of satiety (no longer feeling hungry after eating) become activated and promote hunger under the influence of THC. As it turns out, cannabis “hijacks” the POMC neurons, resulting in them releasing hunger-stimulating chemicals rather than appetite-suppressing chemicals. This is why despite having just eaten a full meal and being satiated, ordering a pizza suddenly becomes a priority. It is thought that THC from the weed binds to mitochondria inside of cells (the “powerhouse of the cell” that generates energy) and this binding acts to switch the feelings of satiety to feelings of hunger. But how does marijuana use affect weight gain, blood sugar and insulin levels?
Marijuana’s Effect on Fasting Blood Glucose and Fasting Insulin, Insulin Resistance and Weight Gain
Interestingly, epidemiological studies (studies of populations) have found lowerrates of obesity and Type 2 Diabetes in those that use marijuana compared to those that never used it, suggesting that cannabinoids play a role in regulating metabolic processes. A 2013 study that analyzed data from almost 4657 adult men and women who participated in the National Health and Nutrition Examination Survey (NHANES) study from 2005 to 2010 were studied; 579 were current marijuana users and 1975 were past users. Results indicated that current marijuana use was associated with 16% lower fasting insulin levels and 17% lower insulin resistance as measured by HOMA-IR which is calculated from fasting blood glucose and fasting insulin. As for weight gain as a side-effect from the “munchies”, this study reported significant associations between marijuana use and smaller waist circumferences.
Marijuana and Metabolic Syndrome
A 2015 study which looked at 8478 adults 20-59 years of age who also participated in the National Health and Nutrition Examination Survey (NHANES) study from 2005 to 2010 reported that current marijuana users had lower odds of presenting with metabolic syndrome than those that never used marijuana. Current marijuana users in the 20-30 year old range were 54% less likely than those who never used marijuana to present with metabolic syndrome.
Marijuana’s Possible Role in Type 2 Diabetes Treatment?
The epidemiological studies above indicate that fasting insulin levels were reduced in current cannabis users but not in former cannabis users or in those that never used it. This leads to the question as to whether THC may be of medical benefit to those already diagnosed with pre-diabetes or Type 2 Diabetes. Given that epidemiological evidence demonstrates there may be a correlation but not provide proof of causation, further study is warranted.
Some Final Thoughts…
Certainly as a reasonable precaution, those who are Diabetic and who will begin using marijuana now that it is legal (or already use marijuana) should monitor their body’s blood sugar response, especially if they are also taking medications to lower blood sugar. Assuming that cannabis can lower blood sugar on it’s own, taking it along with medications to lower blood sugar may result in blood sugar dipping too low (hypoglycemia).
Perhaps you’re curious how I can help you achieve your weight-loss and other health goals such as lowering risk factors for Type 2 Diabetes by making dietary and lifestyle changes. I provide both in person services in my Coquitlam, British Columbia office as well as via Distance Consultation (Skype, telephone). You can find out details under the Services tab above or in the Shop.
If you have questions regarding getting started or would like more information, please send me a note using the Contact Me form above and I will be happy to reply as soon as I’m able to.
LEGAL NOTICE: The contents of this blog, including text, images and cited statistics as well as all other material contained here (the ”content”) are for information purposes only. The content is not intended to be a substitute for professional advice, medical diagnosis and/or treatment and is not suitable for self-administration without the knowledge of your physician and regular monitoring by your physician. Do not disregard medical advice and always consult your physician with any questions you may have regarding a medical condition or before implementing anything you have read or heard in our content.
References
Government of Canada, Cannabis Legalization and Regulation, http://www.justice.gc.ca/eng/cj-jp/cannabis/
Koch M, Varela L, Kim JG et al, Hypothalamic POMC neurons promote cannabinoid-induced feeding, Nature, Volume 519 (2015), pages 45—50
Penner EA, Buettner H, Mittleman MA, The Impact of Marijuana Use on Glucose, Insulin, and Insulin Resistance among US Adults, Amer J of Med, 126 (7) July 2013, Pages 583-589
Vidot DC, Prado D, Hlaing WM et al, Metabolic Syndrome Among Marijuana Users in the United States: An Analysis of National Health and Nutrition Examination Survey Data, Amer J of Med, 129 (2) Feb 2016, Pages 173-179
The American Diabetes Association (ADA) just released an updated position statement in conjunction with the European Association for the Study of Diabetes (EASD) which deems a low carb diet as Medical Nutrition Therapy for the treatment of Type 2 Diabetes in adults [1]. In fact, the joint position paper approves a diet of <130 g of carbs and states that a diet of >130 g carbs is ineffective for managing T2D.
The American Diabetes Association is responsible for educating over 30 million Americans diagnosed with Diabetes and the European Association for the Study of Diabetes (EASD) is responsible for overseeing the care of over 60 million Europeans and both now consider a low carbohydrate of < 130 g of carbohydrate not only safe, but effective therapeutic treatment. This recognition comes on the heels of Diabetes Australia having just released in late August their own updated position paper designed to provide practical advice and information for people diagnosed with Diabetes who are considering adopting a low carbohydrate eating plan [2].
What is Medical Nutrition Therapy?
Medical Nutrition Therapy (MNT) is defined as;
”nutritional diagnostic, therapy and counseling services for the purpose of disease management, which are furnished by a Registered Dietitian or nutrition professional” [3].
The American Diabetes Association and the European Association for the Study of Diabetes preface their updated position statement by saying;
“A systematic evaluation of the literature since 2014 informed new recommendations.”
That is, upon a review of the most current research, these two organizations have updated their prior position statements and now consider a low carbohydrate diet defined as <26%* of daily calories as carbohydrate [1] is suitable for the purpose of disease management of Type 2 Diabetes in adults.
*Note: based on an 1800-2000 calorie per day diet this amount of daily carbohydrate would be less than < 113-125 g daily. In fact, the position paper concludes that carbohydrate restriction of 26—45% is ineffective.
The new joint position statement elaborates that Medical Nutrition Therapy (MNT) is made up of an education component and a support component in order to enable patients to adopt healthy eating patterns with the purpose of “managing blood glucose and cardiovascular risk factors” and “reducing the risk for Diabetes-related complications while preserving the pleasure of eating” [1]. The paper defines the two basic dimensions of MNT as diet quality and energy restriction and outlines the benefits of a low carbohydrate diet in the section on diet quality.
page 12 of the joint position statement (courtesy of Jan Vyjidak)
Furthermore, the joint consensus paper lists under diet quality (Table 2, page 13) which is one of the aspects of Medical Nutrition Therapy, several diets considered suitable for adults with Type 2 Diabetes, including a low carbohydrate diet.
Table 2 —Glucose-lowering medications and therapies available in the U.S. or Europe
This move has far-reaching significance!
It moves a low carbohydrate diet from the realm of a popular lifestyle approach to Medical Nutrition Therapy.
Most importantly, this consensus paper means that qualified healthcare professionals throughout the USA and Europe can now recommend a low carbohydrate diet to their adult patients in order to enable them to manage their Type 2 Diabetes. This is a huge step forward from only being able to provide such a diet based on person’s individual preference to follow a low carbohydrate lifestyle.
Publication of this paper indicates that the current scientific literature supports that a low carbohydrate is safe and effective in lowering metabolic markers of Type 2 Diabetes, as well as delaying or eliminating the need for blood-glucose lowering medications for up to 4 years [1].
Some final thoughts…
The American Diabetes Association, European Association for the Study of Diabetes and Diabetes Australia have collectively led the way for international Diabetes Associations the world over to re-evaluate their own treatment and dietary recommendations in light of the most current scientific evidence and update their position statements regarding the safe and effective use of low carbohydrate diets in the management of Type 2 Diabetes in adults.
Here’s hoping this will occur in a timely manner.
Perhaps you have wanted to follow a low carbohydrate lifestyle and have questions about how such a diet could help you manage some of your clinical conditions or lose weight. Please send me a note using the Contact Me form above and I will reply as soon as I am able.
Whether you live locally or away, I provide services in-person in my Coquitlam (British Columbia) office, as well as via Distance Consultation (Skype or phone). You can find more information under the Services tab and in the Shop including the Intake and Service Option form to send in to get started.
LEGAL NOTICE: The contents of this blog, including text, images and cited statistics as well as all other material contained here (the ”content”) are for information purposes only. The content is not intended to be a substitute for professional advice, medical diagnosis and/or treatment and is not suitable for self-administration without the knowledge of your physician and regular monitoring by your physician. Do not disregard medical advice and always consult your physician with any questions you may have regarding a medical condition or before implementing anything you have read or heard in our content.
References
Davies M.J., D’Alessio D.A., Fradkin J., et al, Management of Hyperglycemia
in Type 2 Diabetes, 2018. A Consensus Report by the American Diabetes Association (ADA) and the European Association for the Study of Diabetes (EASD), Diabetes Care, October 2018, https://doi.org/10.2337/dci18-0033
Click here for pdf of the full article.
U.S. Department of Health and Human Services: Final MNT regulations. CMS-1169-FC. Federal Register, 1November2001. 42 CFR Parts 405, 410, 411, 414, and 415
The new joint American Diabetes Association (ADA) / European Association for the Study of Diabetes (EASD) position paper [1] published online ahead of print on October 4th now classifies a low carbohydrate diet as Medical Nutrition Therapy. in the treatment of Type 2 Diabetes in adults. What this means is these two organizations which are responsible for educating over 30 million Americans and 60 million Europeans diagnosed with Diabetes consider a low carbohydrate not only safe, but effective therapeutic treatment. This recognition comes on the heels of Diabetes Australia having just released in late August their own updated position paper designed to provide practical advice and information for people diagnosed with Diabetes who are considering adopting a low carbohydrate eating plan [2].
What is Medical Nutrition Therapy?
Medical Nutrition Therapy (MNT) is defined as;
”nutritional diagnostic, therapy and counseling services for the purpose of disease management, which are furnished by a Registered Dietitian or nutrition professional” [3].
The American Diabetes Association and the European Association for the Study of Diabetes preface their updated position statement by saying;
“A systematic evaluation of the literature since 2014 informed new recommendations.”
That is, upon a review of the most current research, these two organizations have updated their prior position statements and now consider a low carbohydrate diet defined as <26%* of daily calories as carbohydrate [1] is suitable for the purpose of disease management of Type 2 Diabetes in adults.
*Note: based on an 1800-2000 calorie per day diet this amount of daily carbohydrate would be less than < 113-125 g daily. In fact, the position paper concludes that carbohydrate restriction of 26—45% is ineffective.
The new joint position statement elaborates that Medical Nutrition Therapy (MNT) is made up of an education component and a support component in order to enable patients to adopt healthy eating patterns with the purpose of “managing blood glucose and cardiovascular risk factors” and “reducing the risk for Diabetes-related complications while preserving the pleasure of eating” [1]. The paper defines the two basic dimensions of MNT as diet quality and energy restriction and outlines the benefits of a low carbohydrate diet in the section on diet quality.
page 12 of the joint position statement (courtesy of Jan Vyjidak)
Furthermore, the joint consensus paper lists under diet quality (Table 2, page 13) which is one of the aspects of Medical Nutrition Therapy, several diets considered suitable for adults with Type 2 Diabetes, including a low carbohydrate diet.
Table 2 —Glucose-lowering medications and therapies available in the U.S. or Europe
This move has far-reaching significance!
Publication of this paper indicates that the current scientific literature supports that a low carbohydrate is not only safe for use in adults, but is also effective in lowering metabolic markers of Type 2 Diabetes, as well as delaying or eliminating the need for blood-glucose lowering medications for up to 4 years [1].
It moves a low carbohydrate diet from the realm of a popular lifestyle approach to Medical Nutrition Therapy.
Most importantly, this consensus paper means that qualified healthcare professionals throughout the USA and Europe can now recommend a low carbohydrate diet to their adult patients in order to enable them to manage their Type 2 Diabetes. This is a huge step forward from only being able to provide such a diet based on person’s individual preference to follow a low carbohydrate lifestyle.
Some final thoughts…
The American Diabetes Association, European Association for the Study of Diabetes and Diabetes Australia have collectively led the way for international Diabetes Associations the world over to re-evaluate their own treatment and dietary recommendations in light of the most current scientific evidence and update their position statements regarding the safe and effective use of low carbohydrate diets in the management of Type 2 Diabetes in adults.
Perhaps you have wanted to follow a low carbohydrate lifestyle and have questions about how such a diet could help you manage some of your clinical conditions or lose weight. Please send me a note using the Contact Me form above and I will reply as soon as I am able.
Whether you live locally or away, I provide services in-person in my Coquitlam (British Columbia) office, as well as via Distance Consultation (Skype or phone). You can find more information under the Services tab and in the Shop including the Intake and Service Option form to send in to get started.
LEGAL NOTICE: The contents of this blog, including text, images and cited statistics as well as all other material contained here (the ”content”) are for information purposes only. The content is not intended to be a substitute for professional advice, medical diagnosis and/or treatment and is not suitable for self-administration without the knowledge of your physician and regular monitoring by your physician. Do not disregard medical advice and always consult your physician with any questions you may have regarding a medical condition or before implementing anything you have read or heard in our content.
References
Davies M.J., D’Alessio D.A., Fradkin J., et al, Management of Hyperglycemia
in Type 2 Diabetes, 2018. A Consensus Report by the American Diabetes Association (ADA) and the European Association for the Study of Diabetes (EASD), Diabetes Care, October 2018, https://doi.org/10.2337/dci18-0033
Click here for pdf of the full article.
U.S. Department of Health and Human Services: Final MNT regulations. CMS-1169-FC. Federal Register, 1November2001. 42 CFR Parts 405, 410, 411, 414, and 415
The American Diabetes Association (ADA) & the European Association for the Study of Diabetes (EASD) have just released their new joint position statement which includes approval of low carbohydrate diets for use in the management of Type 2 Diabetes (T2D) in adults. This comes on the heels of Diabetes Australia having recently released an updated position statement in August titled Low Carbohydrate Eating for People with Diabetes (you can read more about that here).
This is huge!
By releasing this updated joint position statement, the American Diabetes Association (ADA) and the European Association for the Study of Diabetes (EASD) indicate that they now recognize a low carbohydrate diet as safe and effective lifestyle management of T2D in adults.
In the newly released joint position statement that was published online ahead of print on October 4, 2018 in the journal Diabetes Care, it was stated that the new recommendations were based on “a systematic evaluation of the literature since 2014” [1]. That is, approval for the use of low carbohydrate diets is based on current research.
A Full Range of Therapeutic Options
The new joint ADA & EASD position statement endorses “a full range of therapeutic options” including lifestyle management,medication and obesity management and indicate that:
“An individual program of Medical Nutrition Therapy (MNT) should be offered to all patients”.
The new joint position statement elaborates that Medical Nutrition Therapy (MNT) is made up of an education component and a support component to enable patients to adopt healthy eating patterns with the goal of “managing blood glucose and cardiovascular risk factors.” The goal is to reduce risk for Diabetes-related complications while preserving the pleasure of eating” with the two basic dimensions of MNT including diet quality and energy restriction.
Diet Quality and Eating Patterns
The joint American and European position paper on the management of T2D states clearly;
“There is no single ratio of carbohydrate, proteins and fat intake that is optimal for every person with Type 2 Diabetes.”
but
“Instead, there are many good options and professional guidelines usually recommend individually selected eating patterns that emphasize foods of demonstrated health benefit, that minimize foods of demonstrated
harm and that accommodate patient preference and metabolic needs, with the goal of identifying healthy dietary habits that are feasible and sustainable.”
Included in this category are;
the Mediterranean Diet
the Dietary Approaches to Stop Hypertension (DASH) Diet
Low Carbohydrate Diets
Vegetarian Diets
The joint position paper noted that;
“Low-carbohydrate diets (<26% of total energy) produce substantial reductions in HbA1c at 3 months and 6 months with diminishing effects at 12 and 24 months.”
Unfortunately the paper failed to note that the one-year Virta study data that reported that HbA1C continued to decline at one year but yes, a diminished rates.
The new joint ADA and European Association for the study of Diabetes also noted that moderate carbohydrate restriction was of no benefit;
“no benefit of moderate carbohydrate restriction (26—45%) was observed.”
page 12 of the joint position statement (courtesy of Jan Vyjidak)
The paper acknowledged that there are many different types of “low carbohydrate diets’ and the particular benefits of a low – carbohydrate Mediterranean eating pattern was in reducing the requirement for medication over 4 years;
“people with new-onset Diabetes assigned to a low carbohydrate Mediterranean eating pattern were 37% less likely to require glucose-lowering medications over 4 years compared with patients assigned to a low-fat diet”.
The paper outlines that the primary physiological actions depend on which diet is followed.
It lists advantages of using diet, including a low carbohydrate diet in the management of T2D symptoms in adults is that dietary changes are inexpensive and have no side effects.
Disadvantages of using diet, including a low carbohydrate diet in the management of T2D symptoms in adults is that it requires instruction, motivation, lifelong behaviour change and may pose some social barriers.
Yes, a well-designed low carbohydrate diet does require instruction, but for those that have the motivation to avoid the chronic health complications of Diabetes through diet and who are committed to maintaining the behaviour change, I can help!
Perhaps you’re curious about the types of services that I provide both in person in my Coquitlam, British Columbia office and via Distance Consultation (Skype, telephone)? You can find out more under the Services tab or in the Shop. If you have questions regarding getting started or would like more information, please send me a note using the Contact Me form above and I will be happy to reply as soon as I’m able to.
To your good health!
Joy
P.S. Read here why the ADA and EASD classifying a low carb diet as Medical Nutrition Therapy is so significant!
LEGAL NOTICE: The contents of this blog, including text, images and cited statistics as well as all other material contained here (the ”content”) are for information purposes only. The content is not intended to be a substitute for professional advice, medical diagnosis and/or treatment and is not suitable for self-administration without the knowledge of your physician and regular monitoring by your physician. Do not disregard medical advice and always consult your physician with any questions you may have regarding a medical condition or before implementing anything you have read or heard in our content.
References
Davies M.J., D’Alessio D.A., Fradkin J., et al, Management of Hyperglycemia
in Type 2 Diabetes, 2018. A Consensus Report by the American Diabetes Association (ADA) and the European Association for the Study of Diabetes (EASD), Diabetes Care, October 2018, https://doi.org/10.2337/dci18-0033
Click here for pdf of full article.
Hallberg, S.J., McKenzie, A.L., Williams, P.T. et al. Diabetes Ther (2018). Effectiveness and Safety of a Novel Care Model for the Management of Type 2 Diabetes at 1 Year: An Open-Label, Non-Randomized, Controlled Study. https://doi.org/10.1007/s13300-018-0373-9
I was asked an interesting question recently which was “have you found the silver bullet for reducing carb craving“? This was an interesting way to phrase something I have been asked in many different ways the last few years.
Some people have been told that it really doesn’t matter what or how much they eat as long as they only eat “real” food. Others have heard that they need to eat plenty of fat each day, and that this will work to keep them full and reduce cravings. Some have read that what they need to do is eat mostly protein with some fat or only eat during a very small ‘eating window’.
So what is the answer?
There really isn’t a ‘silver bullet’ as much as there is the need for a well-designed low carbohydrate diet that is specific to each person’s physiological needs.
Every person has different nutrient needs based on their age, stage of life, gender and activity level. As well, each individual has different degrees of insulin resistance and hyperinsulinemia and each person’s blood sugar responds differently to a carbohydrate load (called glycemic response). Much of these depends on their specific family history, their medical history and the type of foods they normally eat. [You can read more about all three of these here.]
There isn’t a ”once-size-fits-all low carb diet”. Based on all of the above factors, some people will do better with a higher ratio of protein to fat, whereas others need plenty of natural, healthy fats and average amount of protein. The amount and type of carbohydrate each person can tolerate will also be different. Since everyone’s needs are different, in designing a Meal Plan for someone, I start by conducting a complete nutritional assessment (personal medical history, family medical history, review of recent lab tests, dietary and lifestyle review, etc.) so that the Meal Plan that I design is tailored to their individual needs.
If there was a ‘silver bullet’ to eliminate carb cravings it would be to understand what causes them. Carb cravings are driven by several different hormones that the body produces in response to the way each person eats, as well as how much and how well they sleep, how they manage stress (or don’t), as well as any conditions or diseases that they have and any medications that they take. All of these affect the various hormones that impact cravings for carbohydrate-based food. When I design people’s Meal Plans, I take all of these into account.
A well-designed low carbohydrate diet designed specifically for each person and taking into account the various factors that are driving their specific carbohydrate cravings is the most effective means to addressing them.
A person’s Meal Plan is not carved in stone. If a person has a fair amount of weight to lose, their Meal Plan will change once they’ve lost a significant amount of weight or if they’ve hit a plateau where they haven’t lost either weight or inches in a while. Achieving optimal body weight is a dynamic process not a static one — as people’s needs change, so should their diet. It’s not that a person’s Meal Plan needs to be re-designed, as much as ‘tweaked’ or ‘adjusted’ to keep them moving towards achieving their goals. This is where follow-up can be helpful.
If you have questions as to how I can help you achieve your health and nutrition goals — either by taking service in-person in my office or via Distance Consultation please send me a note using the Contact Me form above and I will be happy to reply as soon as I am able.
LEGAL NOTICE: The contents of this blog, including text, images and cited statistics as well as all other material contained here (the ”content”) are for information purposes only. The content is not intended to be a substitute for professional advice, medical diagnosis and/or treatment and is not suitable for self-administration without the knowledge of your physician and regular monitoring by your physician. Do not disregard medical advice and always consult your physician with any questions you may have regarding a medical condition or before implementing anything you have read or heard in our content.
In a landmark decision yesterday the Australian Health Practitioner’s Regulation Agency (AHPRA) dropped all charges of wrong-doing against orthopedic surgeon Dr. Gary Fettke for recommending a low carb high fat lifestyle to his patients. This is great news for a physician who had tired of amputating the gangrenous limbs of patients with uncontrolled Diabetes when lifestyle changes could not only spare their limbs, but their lives. It was not only Dr. Fettke that was investigated, but also the strength of the scientific evidence behind his dietary recommendation of a low carbohydrate diet. That is the subject of this article.
It is great news that AHPRA ruled that Dr. Fettke had caused no patient harm by his recommendation of a low carb high fat (LCHF) diet:
”…no significant risks to public safety have been identified that require a regulatory response under the National Law. In the case of each of the three issues considered, there is no evidence of any actual harm and nor does the Board discern any particular risk to public health and safety moving forward. For these reasons, the Board has decided to take no further regulatory action.”
— AHPRA medical board
It is outstanding that AHPRA apologized in writing to Dr. Fettke for the 4½ years of distress caused to him by the investigative process;
“I would like to take this opportunity to apologize for the errors that were made when dealing with this notification. We recognize that these errors are likely to have compounded any distress that you experienced as a result of being the subject of this investigation. We appreciate your cooperation and engagement through the complaint management process, and the reconsideration of the previous decision.”
— AHPRA medical board
This is fantastic news and must come as a tremendous relief both to Dr. Fettke and to his family who have endured untold stress from this long ordeal.
Dr. Fettke’s exoneration comes on the heels of the results of not one, but two trials over a 4-year period against South African Professor Tim Noakes for his response to a tweet on Twitter social media from a breastfeeding mother in February 2014 where he recommended that good first foods for infant weaning are low carbohydrate high fat foods. As noted by Dr. Sarah Hallberg in a letter to the Health Professions Council of South Africa (HPCSA), low carbohydrate foods such as meat, chicken, fish and leafy green vegetables align closely with South Africa’s pediatric guidelines which advise that;
”From 6 months of age give your baby meat, chicken, fish, or egg every day as often as possible. Give your baby dark green leafy vegetables and orange coloured vegetables and fruit every day.”
—Food-based Dietary Guidelines for South Africa
In April 2017 and again in the appeal which concluded in June of this year, Noakes was cleared of all charges of professional misconduct by the HPCSA which confirmed that his advice to the breastfeeding woman in his tweet was neither “unconventional” nor “dangerous medical advice“.
In June, Noakes’ lawyer Adam Pike said in a statement that the HPSCA’s ruling;
”preserves the right of scientists and doctors to express scientific opinions and disseminate medical information”
— Adam Pike, Professor Tim Noakes’ lawyer
Phrased another way, Noakes acted as a scientist who tweeted scientifically based information.
While it was Dr. Gary Fettke and Professor Tim Noakes that have been investigated as individuals, what was largely on trial was the scientific evidence behind their recommendation of a low carbohydrate diet. This evidence indicates that well-designed low carbohydrate diets are both safe and effective for treating obesity and for managing the symptoms of Type 2 Diabetes.
In an article I wrote in January 2018 titled A Preponderance of the Evidence, I documented that not only is a low carbohydrate diet for the treatment of Diabetes not new, but almost a year ago there were already many research studies and meta-analyses published in 76 publications which spanned 18 years which involved 6,786 subjects which used a low-carb intervention — which included 32 studies of 6 months or longer and 6 studies of 2 years or longer all of which indicated that a low carbohydrate diet is safe. Not only has it been amply documented that a low carbohydrate diet is safe, but a low carbohydrate diet performed as well, if not better than competing diets in all of the above studies. Dr. Sarah Hallberg who compiled the above list is Medical Director at Indiana University Health Arnett and Virta Health Medical Director. She pointed out in a letter to the Health Professions Council of South Africa that data available from the US government as reported in a 2015 study indicates that in 1965 (which is just prior to the beginning of the current obesity and Diabetes epidemic) Americans ate 39% of their calories as carbohydrate and 41% of their calories as fat which is considered by many nutrition researchers today to fall within the realm of a “low carbohydrate high fat diet”. Dr. Hallberg is correct. Dietary Guidelines in both the US and Canada currently recommend that the diet be 45-65% of calories as carbohydrates and that up until 2015, the US recommended a upper limit of 35% calories as fat (<30% of calories as fat in Canada). Both countries currently still recommend limiting saturated fat to <10% of calories.
Nutrition researchers today generally consider diets less than 45% of calories as carbohydrate and >35% of calories as fat to be “low carbohydrate high fat diets”, so the average American diet that was 39% carbohydrate and 41% fat in 1965 would be considered “low carb high fat” by most nutrition research studies today.
Given the much lower rates of overweight and obesity and Type 2 Diabetes in 1965 — at a time when the average American ate what is now considered a “low carb high fat diet”, should not such a macro distribution be granted “generally recognized as safe” (GRAS) standing?
For the last 40 years, the Dietary Guidelines in both the US and Canada have been counselled people to limit fat, especially saturated fat and to eat 45-65% of their calories as carbohydrate yet even a cursory look at the rates of overweight and obesity in both countries and the steadily increasing rates of Type 2 Diabetes indicates that something is terribly wrong. Clinicians (Physicians, Dietitians, Pharmacists) educated since 1977 which is the vast amount practicing in both countries (and in South Africa and Australia apparently, where Dr. Fettke and Professor Noakes are from) have all been educated within a “low fat paradigm”— where fat is vilified as the cause of cardiovascular disease and increasing carbohydrate intake is promoted as the ‘solution’ to reducing fat intake. Unless clinicians educated in this time period stayed current with the literature they simply keep teaching what they were taught; eat less fat, eat more carbs.
In the past number of years there are increasing numbers of clinicians around the world that have considered the evidence; both epidemiological and clinical studies that indicate that a low carbohydrate high fat diet not only has no adverse impact on individual health but is safe and effective for reducing overweight and obesity, as well as reducing (and in some cases reversing) the symptoms of Type 2 Diabetes. Two such clinicians are Australian orthopedic surgeon Dr. Gary Fettke and South African Professor Tim Noakes; both of whom were investigated for having recommended a low carb high fat diet which was viewed as “dangerous” and both of whom, when the scientific evidence was considered, were exonerated. To their credit both Dr. Fettke and Professor Noakes conducted themselves with integrity and transparency through the entire process and all charges of wrong-doing against them were dropped, but let’s not lose sight that it was also because of the amount and strength of the scientific evidence which indicates that a well-designed low carbohydrate high fat diet is both safe and effective for weight loss, as well as for reducing symptoms of Type 2 Diabetes.
Both men have no doubt been through a very distressing and incredibly stressful >4-year ordeal which forever changed them and their families that went through it with them, however this story is not only about them but what they believed about the safety and efficacy of a low carb diet. It was low carb high fat diets that were investigated and put on trial and the conclusion in both cases as that such a diet is neither unconventional nor dangerous.
Yes, there are other dietary options for weight-loss and targeting the reduction of symptoms of Type 2 Diabetes and diets such as the classic Mediterranean Diet or a very low-fat calorie-restricted plant-based diet are effective for those that maintain them long term. The issue is that a well-designed low carbohydrate diet is at least as effective as these and may be easier for some to stick with long term, making it more effective for those individuals. Since the scientific evidence indicates that all three of these diets are safe and to varying degrees effective for weight loss and glycemic control, it is time for clinical guidelines in both the US and Canada to be formulated to enable clinicians in both countries to offer their patients a well-designed low carbohydrate diet as an option.
Perhaps you have questions about whether a low-carbohydrate diet would be appropriate for you or wonder how medical conditions you have or medications you take may factor in? I provide both in-person services in my Coquitlam (British Columbia) office, as well as via Distance Consultation using Skype or phone and I would be happy to answer your questions and help you reach your goals. Please send me a note using the ”Contact Me” form on the tab above and will reply as soon as possible.
LEGAL NOTICE: The contents of this blog, including text, images and cited statistics as well as all other material contained here (the ”content”) are for information purposes only. The content is not intended to be a substitute for professional advice, medical diagnosis and/or treatment and is not suitable for self-administration without the knowledge of your physician and regular monitoring by your physician. Do not disregard medical advice and always consult your physician with any questions you may have regarding a medical condition or before implementing anything you have read or heard in our content.
References
Fettke Free at Last, Foodmed.net, Sept 28 2018 (http://foodmed.net/2018/06/noakes-free-hpcsa-licks-wounds-lchf/)
Noakes: Top Doctors Globally call on HPCSA to Stop Prosecuting Him, Foodnet.net, February 14, 2018
Food-based Dietary Guidelines for South Africa, S Afr J Clin Nutr 2013;26(3)(Supplement):S1-S164
Noakes Free at Last, Foodmed.net, June 10 2018 (http://foodmed.net/2018/06/noakes-free-hpcsa-licks-wounds-lchf/)
Cohen E, Cragg M, deFonseka J et al, Statistical review of US macronutrient consumption data, 1965—2011: Americans have been following dietary guidelines, coincident with the rise in obesity, Nutrition (2015), Vol 31 (5), Pg 727-732.
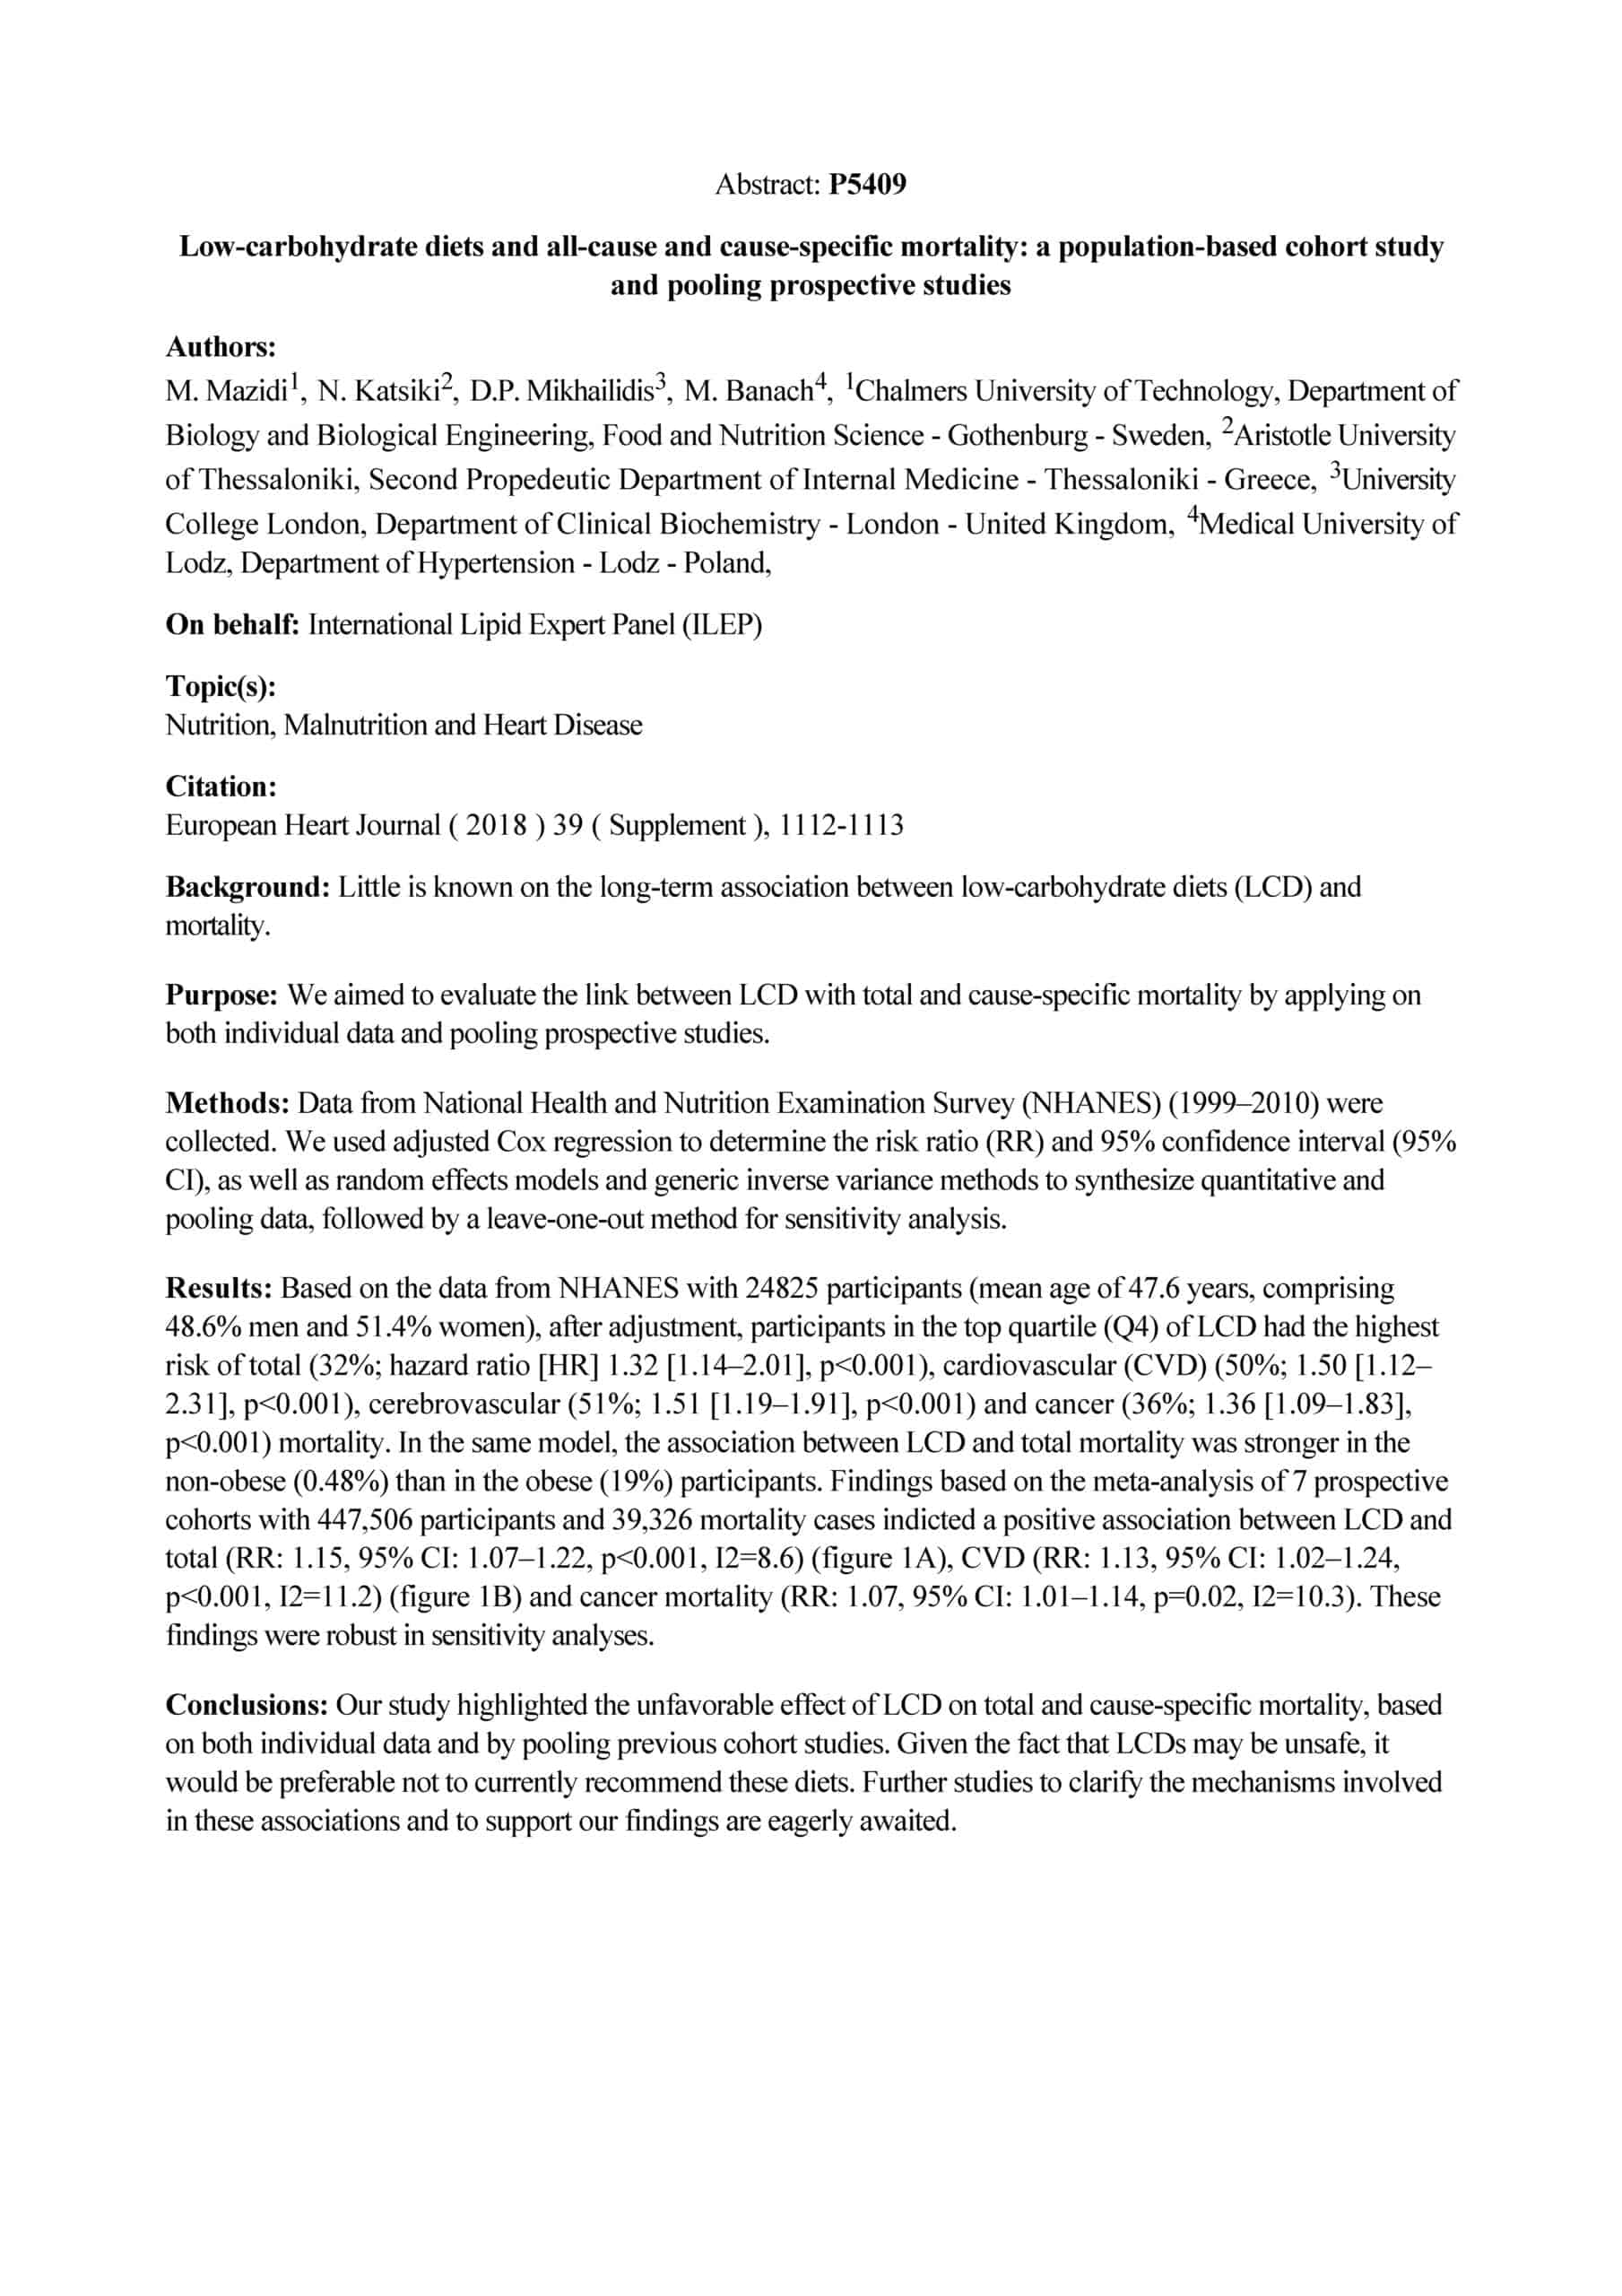
The general public relies on journalists to thoroughly research their stories before publishing them however in the above two examples and the other incidences of reporting this story it was not indicated that (1) there was no published study (2) the story was based on researcher’s conclusions in provided materials based on an Abstract from a Poster presentation and (3) the provided materials / Abstract didn’t define the term “low carbohydrate” (# of grams of carbohydrate per day) which is central to the claims of the researchers.
The supposed link to “premature death” of a “low carbohydrate diet” were said to be part of a large study that was presented at the European Society of Cardiology (ESC) Congress 2018 in Munich, Germany, but when I went to find the journal in which the study was published so I could read it, I discovered that it’s not even been published yet. I even checked the lead author’s Publication page on ResearchGate and could not find the published study. Furthermore, the findings were not presented as one of the more than 500 Conference sessions of research studies at the European Society of Cardiology Congress, but was one of the 4,500 Abstract presentations — not even as a talk, but as a Poster Session.
A “Poster Session” at an academic Conference is where 100s of researchers assemble in a large hall and stand in front of a poster summarizing their research. People walk by, look at the poster and if they wish, ask questions.
Journalists wrote stories based on “materials provided to them by the European Society of Cardiology” (see story source at bottom of ScienceDaily article) which is based on the Abstract available on the website of the European Society of Cardiology’s 2018 Congress from the yet-to-be-published study by M. Mazidi (Gothenburg, Sweden), N Katsiki (Thessaloniki, Greece), DP Mikhailidis (London, Great Britain) and M Banach (Lodz, Poland) and also published the same day (August 28, 2018) in the European Heart Journal, Volume 39 Supplemental on pages 1112-1113.
The Abstract (viewable below) is downloadable from the journal’s website and the 2018 Congress website and clearly indicates that it was a “Poster Session”.
A glaring omission from the Abstract is that it is not stated anywhere how many grams of carbohydrate per day is defined as a “low carbohydrate diet”.
The Abstract and supplied press materials claim that there is a relationship between “low carbohydrate diets” (not defined!) and death from all-causes, as well as specific death from coronary heart disease, cerebrovascular disease (stroke) and cancer and that the data analyzed was based on a representative sample of 24,825 participants of the US National Health and Nutrition Examination Survey (NHANES) from 1999 to 2010.
The researchers conclude that compared to participants with the highest carbohydrate consumption (also not defined!), those with the lowest carbohydrate intake had a 32% higher risk of all-cause death during the ~6.4-year follow-up. As well, the risk of death from coronary heart disease from “low carbohydrate”diets was 51% higher, from cerebrovascular disease (stroke) was 50% higher and from cancer was 35% higher. They furthermore state that their results were confirmed by a pooled meta-analysis of 7 prospective cohort studies with 447,506 participants and which had an average follow-up of 15.6 years which indicated that risk of death from all causes resulting from “low carbohydrate diets” was 15% higher, from cardiovascular disease was 13% higher and from cancer was 8% higher compared to high carbohydrate diets.
Wait a minute…
The researchers found risk of death from coronary heart disease and cardiovascular disease (heart attack and stroke) as ~50% higher and the pooled data of the studies they compared it to found a 13% higher incidence. Even without defining what a “low carbohydrate diet” is, a 50% increased chance of death is not comparable to a 13% increased chance of death. Similarly, the researchers found risk of death from cancer from a “low carbohydrate diet” was 35% greater and said their findings were comparable to an 8% higher incidence in the pooled data.
The researchers (1) did not define how many grams of carbohydrate per day was considered a “low carbohydrate diet” and (2) said their data was confirmed by studies that reported very different results.
Yet, they conclude;
Our study highlighted the unfavorable effect of low carbohydrate diets (LCDs) on total- and cause- specific mortality, based on both individual data and by pooling previous cohort studies. Given the fact that LCDs may be unsafe, it would be preferable not to currently recommend these diets. Further studies to clarify the mechanisms involved in these associations and to support our findings are eagerly awaited.
Which “low carbohydrate diet” did they study? How many grams of carbohydrate per day? We don’t know because the Abstract doesn’t say and the study hasn’t yet been published.
Some Final Thoughts…
It is not responsible journalism for the media to scream headlines warning of higher risk of premature death from “low carbohydrate diets” based on supplied press materials and an Abstract of a Poster Session of an unpublished study that doesn’t even define “low carb”.
There are many studies and meta-analyses using a low-carbohydrate or ketogenic dietary intervention that span 18 years and that are outlined in detail in 76 publications involving 6,786 subjects and that include 32 studies of 6 months or longer and 6 studies of 2 years or longer that demonstrate that low carb diets of a specified number of grams of carbohydrate per day are both safe and effective. You can read more about that here.
Perhaps you have questions such as is a low-carbohydrate diet appropriate for you given your health goals, medical conditions or medications you are taking? Please feel free to send me a note using the ”Contact Me” form and I will reply as soon as possible.
I provide both in-person services in my Coquitlam (British Columbia) office as well as Distance Consultation services (via Skype / long distance phone) and I’d be happy to help you achieve your health and nutrition goals.
LEGAL NOTICE: The contents of this blog, including text, images and cited statistics as well as all other material contained here (the ”content”) are for information purposes only. The content is not intended to be a substitute for professional advice, medical diagnosis and/or treatment and is not suitable for self-administration without the knowledge of your physician and regular monitoring by your physician. Do not disregard medical advice and always consult your physician with any questions you may have regarding a medical condition or before implementing anything you have read or heard in our content.
Low carbohydrate diets and all cause and cause-specific mortality – page 1
Low Carb diets and all cause mortality – European Society of Cardiology_Page_2
Reference
Mazidi M, Katsiki N, Mikhailidis DP et al, Abstract (P5409): Low carbohydrate diets and all-cause and cause-specific mortality: a population based cohort study and pooling prospective studies, European Heart Journal, Volume 39 (Supplemental), pages 1112-1113.
While DEXA scans (Dual Energy X-ray Absorptiometry) are intended to measure bone mineral density, they also provide an accurate estimate of body fat percentage but not everyone wants to- or is able to go for this kind of testing to determine how much body fat they have. While most gyms and many pharmacies often have handheld impedance body fat analyzers, these can be affected greatly by changes in body water status, as can high tech digital bathroom scales that have body fat analyzers built in.
Determining Body Fat Percentage based on BMI
Body Mass Index (BMI), which is body mass divided by the square of body height is often used to determine whether someone is normal weight, overweight or obese despite the fact that it is limited in its ability to estimate body fat percentage due to misclassification of body fat-defined obesity. For example, a BMI ≥30 which indicates obesity overlooks nearly 50% of women who have a body fat percentage > 35% which the cutoff for obesity. The US Third National Health and Nutrition Examination Survey estimated the diagnostic accuracy of BMI for body fat-defined obesity at 94% for women and 82% for men [1].
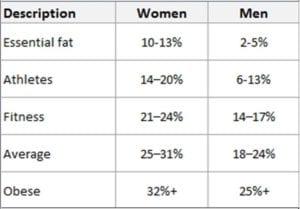
The body fat percentage chart below from the American Council on Exercise (ACE) is a commonly used by trainers and gyms to determine body fat percentage but is limited since it is based on BMI.
ACE body fat percentage chart
Determining Body Fat Percentage Based on Anthropometrics
There are a number of equations based on body measurements (anthropometrics) that have been proposed as alternatives to BMI to better estimate whole body fat percentage. Some require more than 10 different measurements, others require up to 4 different skin-fold measurements using calipers and even others are complex equations using multiple measurements. The common problem amongst all of the existing equations is a lack of simplicity, limiting their use in routine Dietetic or medical practice.
Determining Body Fat Percentage Using Relative Fat Mass (RFM)
A recently published study systematically explored more than 350 anthropometric measurements with the aim of identifying a simple linear equation that is more accurate than BMI at estimating whole body fat percentage in both men and women.
The equation is amazingly simple;
Relative Fat Mass (RFM): 64−(20í—(height/waist))+(12í—sex),where sex = 0 for men and 1 for women.
Click here for an article on how to accurately measure your waist circumference for use in this equation.
Compared with BMI, the Relative Fat Mass (RFM) equation was more accurate for body fat-defined obesity among both men and women over 20 years old and RFM was more accurate than BMI for those with a high body fat percentage and this accuracy held for those that were Mexican-Americans, European Americans and Africans-Americans.
Looking at the equations another way, Relative Fat Mass (RFM) in both metric and American measurements is;
Relative Fat Mass (RFM):
Men: 64 — (20 x height/waist circumference)
Women: 76 — (20 x height/waist circumference)
How to Interpret Relative Fat Mass Results
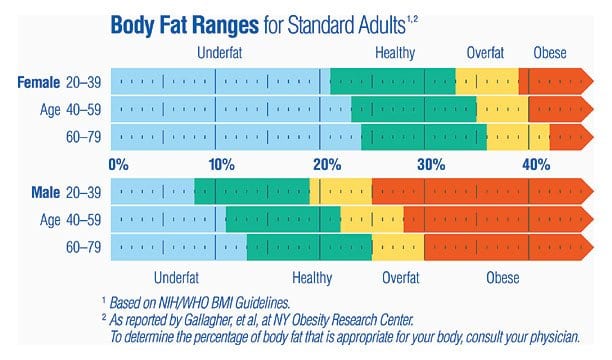
Based on the research of Gallagher et al and data from the World Health Organization, health body fat ranges have been determined as follows;
Body Fat Ranges for Standard Adults
A 41 year old male with an RFM of 32.2 would be considered at the low end of “obese”.
A 60 year old female with an RFM of 38.9 would be classified at the low end of “overfat”.
A 50 year old female with an RFM of 33.4 would be classified at the higher end of the “healthy” range.
Some Final Thoughts…
Obesity is an significant risk factor for multiple chronic diseases and conditions including Diabetes, coronary artery disease, hypertension (high blood pressure) and certain types of cancer [1].
This new and very simple equation accurately estimates whole body fat percentage enable individuals to easily calculate whether they are have increased weight to lose and will enable clinicians to help their patients achieve optimal weight and waist circumference.
If you want to learn how to eat well and lose weight and inches and achieve a healthy body weight and waist circumference, I can help. I offer a number of services and packages that can be taken in-person in my Coquitlam (British Columbia office) or via Distance Consultation (Skype, long distance telephone). You can click on the Services to learn more or have a look around the Shop. Please feel free to send me a note using the Contact Me form on the tab above if you have questions and I will reply as soon as possible.
LEGAL NOTICE: The contents of this blog, including text, images and cited statistics as well as all other material contained here (the ”content”) are for information purposes only. The content is not intended to be a substitute for professional advice, medical diagnosis and/or treatment and is not suitable for self-administration without the knowledge of your physician and regular monitoring by your physician. Do not disregard medical advice and always consult your physician with any questions you may have regarding a medical condition or before implementing anything you have read or heard in our content.
References
Woolcott OO, Bergman RN. Relative fat mass (RFM) as a new estimator of whole-body fat percentage ─ a cross-sectional study in American adult individuals, Scientific Reports; Volume 8, Article number: 10980 (2018), https://www.nature.com/articles/s41598-018-29362-1
Gallagher, D. et al. Healthy percentage body fat ranges: an approach for developing guidelines based on body mass index. Am J Clin
Nutr 72, 694—701 (2000).
For the second time in the last few days, dire warnings about the dangers of eating certain foods and not eating others dominated the headlines. In a previous post, I addressed the Harvard-based study which claimed that low carb diets shorten lifespan. This post is about a claim made by an adjunct professor from Harvard that ‘coconut oil is pure poison’.
While the coconut oil story only broke this week, the lecture given by Dr. Karin Michels where she issued the dire warning about coconut oil took place on July 10, 2018 and is posted on YouTube in German [1]. In a talk titled “Coconut oil and other nutritional errors”, Dr. Michels, adjunct professor of epidemiology at Harvard T.H. Chan School of Public Health and Director of the Institute for Prevention and Tumor Epidemiology at the University of Freiburg in Germany said;
“I can only warn you urgently about coconut oil. This is one of the worst foods you can eat.”
Michels called the health claims about coconut oil “absolute nonsense” and said it’s “pure poison” for its saturated fat content and its threat to cardiovascular health [2].
For purposes of this article, let’s first look at the (1) health claims surrounding coconut oil and then (2) the belief that saturated fat is a threat to cardiovascular health.
(1) Health Claims about Coconut Oil
Most of the health claims surrounding coconut oil relate to the fact that it contains Medium Chain Triglycerides or MCTs which are metabolized differently than long chain fatty acids, going directly to the liver rather than requiring to be broken down through digestion.
Half (44 — 52%) of the saturated fat in coconut oil is a specific Medium Chain Triglyceride called lauric acid [3].
A quarter (~24%) to a third (33%) of the fatty acids in coconut oil contain the long-chain saturated fats, including mysteric (13-19 %) and palmitic acid (8-11%) and ~10-20% of the fatty acids are made up of 2 short chain saturated fatty acids, caproic (decoic) acid (5-9%) and caprylic acid (6-10%) [3].
The remaining 10% of the fatty acids in coconut oil are unsaturated, mostly oleic acid, with a small amount of linoleic acid [3].
Specific Health Benefit Claims of Coconut Oil
There are studies using 100% medium chain triglycerides that have shown modest weight loss with use of MCT oil compared with olive oil over a 4-month period , however a study comparing coconut oil (~50% MCTs) with soy bean oil (almost all long chain triglycerides) did not have a significant impact on weight loss over a 3-month period [4]. While the actual amount of weight loss with MCT oil may not be substantial, studies seem to indicate that it is ”visceral adiposity” or ”belly fat” that decreases, lowering waist circumference[4].
Something that needs to be kept in mind is that only ~ 1/3 of the fat in coconut oil is MCT oil. Most of the fat in coconut oil is saturated fat along with a modest amount of unsaturated fat. People making “fat bombs” and drinking “Bulletproof coffee” with coconut oil while expecting the benefits reported with 100% MCT oil will likely to be disappointed. For the most part, people who add excess coconut oil to their diet as an elixir are simply adding extra energy to their diet.
Coconut Oil and Cholesterol
When it comes to cholesterol, there are numerous studies that have found that coconut oil raises HDL (the so-called ‘good cholesterol’) to a greater extent than olive oil, however some studies indicated that coconut oil may increase LDL (what used to be assumed to be ‘bad cholesterol’) whereas other studies have found that it doesn’t change LDL cholesterol, or if it did raise it it was in an insignificant amount. The issue is does it matter if LDL cholesterol is raised? Is a rise in total LDL cholesterol associated with an increased risk of heart disease?
(2) Saturated Fat is a Threat to Cardiovascular Health
The basis of the claim by the Harvard adjunct professor that coconut oil is “pure poison” rests with the fact that much of the fat in it is saturated fat and that saturated fat raises total LDL cholesterol which is associated with heart disease. But is this true?
It is commonly assumed that higher total LDL cholesterol is associated with an increased risk of heart disease, but we now know there are different type of LDL particles – not all of which are associated with atherosclerosis. While eating foods rich in saturated fat, including coconut oil will raise LDL-cholesterol, not all LDL-cholesterol is ”bad” [5].
There are two types of LDL cholesterol; the small, dense LDL which are associated with atherosclerosis and the large, fluffy LDL which are protective against cardiovascular disease [5].
While it used to be believed that total LDL-cholesterol (LDL-C) was a good proxy (indirect substitute) measurement for heart disease risk, we now know that a much more accurate measurement is the LDL-cholesterol particle number (LDL-P) which measures the actual number of LDL particles. This is a much stronger predictor of cardiovascular events than LDL-C [6] because the more particles there are, the more small, dense LDL there are.
Another good assessor of cardiovascular risk is the ratio of apolipoprotein B (apoB): apolipoprotein A (apoA) [7]. Lipoproteins are particles that transport cholesterol and triglycerides (TG) in the blood stream and are made up of apolipoproteins, phospholipids, triglycerides and cholesterol. Apolipoprotein B is an important component of many of the lipoprotein particles associated with atherosclerosis such as chylomicrons, VLDL, IDL, LDL — with most found in LDL. Since each lipoprotein particle contains one apoB molecule, measuring apoB enables the determination of the number of lipoprotein particles that contribute to atherosclerosis and for this reason that ApoB is considered a much better predictor of cardiovascular disease risk than LDL-C [7].
Is Higher Saturated Fat in the Diet Associated with Heart Disease?
Recommendations for the continued restriction of dietary fat in the US and Canada is based on the enduring belief that lowering saturated fat in the diet would lower blood cholesterol levels and reduce heart disease.
The question is does it?
A 2018 study published in the journal Nutrients looked at health and nutrition data from 158 countries from 1993-2011 and found that total fat and animal fat consumption were least associated with the risk of cardiovascular disease and that high carbohydrate consumption, particularly as cereals and wheat was most associated with the risk of cardiovascular disease [9]. Significantly, both of these relationships held up regardless of a nation’s average national income.
These findings support those of the 2017 PURE (Prospective Urban and Rural Epidemiological) study, the largest-ever epidemiological study which recorded dietary intake of 135,000 people in 18 countries over an average of 7 1/2 years, including high-, medium- and low-income nations. The PURE study found an association between raised cholesterol and lower cardiovascular risk and that ”higher carbohydrate intake was associated with higher risk of total mortality”. It also reported that ”total fat and individual types of fat were related to lower total mortality (death)” [10].
A recent study published in the American Journal of Clinical Nutrition reports that long-term consumption of the saturated fat found in full-fat dairy products is not associated with an increased risk of cardiovascular disease (atherosclerosis, coronary artery disease, etc.) or other causes of death, and may actually be protective against heart attack and stroke [11].
This recent large-scale epidemiological data provides strong evidence that eating a diet containing saturated fat is not associated with heart disease. While eating saturated fat raises blood levels of LDL cholesterol, we now know that there is more than one type of LDL cholesterol and only the small, dense LDL cholesterol is linked to atherosclerosis. The large, fluffy LDL is protective [12].
Some final thoughts…
For the last forty years, Americans and Canadians have diligently reduced their consumption of eggs, full fat cheese, butter and red meat all because they had been told that the saturated fat in these foods would raise their total LDL cholesterol (which it does) and which will predisposed them to heart disease (not necessarily). While we know that eating foods high in saturated fat will raise total LDL levels, total LDL as mentioned above is not a good measure of cardiovascular risk. LDL particle size and ApoB: ApoA are much better predictors.
Another very good estimator of heart disease risk comes from assessing triglyceride (TG):HDL ratio [8]. It is widely accepted from both sides of the saturated fat debate that high levels of TG predispose people to heart disease, especially when associated with low levels of HDL (‘good cholesterol’).
Since (1) excess carbohydrate in the diet contributes to a rise in TG level and (2) the higher the ratio of HDL is to TG, the more protective it is against heart disease, it would logically follow that including some coconut oil in the diet (which contributes to raising HDL) and minimizing excess carbohydrate (especially as refined carbs) in the diet would together have no negative impact on the risk of heart disease and likely have benefit (based on the evidence presented in previous articles).
Adding excess saturated fat – whether as coconut oil or butter in the diet achieves no special benefit but avoiding it does nothing to lower the risk of heart disease risk and may even increase it.
Coconut is not “pure poison” but it isn’t a magic elixir either. It is a healthy, natural fat rich in saturated fat with a good supply of MCT oils that can be used in moderate portions for cooking and for raising the ‘smoke point’ of butter when used in cooking (keeping butter from burning when heated). It’s time to stop vilifying saturated fat which is based on proxy measurements of total LDL cholesterol and on the assumption that increased total LDL is a predictor of heart disease. We have much more accurate proxy measures and need to use them.
If you would like some help known which fats you can and should eat and in what amounts based on your existing health conditions and weight management goals, I can help. I provide services via Distance Consultation (Skype, long distance telephone) as well as in-person in my Coquitlam (British Columbia) office.
If you have questions on my services, please send me a note using the Contact Me form located on the tab above and I ‘ll be happy to reply as soon as I’m able.
LEGAL NOTICE: The contents of this blog, including text, images and cited statistics as well as all other material contained here (the ”content”) are for information purposes only. The content is not intended to be a substitute for professional advice, medical diagnosis and/or treatment and is not suitable for self-administration without the knowledge of your physician and regular monitoring by your physician. Do not disregard medical advice and always consult your physician with any questions you may have regarding a medical condition or before implementing anything you have read or heard in our content.
References
May, A. USA Today “Coconut oil is ‘pure poison,’ Harvard professor says in talk on nutrition”, August 22, 2018, https://www.usatoday.com/story/news/nation-now/2018/08/22/harvard-professor-coconut-oil-pure-poison/1060269002/?utm_source=dlvr.it&utm_medium=twitter
Drayer L, Nedelman M. CNN, The facts behind coconut oil is ‘pure poison’ claim, August 22, 2018
Chempro — Edible Oil Analysis Retrieved from http://www.chempro.in/fattyacid.htm
Liau KM, Lee YY, Chen CK, Rasool AHG. An Open-Label Pilot Study to Assess the Efficacy and Safety of Virgin Coconut Oil in Reducing Visceral Adiposity. ISRN Pharmacology. 2011;2011:949686. doi:10.5402/2011/949686.
Lamarche, B., I. Lemieux, and J.P. Després, The small, dense LDL phenotype and the risk of coronary heart disease: epidemiology, patho-physiology and therapeutic aspects. Diabetes Metab, 1999. 25(3): p. 199-211.
Cromwell, W.C., et al., LDL Particle Number and Risk of Future Cardiovascular Disease in the Framingham Offspring Study — Implications for LDL Management. J Clin Lipidol, 2007. 1(6): p. 583-92.
Lamarche, B., et al., Apolipoprotein A-I and B levels and the risk of ischemic heart disease during a five-year follow-up of men in the Québec cardiovascular study. Circulation, 1996. 94(3): p. 273-8.
Manninen, V., et al., Joint effects of serum triglyceride and LDL cholesterol and HDL cholesterol concentrations on coronary heart disease risk in the Helsinki Heart Study. Implications for treatment. Circulation, 1992. 85(1): p. 37-45.
Grasgruber, P., et al., Global Correlates of Cardiovascular Risk: A Comparison of 158 Countries. Nutrients, 2018. 10(4).
Dehghan, M., et al., Associations of fats and carbohydrate intake with cardiovascular disease and mortality in 18 countries from five continents (PURE): a prospective cohort study. Lancet, 2017. 390(10107): p. 2050-2062.
de Oliveira Otto, M.C., et al., Serial measures of circulating biomarkers of dairy fat and total and cause-specific mortality in older adults: the Cardiovascular Health Study. Am J Clin Nutr, 2018.
Lamarche, B., I. Lemieux, and J.P. Després, The small, dense LDL phenotype and the risk of coronary heart disease: epidemiology, patho-physiology and therapeutic aspects. Diabetes Metab, 1999. 25(3): p. 199-211.
Headlines are designed to attract readers to a story, to have people talking about it on social media and sharing it, so the way a study is framed is critical. Readers need to be discerning — to ask questions about the story so they can tease apart truth from significance. What do I mean by this?
A fact can be true but really be quite meaningless, having little significance, which is often the case in these types of sensationalized reports. Let me give you an example to help explain what I mean. Let’s say there are 3 blond-haired 6 year old children and 2 red-haired 6 year old children in a room and one of the red-headed children slips on some water on the floor, falls and injures themselves, I could truthfully claim that injury rate of 6 year olds is 20% (1 in 5) but that the injury rate among red-headed children is much higher, at 50%. This is true, but is it significant? First of all the study groups were too small to make a comparison meaningful and that the child’s injury had nothing to do with them having red-hair and everything to do with the fact that there was water on the floor.
Looking at the recently published study which claimed that low carb diets could shorten lifespan[1], there are several questions we need to ask ourselves to begin to determine if the findings were meaningful such as “how was the information collected”, “how many people were in each comparison group” and “were there confounding factors” (factors that could confuse understanding the data).
How was the Information Collected
Subjects were asked to complete a 66-item semi-quantitative food frequency questionnaire (FFQ) indicating how many times in the last year they ate specific foods. The FFQ it was based on was the 61-item Harvard Food Frequency Questionnaire, a page of which appears below.
That’s right, people needed to estimate how many times in the last year they ate 1 oz of chocolate, or 1 cup of breakfast cereal or an ounce of nuts. Seriously?? How accurate would you be at adding up in your head all the 1 oz servings of chocolate that you estimated that you ate in a year. If you ate breakfast cereal in a serving size other than a cup, how would you even begin to accurately estimate how many 1 cup servings you had in an entire YEAR — including for breakfast and night time snacks? Thinking about this, one can see why FFQ data is considered very inaccurate and certainly can’t be used to estimate the percentage of carbohydrate a person has in their diet!
The first part of the study took place between 1987 and 1989 and asked ~15,000 people between the ages of 45 and 64 years living in 4 communities in the US to complete the FFQ. The data from the second part of the study was a meta-analysis which combined the data from the first part of the study with data from 7 multi-national population studies using the same FFQ and the third part of the study took place between 1993—95.
Page 3 from the 61-question Harvard Food Frequency Questionnaire
One huge problem with this paper was that it assumed that even if people changed their diet between the first visit in 1987-1989 and the third visit in 1992-1993, that people didn’t change their diets from the third visit until the data was analyzed in 2013; a period of ~ 20 years. There are all sorts of reasons people change the way they eat over time including health reasons (wanting to lose weight, for example), becoming parents, changes in economic situation, getting married and having someone else doing the cooking, or taking cooking classes! Assuming people ate the same way from 1993 until 2013 makes no sense.
How Many People Were in Each Comparison Group
As with the risk of injury amongst red-headed 6 year olds in the example above, the way the groups are divided and how many people are in each group matters.
Carbohydrate ranges were broken down into 5 groups;
<30% of calories as carbohydrate
30-40% of calories as carbohydrate
40-50% of calories as carbohydrate
50-55% of calories as carbohydrate
55-65% of calories as carbohydrate
>65% of calories as carbohydrate
A major problem with how the groups were broken up was that there were only 315 people that fell in the <30% of calories as carbohydrate group compared with more than 6,000 in the 40-50% of calories as carbohydrate group and the more than 3,000 in both the 50-55% and 55-65% of calories as carbohydrate groups.
As with the risk of injury of being red-headed example above, the way the groups were divided and how few people were in the lowest group of carbohydrate consumption makes the higher relative risk of being in the lower carbohydrate group truthful, but meaningless.
Were There Confounding Factors?
There’s an even bigger problem with this study.
Researchers did not update the carbohydrate intake of subjects that developed heart disease, Diabetes, or stroke before the third visit. Let’s say that some people in the lowest carb intake group developed Type 2 Diabetes and went to see their public health Dietitian who recommended that they increase their carb intake to be around the recommended ~50% (45-65%) of their dietary caloric intake, or more. If they followed that advice and developed complications and died, their death would have been attributed to them eating a “low carb diet” rather than eating 50% or more of calories as carbohydrate over the subsequent 20 years. The same holds true with dietary changes that subjects made based on their doctor’s or Dietitian’s recommendation when they got heart disease or had a stroke. Because the groups were so lopsided in terms of size, being diagnosed with one of these serious conditions had the most impact on the lowest carb intake group because it was comparatively much smaller.
There were other confounding factors including, as someone pointed out on Twitter, that there was no mention of analysis done on alcohol consumption in the paper, so there’s no way of knowing if higher death rates were associated with higher alcohol consumption. As well, there was a higher rate of smoking in the lower carbohydrate intake group, so were the deaths smoking-related or diet-related?
Some final thoughts…
There are many more problems with this study, outlined in depth by people such as Dr. Zoe Harbcombe but there is one glaring fact. Epidemiological studies (population studies) do not establish causation. When properly done, the results of epidemiological studies indicate that there may be a relationship between factors that needs to be tested in a randomized control trial.
Nevertheless, researchers concluded that there was a ‘negative long-term association between life expectancy and a low carbohydrate diet’ (which they defined as a diet of <40% of calories as carbohydrate, which is not a low carbohydrate diet, but a moderate-carbohydrate intake.
How the dietary information was collected, how the comparison groups were set out and the how the subjects were distributed amongst those groups and the multiple significant confounding factors make it impossible to conclude that a low carbohydrate diet shortens lifespan.
Evidence that Low Carbohydrate Diets are Both Safe and Effective
There are many studies and meta-analyses using a low-carb intervention that span 18 years that are outlined in 76 publications involving 6,786 subjects and that include 32 studies of 6 months or longer and 6 studies of 2 years or longer that demonstrate that low carb diets are both safe and effective. You can read more about that here.
Do you have questions about whether a low-carbohydrate diet would be appropriate for you given your health goals? Or do you wonder how medical conditions you have or medications you take factor in? Please send me a note using the ”Contact Me” form and I’ll be happy to reply. I provide both in-person services in my Coquitlam (British Columbia) office as well as Distance Consultation services (via Skype or long distance phone) and would be happy to help.
LEGAL NOTICE: The contents of this blog, including text, images and cited statistics as well as all other material contained here (the ”content”) are for information purposes only. The content is not intended to be a substitute for professional advice, medical diagnosis and/or treatment and is not suitable for self-administration without the knowledge of your physician and regular monitoring by your physician. Do not disregard medical advice and always consult your physician with any questions you may have regarding a medical condition or before implementing anything you have read or heard in our content.
INTRODUCTION: In response to numerous inquiries from individuals, healthcare professionals and the general public, Diabetes Australia has just released a new Position Statement titled Low Carbohydrate Eating for People with Diabetes[1] said to be based on the latest evidence on the subject. Diabetes Australia is the national body responsible for making treatment and dietary recommendations for the 1.7 million people in that country living with Diabetes. The publication is designed to provide practical advice and information for people diagnosed with Diabetes who are considering adopting a low carbohydrate eating plan. Since I don’t provide dietary to support to those with Type 1 Diabetes (but defer instead to someone with CDE credentials), I have limited my discussion to recommendations pertaining only to Type 2 Diabetes.
Diabetes Australia defines low carbohydrate (“low carb”) eating patterns as those that restrict carbohydrate intake — especially processed and packaged foods and beverages including cakes, candies, chocolate, chips, ice cream and sugary drinks as well as breads, cereals, grains, potatoes, fruit and sugar. They elaborate that when people are limiting carbohydrates they eat a higher proportion of protein and fats such as those found in meat, chicken, eggs, oily fish, avocados, nuts, oils and butter and eat plenty of low carb vegetables, such as cauliflower and zucchini. In this publication, they specify that a low carbohydrate diet provides “less than 130g of carbohydrate daily/ less than 26% of total daily energy intake”[1].
“When it comes to low carb eating, there is no particular diet or standard approach.”
Diabetes Australia reinforces that the (Australian) “Dietary Guidelines provide general healthy eating advice and are a good starting point for people wanting to improve their eating habits”, but that
“there is no one-size-fits-all approach to living well with Diabetes. Everybody is different.”
The publication makes clear that Diabetes Australia “does not promote or encourage any single diet or eating plan or any particular ‘diabetes diet'” and that “every person with Diabetes needs a personalized approach and support to have the healthiest eating plan and this may change over their lifetime with Diabetes“. They mention that in recent years, low carb eating has gained popularity with the general population and has also gained interest for people with Diabetes as “an option to help lose weight and to assist in managing blood glucose levels” — because “low carb diets are relatively easy to follow”.
In formulating their Position Statement, the organization states that they rely on “strong scientific evidence before making specific health and nutrition recommendations for people with diabetes or those at risk” and that “evidence is usually based on the National Health and Medical Research Council (NHMRC) hierarchy of evidence”[2] whose components are; 1. The evidence base, in terms of the number of studies, level of evidence and quality of studies (risk of bias), 2. The consistency of the study results, 3. The potential clinical impact of the proposed recommendation, 4. The generalisability of the body of evidence to the target population for the guideline, and 5. The applicability of the body of evidence to the Australian healthcare context. This hierarchy of evidence is said to also need to take into account “the quality of the study and the likelihood that the results have been affected by bias during its conduct; the consistency of its findings to those from other studies; the clinical impact of its results; the generalisability of the results to the population for whom the guideline is intended; and the applicability of the results to the Australian (and/or local) health care setting”.
The position statement stresses that Diabetes Australia believes that
“People with Diabetes should make their own, informed choices about their Diabetes management (including eating plans) in consultation with their diabetes healthcare team”.
They recognize that “long-term studies can take years to be designed, conducted and published” and underscore that they will continue to review and update their advice in relation to low carb eating for people with Diabetes based on new evidence as it becomes available.
Key Points
[1] Based on two studies [3,4] the report states that “recent evidence has shown that in the short term (up to 6 months), lower carb eating can help with the management of Type 2 Diabetes but that this benefit is no longer evident after 12 months”.
NOTE:
(a) Both of the studies quoted [3,4] were not low carb studies but moderate carb studies of <45% (225g carbohydrate) per day. Low carbohydrate diets as defined by this paper are diets which provide “less than 130 g of carbohydrate daily/ less than 26% of total daily energy intake” and the paper defines a moderate carbohydrate diet as one that provides “130g—225g of carbohydrate daily/ 26%—45% of total daily energy intake”. The two quoted studies provided dietary intake of carbohydrate that were moderate carbohydrate. Neither was a low carbohydrate study.
(b) Interestingly, despite neither study being a low carb study, one of the quoted studies [3] found “greater weight loss at 12 months on moderate carb diets than high carb diets” — which contradicts that there was no benefit after 6 months. Even a moderate-high carb diet had benefit beyond 6 months when compared with a high carb diet!
(c) In addition, the position statement did not consider the recent publication of the 1-year study results from Virta Health [5] outlined in detail in this article.
[2] In addition to promoting weight-loss, reducing carbohydrate intake can provide health benefits that include lowered average blood glucose levels and reduced risk of heart disease such as raised cholesterol and raised blood pressure and that some benefits can be achieved independent of the amount of weight-loss achieved.
[3] All people with Diabetes who wish to follow a low carb diet should
do so in consultation with their Diabetes healthcare team.
[4] People with Diabetes who begin low carb eating should monitor their
blood glucose levels and, if necessary, talk to their doctor about the need to
adjust their Diabetes medication to reduce the risk of hypoglycaemia (low
blood glucose).
[5] People with Diabetes considering low carb eating are encouraged to seek personalized advice from an Dietitian experienced in Diabetes management as there are some practical considerations that need to be taken into account to ensure the eating plan is safe and enjoyable, provides adequate nutrition for general health, is culturally appropriate and fits into the person’s lifestyle.
[6] People with Diabetes considering low carb eating should be aware of
possible side effects (such as tiredness, headaches and nausea) and seek
advice from their health care team if concerned.
[NOTE: I’ve never heard or read about people experiencing nausea following low carb eating, and even at the beginning of following a low carb style of eating symptoms such as tiredness and headache are easily addressed with adequate fluid and electrolytes.]
[7] Low carb eating may not be safe and is not recommended for children,
pregnant or breastfeeding women, people at risk of malnutrition, people
with kidney or liver failure, or those with a history of disordered eating or some rare metabolic conditions.
[8] All people who choose to follow a low carb eating plan should be encouraged to eat foods proven to be beneficial to good health, including whole fruit and vegetables, whole-grains*, dairy foods, nuts, legumes*, seafood, fresh meat and eggs.
[*NOTE: Depending on the amount of insulin resistance and hyperinsulinemia that someone with Type 2 Diabetes has they may or may not be able to maintain glycemic (blood sugar) control eating whole-grains and legumes. In their minimally processed forms, these may be able to be re-introduced in small quantities on an individual basis after reversal of Type 2 Diabetes symptoms and lower circulating insulin levels / reduced insulin resistance.]
[9] All people should be encouraged to limit their intake of foods that are high in energy*, carbohydrate or salt*, including processed foods such as sugary drinks, chips, cakes, biscuits, pastries and candies.
[NOTE: Unfortunately, foods that are ‘high in energy’ or ‘high in salt’ are inadequately defined in this publication. “High in energy” would be better framed as “low nutrient density foods” — which are foods high in energy relative to the amount of nutrients they contain. Cheese for example may be energy-dense per 100 g but is also very nutrient-dense. What does “high in salt” means — high in salt for whom?
Perhaps you have questions as to how I could help you get started on eating low carb to lower your blood sugars, reverse symptoms of Type 2 Diabetes, reduce your risk of heart disease including raised cholesterol and blood pressure and lose weight?
Since I provide services both in-person in my Coquitlam (British Columbia) office as well as via Distance Consultation (Skype or phone), I am available to help.
Please send me a note using the Contact Me form above and I will reply as soon as I am able.
LEGAL NOTICE: The contents of this blog, including text, images and cited statistics as well as all other material contained here (the ”content”) are for information purposes only. The content is not intended to be a substitute for professional advice, medical diagnosis and/or treatment and is not suitable for self-administration without the knowledge of your physician and regular monitoring by your physician. Do not disregard medical advice and always consult your physician with any questions you may have regarding a medical condition or before implementing anything you have read or heard in our content.
Sainsbury E et al. Effect of dietary carbohydrate restriction
on glycaemic control in adults with diabetes: a systematic
review and meta-analysis. Diabetes Research and Clinical
Practice, 2018; 139: 239-252.
Snorgaard O et al. Systematic review and meta-analysis
of dietary carbohydrate restriction in patients with type 2
diabetes. BMJ Open Diabetes Research & Care, 2017;
5(1).
Hallberg, S.J., McKenzie, A.L., Williams, P.T. et al. Diabetes Ther (2018). Effectiveness and Safety of a Novel Care Model for the Management of Type 2 Diabetes at 1 Year: An Open-Label, Non-Randomized, Controlled Study. https://doi.org/10.1007/s13300-018-0373-9
The US and Canada and much of the westernized world is in the midst of a Diabetes epidemic but this is just the tip of the iceberg when it comes the underlying metabolic disruption caused by insulin. The part of the iceberg that is visible and that people know about is hyperglycemia (elevated blood sugar) but the part that is invisible and that few are aware of hyperinsulinemia (elevated blood insulin levels) which often precedes a diagnosis of pre-diabetes or Type 2 Diabetes by decades. It is this high circulating level of insulin that contributes to the significant risk of developing cardiovascular disease including heart attack and stroke, hypertension (high blood pressure), elevated cholesterol and triglycerides, non-alcoholic fatty liver (NAFLD), Poly Cystic Ovarian Syndrome (PCOS), Alzheimer’s disease and other forms of dementia, as well as certain forms of cancer including breast and colon / bowel cancer.
High blood sugar may or may not be a symptom of high levels of insulin levels and in the early stages of metabolic dysfunction almost 75% of people will have normal fasting blood glucose yet have abnormally high levels of circulating insulin. As a result, these people are at increased risk of the metabolic diseases mentioned above but unlike someone already diagnosed with Type 2 Diabetes they have no idea!
High circulating levels of insulin is entirely missed by most routine lab tests because blood sugar is being monitored as the first indication that someone is becoming insulin resistant. By the time blood glucose levels are abnormal, the β-cells of the pancreas that produce insulin are already being over-taxed to the point of exhaustion. Physicians have ”answers” (lab test results) but oftentimes are asking the wrong questions. That is, having normal fasting blood sugar or even HbA1C (3-month blood sugar average) does not necessarily mean everything is ”fine”. Most sobering is that by the time a person is diagnosed with Type 2 Diabetes they have already lost ~ 40% of their beta-cells mass sometimes more — cell loss which is currently thought to be unrecoverable.
The healthy human body maintains blood sugar in a tightly-regulated range between 60-100 mg/dl (3.3-5.5 mmol/L). When a healthy person eats food containing carbohydrate — whether as the starch in bread, pasta and rice, the sugar in milk (lactose), fruit (fructose), simple table sugar (sucrose) or high fructose corn syrup in commercially prepared foods, special glucose-sensing cells in the small intestine release signalling hormones called incretin hormones in response to the presence of these carbohydrates. The incretin hormones tell the pancreas to release insulin which in turn tells the body’s cells what to do with the energy from the food we eat; either (1) burn it or (2) send it to the liver to store it, first as glycogen, and the remainder as fat (adipose tissue). This is called fuel partitioning. When metabolic processes respond appropriately, blood sugar rises modestly after eating carbohydrate-based food but is quickly restored to its normal, tightly-regulated range soon afterwards.
Metabolic problems begin because people eat foods that contain some form of carbohydrate every few hours which results in frequent release of insulin. Glycogen levels in the muscle and liver remain close to full due to the steady supply of refined or processed carbohydrate-based food compounded by the reality that body’s cells are rarely challenged to use stored energy. In the early stages cells simply stop responding appropriately to insulin’s signal. This is called insulin resistance. Insulin resistance is the decreased ability of our cells to partition fuel. It can be compared to someone hearing a noise such as their neighbour playing music, but after a while their brain ”tunes out” the noise. Even if the neighbour gradually turns up the volume of the music, the person’s brain compensates by further tuning out the increased noise. To compensate for insulin resistance, the β-cells of the pancreas begin producing and releasing more insulin, which results in hyperinsulinemia — too much insulin in the blood.
In the early stages the body is simply trying to keep blood sugar levels within its normally tightly regulated range by making and releasing more insulin to force the cells of the body to take up the excess glucose and burn it, but this just makes the problem worse. It is the increasingly high circulating levels of insulin that contribute to the health risks and metabolic disease listed above.
Just as high blood sugar is not necessarily associated with high circulating levels of insulin, neither is obesity. Approximately 1/3 of insulin-resistant people are lean. A person who is obese simply makes more fat cells (adipocytes) in order to store the excess energy as sub-cutaneous fat (fat under the skin) which serves as a protective mechanism. Contrary to what most people assume, people don’t become insulin resistant because they are fat; becoming fat may be a protective response to high levels of circulating insulin. Those who are lean but insulin-resistant are thought to have a lower personal fat threshold’ than those that become overweight of obese. That is, they are limited in terms of how many new fat cells their body can make to store excess energy, so they store the excess energy in and around their organs in what’s called visceral fat. This is where the metabolic disruption occurs. Whether the person is obese or lean, once they have exceeded their personal fat threshold, the result is the same.
Assessing whether my clients have higher than ideal levels of insulin is as important as assessing whether they already have higher than ideal levels of blood sugar, in fact it is even more important. When people already have pre-diabetes or Type 2 Diabetes, they’ve likely been told by their doctors that they are increased cardiovascular risk and that this is a risk factor for other metabolically related conditions, including high blood pressure, fatty liver disease, Alzheimer’s and other forms of dementia and certain types of cancer. Having normal blood sugar many are told “everything is fine” when very often it is not. These people are at risk and don’t even know it.
It is important that my clients know whether they have symptoms of hyperinsulinemia and to help them understand the factors that contribute to it. This helps people to have the motivation to make necessary dietary and lifestyle changes to reduce their disease risk and totally avoid the progression to Type 2 Diabetes, long before blood sugar levels begin to rise.
For those that already are pre-diabetic or been diagnosed as having Type 2 Diabetes, it is not too late. A carbohydrate-modified diet as well implementing very specific lifestyle changes makes the reversal of symptoms entirely possible and does not require dietary or exercise extremes.
I think that for too long we as clinicians have tackled this as an insulin problem caused by overweight and created by “eating too much and moving too little” rather than as the exact opposite; that people get overweight because of an underlying insulin problem. When we address hyperinsulinemia, weight, blood sugar, blood pressure and high cholesterol and triglycerides are corrected. There are studies documenting this (covered in previous articles) and my “A Dietitian’s Journey” tells my own sample-set-of-one story reversing Type 2 Diabetes that I had for 10 years, as well as the related conditions of high blood pressure and abnormal cholesterol and triglycerides. It can be done.
Have questions as to how I can help you either in-person in my office or via Distance Consultation? Please send me a note using the Contact Me form above and I will reply as soon as I am able.
Reaven, G., Insulin resistance, type 2 diabetes mellitus, and cardiovascular disease: the end of the beginning. Circulation, 2005. 112(20): p. 3030-2.
Reaven, G.M., Pathophysiology of insulin resistance in human disease. Physiol Rev, 1995. 75(3): p. 473-86.
Taylor, R. and R.R. Holman, Normal weight individuals who develop type 2 diabetes: the personal fat threshold. Clin Sci (Lond), 2015. 128(7): p. 405-10.
Reaven, G., The metabolic syndrome or the insulin resistance syndrome? Different names, different concepts, and different goals. Endocrinol Metab Clin North Am, 2004. 33(2): p. 283-303.
Crofts, C., et al., Identifying hyperinsulinaemia in the absence of impaired glucose tolerance: An examination of the Kraft database. Diabetes Res Clin Pract, 2016. 118: p. 50-7.
Ludwig, D.S. and M.I. Friedman, Increasing adiposity: consequence or cause of overeating? JAMA, 2014. 311(21): p. 2167-8.
Crofts, C., Understanding and Diagnosing Hyperinsulinemia. 2015, AUT University: Auckland, New Zealand. p. 205.
LEGAL NOTICE: The contents of this blog, including text, images and cited statistics as well as all other material contained here (the ”content”) are for information purposes only. The content is not intended to be a substitute for professional advice, medical diagnosis and/or treatment and is not suitable for self-administration without the knowledge of your physician and regular monitoring by your physician. Do not disregard medical advice and always consult your physician with any questions you may have regarding a medical condition or before implementing anything you have read or heard in our content.
I’d heard of Alzheimer’s disease (AD) being referred to by some clinicians as ”Type 3 Diabetes” but until yesterday the link between AD and abnormalities in glucose metabolism in the brain was an academic interest. Now it’s personal. You see, yesterday I found out that my dad (90 years old) was diagnosed with Alzheimer’s disease. His once-sharp mind is no longer capable of recalling what happened yesterday or in fact what just happened. It is as though he has ”partial amnesia”.
The majority of those that are diagnosed with AD (95%) have the same form of the disease that my dad has called sporadic Alzheimer’s disease. Only 5% are diagnosed with a genetically-linked form inherited from the maternal side of the family [2].
In sporadic Alzheimer’s disease the first part of memory that is affected is the person’s unique memory of specific events (called episodic memory).
I remember three or four years ago asking my dad to recount the details of our family history from his side of the family that he often told yearly at holiday dinners — yet he couldn’t even remember their existence! I tried prompting him with parts of the story to try and trigger the memory but was met with ”I’m sorry dear, I don’t recall“. I was dumbfounded because he told this same exact story over and over again for years, and then suddenly it was gone. From his perspective, it didn’t exist. His behaviour and other forms of memory were completely normal, so I discounted his forgetfulness to ”aging” but I now know this was the first noticeable indication that something was not working as it should.
As Healthy People Age
As healthy people age, brain cells waste away (atrophy) and are not replaced such that brain volume decreases at a rate of about 1.6% / decade after the age of 30 years old [1]. So, at 40 years old, a person is expected to have a 1.6% decrease in brain volume, at 50 years old a 3.2% decrease, and so on. At 90 years old, a healthy person would be expected to have lost a little less than 10% of their brain volume.
My maternal grandmother was healthy and lived until well over 100 years old and I can see in retrospect that the kinds of memory changes my dad was showing a few years ago (at age ~85) were not simply part of normal aging.
Changes in Alzheimer’s Disease
Over the last 30 years, there has been a lot of progress in terms of understanding changes in brain energy metabolism during AD as compared with what occurs in normal, healthy aging. Until recently, many thought that lower brain function of those developing AD led to less use of glucose by the brain, but now it is thought that it is actually the other way around; that decreased glucose uptake into the cells of the brain leads to decrease metabolism in the brain. This decrease glucose uptake into the cells of the brain are believed to be a critical part of the early development of AD and that significantly lower brain glucose metabolism may be present long before the onset of any clinically measurable mental decline in AD [2].
It is now widely believed that there is decreased glucose metabolism in the brain in those with AD. When compared with healthy aged-matched people, those with AD have ~25% more brain atrophy than would be expected for their age. This is, after correction for age-associated brain atrophy, the majority of PET scan studies conducted from 1981- until the present, show that glucose utilization by the brain is decreased by as much as ~25% in AD [2].
While healthy, normal aging is associated with some slow brain atrophy, it is not thought to be associated with decreased glucose metabolism.
Normal Brain Glucose Use
The brain, heart, liver and kidneys together use ~ 60% of the body’s resting metabolic energy needs and while the heart and kidneys are metabolically more active than the brain, the brain is larger. As a result, the brain uses about ¼ of the body’s total energy needs [2]. This energy is used for blood flow in the brain, use of oxygen by the brain and for glucose metabolism — but most of the glucose used by the brain is used to maintain a glucose gradient (difference) between glutamate neurons which enable communication along this neurotransmitter system.
Glucose transporters (GLUTs) bring glucose into the brain in a three-step process: (i) Transport across the blood-brain barrier (ii) transport into the brain cells (astrocytes) and (iii) transfer of the glucose into the neurons of the glutamate neurotransmitters.
When the brain is active, the Adenosine Triphosphate molecule (ATP) which is the ”currency” of energy transfer inside cells decreases, and the brain needs more glucose, so glucose uptake is stimulated by the cell. It is unknow at what point partial reduction in glucose transport begins to limit brain function in AD.
Brain Glucose Use in Alzheimer’s Disease
Alzheimer’s Disease is a neurodegenerative disease that results in progressive worsening of memory and cognitive function, as well as behavior changes and disorientation.
Even though normal healthy aging is not associated with AD, aging itself is the main risk factor for sporadic AD, with rates ~doubling every five years after 65 years of age [3] and affecting more than 60% of people over the age of 95 years of age [4].
The brain of those with AD is marked by an accumulation of βeta-amyloid plaques between brain cells and by neurological ”tangles” within brain cells. As mentioned earlier, there are two types of AD — familial / early onset AD and sporadic / late onset AD. The early onset type is much rarer (~5% of all AD) and is inherited from the maternal (mother’s) side of the family. Except for a different age of onset, what is seen clinically, and the progression of decreased cognitive function is not significantly different between the two types of AD. The βeta —amyloid plaques occur slowly before any change in memory or understanding become apparent. The progressive brain atrophy speeds up later in the disease process, bringing the cognitive decline frequently associated with AD.
There are also other forms of dementia besides Alzheimer’s disease, including fronto-temporal dementia and vascular dementia but these are very different from either of the two sub types of AD.
PET scan studies point to lower brain glucose metabolism in AD, with difference between normal aging subjects and those with AD being as much as ~20—25% lower in AD with most of the atrophy occurring in the region of the brain called the hippocampus, which is involved in memory processing.
Mild Cognitive Impairment (MCI)
There is intermediate stage between normal healthy aging and AD, called Mild Cognitive Impairment (MCI) which includes some decreased thinking ability (cognitive decline). When these thought process changes and memory loss are present in the elderly, but don’t significantly affect daily life or interactions it is considered to be MCI. There are a few studies of glucose metabolism in MCI which show that it is lower than in healthy aged-match controls but less than in moderate to severe AD.
As MCI progresses to AD, glucose usage decreases in additional regions of the brain (cingulate, inferior parietal lobes, temporal lobes) [2].
Nutritional Factor that Affects Glucose Metabolism
The omega-3 fatty acid found mainly in fatty fish known as Docosahexaenoic acid (DHA; 22:6ρ‰3) is known to have an important role in normal brain development. In animal studies, supplementation with DHA was found to increase expression of the glucose transporters (GLUTs) that bring glucose into the brain and in primate studies, brain DHA concentration was found to be directly proportional to brain glucose uptake in the same region of the brain [2]. Insufficient intake of DHA and/or low levels in the hippocampus (the region of the brain initially impacted by AD) may play a role in cognitive decline in older adults.
Metabolic Factors that Affect Glucose Metabolism
While the glucose transporters (GLUTs) involved in getting glucose across the blood-brain barrier and into the brain cells (GLUT1) and across glutamate neurons (GLUT3) are not sensitive to insulin, GLUT4 which is another glucose transporter involved in memory and cognition in areas of the brain including the hippocampus are insulin-sensitive [5]. It is thought that brain insulin signaling may be defective in AD [5].
Older adults and the elderly often develop glucose intolerance which often progresses to Type 2 Diabetes then to Metabolic Syndrome which is a combination of Type 2 Diabetes, high blood pressure (hypertension), increased waist circumference (visceral obesity) and abnormal cholesterol tests (dyslipidemia).
Insulin resistance, which often comes before glucose intolerance / high blood sugar tops the list of known risk factors to cognitive decline [5, 6] and younger adults that are obese are predisposed to Metabolic Syndrome which is associated with increased risk of degenerative changes in the brain [6].
Decreased skeletal muscle mass (sarcopenia) in older adults and the elderly may contribute to the increased risk of insulin resistance associated with aging, as muscle is the main site of insulin-mediated glucose utilization in the body. In older adults, adequate dietary protein intake as well as incorporating some form of resistance training of large muscle groups may play a role in decreasing cognitive decline by increasing glucose update from the blood to the muscle where it can then be transported to areas of the brain.
Ketones: the body’s preferred alternative fuel
In healthy people that haven’t eaten in while (such as after an overnight fast or a during relatively long period of time between meals) ketone bodies (ketones) are the body’s key replacement fuel which maintains brain function. The brain even has a separate transport system for ketones which is independent of glucose transport [2].
When blood sugar levels drop over a period of several hours or even days during fasting the energy requirements of the body are dependent on the availability of two ketones — acetoacetate and β-hyydroxybutyrate for normal function. During prolonged fasting over a period of days and in starvation up to ~60% of the human brain’s energy requirements can be met by a combination of acetoacetate and β-hydroxybutyrate [7].
The brain can convert ketones to ATP, the energy ”currency” of the cell by oxidizing ketones (converting β-hydroxybutyrate to acetoacetate, acetoacetate to acetoacetyl CoA, and acetoacetyl CoA to acetyl CoA which then is used to generate ATP). While brain cells (astrocytes) can beta-oxidize fatty acids [8] to produce ketones, transport of fatty acids across the blood-brain barrier is too slow to make fatty acids as useful alternative as fuel for the brain.
Ketones cannot fully replace glucose as a brain fuel as a small quantity of glucose is essential for the brain, however this does not need to be supplied in the diet but can be manufactured by the liver (as well as to a lesser degree by the kidneys and the intestines) from fat or protein in a process known as gluconeogenesis (literally ”making new glucose”).
The body can make ketones from fat stores in a process called ketogenesis but first there needs to be a lowering of blood glucose, which will result in decreased blood insulin levels. This can occur during fasting, as well as by following a low-carbohydrate diet. When insulin level decreases, free fatty acids from fat cells (adipose tissue) can be freed into the blood. These long chain fatty acids are then brought to the liver where they are broken down (β-oxidized) to acetyl CoA, which are then condensed into ketones.
Use of a Therapeutic Ketogenic Diet in Alzheimer’s Disease
It is thought that in Alzheimer’s disease the combination of brain glucose insufficiency and the inadequate supply of naturally-produced ketones (which normally would naturally be produced by the body in response to low blood glucose) puts the high energy consuming areas of the brain in mild, but constant shortage of energy.
Since the brain can’t get its main fuel source which is glucose nor its preferred back- up fuel source which are ketones (because blood glucose doesn’t drop) this forces the brain to rely on a third, but inadequate source of energy — which is making glucose from fat stores or protein (gluconeogenesis).
Over time, specific regions of the brain such as the hippocampus are thought to be put in a situation of long-term chronic fuel shortage and gradually these brain cells burn out’, which leads to the brain changes seen in Alzheimer’s Disease [2].
It is thought that if brain ketone metabolism is unaffected in AD — or at least is affected less than glucose, a ketogenic diet may provide the brain with ketones it can use as an alternative fuel to glucose, enabling it to function more normally, reducing cognitive decline resulting from brain glucose insufficiency.
If you have questions about how eating a low carbohydrate diet can significantly reduce insulin resistance, a major risk factor for Alzheimer’s disease, as well as reverse symptoms of Metabolic Syndrome, please send me a note using the “Contact Me” form on this web page and I’ll be glad to reply as soon as I’m able. Remember, I provide services via Distance Consultation (via secured Skype) as well as in-person in my Coquitlam office.
LEGAL NOTICE: The contents of this blog, including text, images and cited statistics as well as all other material contained here (the ”content”) are for information purposes only. The content is not intended to be a substitute for professional advice, medical diagnosis and/or treatment and is not suitable for self-administration without the knowledge of your physician and regular monitoring by your physician. Do not disregard medical advice and always consult your physician with any questions you may have regarding a medical condition or before implementing anything you have read or heard in our content.
References
Svennerholm, L., K. Bostrí¶m, and B. Jungbjer, Changes in weight and compositions of major membrane components of human brain during the span of adult human life of Swedes. Acta Neuropathol, 1997. 94(4): p. 345-52.
Cunnane, S., et al., Brain fuel metabolism, aging, and Alzheimer’s disease. Nutrition, 2011. 27(1): p. 3-20.
Canadian study of health and aging: study methods and prevalence of dementia. CMAJ, 1994. 150(6): p. 899-913.
Brayne, C., et al., Dementia before death in ageing societies–the promise of prevention and the reality. PLoS Med, 2006. 3(10): p. e397.
Watson, G.S. and S. Craft, Modulation of memory by insulin and glucose: neuropsychological observations in Alzheimer’s disease. Eur J Pharmacol, 2004. 490(1-3): p. 97-113.
Raffaitin, C., et al., Metabolic syndrome and risk for incident Alzheimer’s disease or vascular dementia: the Three-City Study. Diabetes Care, 2009. 32(1): p. 169-74.
Cahill, G.F., Fuel metabolism in starvation. Annu Rev Nutr, 2006. 26: p. 1-22.
Guzmán, M. and C. Blázquez, Is there an astrocyte-neuron ketone body shuttle? Trends Endocrinol Metab, 2001. 12(4): p. 169-73.
Those who are younger than 40 years old probably grew up hearing that saturated fat is ”bad” and polyunsaturated fat is ”good”, but where did we get this idea and is it true?
The process of what I call the ”vilification of fat” began when researcher Ancel Keys presented a graph at a talk at Mount Sinai Hospital in New York in January 1953 and later published it in a research paper titled Atherosclerosis: a problem in newer public health [1]. It was said to show the relationship between fat calories as a percentage of total fat” and the number of deaths from degenerative heart disease per 100,000 people’ for men between the ages of 45-49 and 55-59. The linear relationship of these data points from the Six Country Study (Japan, Italy, England & Wales, Australia, Canada and the USA) suggested that there was a strong relationship between the amount of fat calories as a percentage of dietary intake and deaths from degenerative heart disease for men aged 55-59. At the time of publication of the Six Country Study, Keys said that it was possible to only get complete data from those 6 countries [1] at the time. He concluded;
”Whether or not cholesterol etc. are involved, it must be concluded that dietary fat somehow is associated with cardiac diseases mortality, at least in middle age [1].
In Key’s mind, the total amount of dietary fat was ”somehow associated” with cardiac death in middle aged men, but he expressed doubt whether or not cholesterol was involved.
In 1957, Yerushalamy and Hilleboe [2] published data from 22 countries which showed there was no linear relationship between fat calories as a percentage of total fat” and the number of deaths from degenerative heart disease per 100,000 people’.
Keys went onto conduct what became known as the Seven Country Study which collected data on almost 13,000 men aged 40-59 from the USA, Finland, the Netherlands, Yugoslavia, Greece and Japan. Findings were only published in 1970 in the journal Circulation in several papers from separate countries [3]. Keys no longer believed that total fat was associated with heart disease but that saturated fat was the villain. Keys concluded that the average consumption of animal foods (with the exception of fish) was positively associated with 25-year heart disease death rates and that the average intake of saturated fat was strongly related to 10 and 25-year coronary heart disease death rates.
What solidified this association was that the 1970 publication on the Seven Country Study contained Keys’ 1953 graph from the Six Country Study (above) [4]. Even though it indicated a linear relationship between total fat intake and degenerative heart disease it became tied in the minds of many that this graph ”proved” that saturated fat was linked to heart disease—even though that is not what the graph shows at all. It isn’t even about saturated fat. Keys also neglected to mention Yerushalamy and Hilleboe’s data from 22 countries showed no relationship between total fat consumption and heart disease.
The Diet Heart Hypothesis
The diet-heart hypothesis originated with Ancel Keys and is the belief that eating foods high in saturated fat contributes to heart disease. Keys believed that replacing fat from meat, butter and eggs with newly-created polyunsaturated vegetable oils such as soybean oil would reduce heart disease and deaths by lowering blood cholesterol levels.
The Sugar Industry Funding of Research Vilifying Fat
In the mid-1960’s, the Sugar Research Foundation (predecessor of the Sugar Association) wanted to offset research that had been published and that suggested that sugar was a more important a cause of heart disease and stroke from atherosclerosis than dietary fat. The Sugar Research Foundation invited Dr. Fredrick Stare and the late Dr. D. Mark Hegsted of Harvard’s School of Public Health Nutrition Department to join its scientific advisory board and then approved $6,500 in funds ($50,000 in 2016 dollars) to support a review article that would respond to the research showing the danger of sucrose [5]. Letters exchanged between the parties came to light a November 2016 article published by Kearns et al [6] which said that the Sugar Research Foundation had tasked the Harvard researchers with preparing ”a review article of the several papers which find some special metabolic peril in sucrose and, in particular, fructose [7]”.
The Sugar Industry paying researchers to blame dietary fat and vindicate sugar for heart disease seems a little like the tobacco industry having secretly funded articles demonstrating that something other than smoking was responsible for lung cancer.
In August 1967 the New England Journal of Medicine published the first review article written by Drs. Stare, Hegsted and McGandy titled ”Dietary fats, carbohydrates and atherosclerotic vascular disease” which stated;
”Since diets low in fat and high in sugar are rarely taken, we conclude that the practical significance of differences in dietary carbohydrate is minimal in comparison to those related to dietary fat and cholesterol“.
The report concluded;
”the major evidence today suggests only one avenue by which diet may affect the development and progression of atherosclerosis. This is by influencing the levels of serum lipids [fats], especially serum cholesterol.”
The Harvard researchers went on to say;
”there can be no doubt that levels of serum cholesterol can be substantially modified by manipulation of the fat and cholesterol of the diet” and that “on the basis of epidemiological, experimental and clinical evidence, that a lowering of the proportion of dietary saturated fatty acids, increasing the proportion of polyunsaturated acids and reducing the level of dietary cholesterol are the dietary changes most likely to be of benefit.”
At no point did Stare, Hegsted and McGandy disclose that they were paid by the Sugar Research Foundation for the two-part review.
A commentary in the Journal of Accountability in Research [8] summarized the significance of those articles as follows;
“Researchers were paid handsomely to critique studies that found sucrose [sugar] makes an inordinate contribution to fat metabolism and heart disease leaving only the theory that dietary fat and cholesterol was the primary contributor.”
The same Dr. Hegsted that was funded by the Sugar Industry to write the above articles vindicating sugar and vilifying dietary fat went on to work on editing the 1977 US Dietary Guidelines [9], which entrenched the vilification of fat into the US Food Pyramid for the next 40+ years. The rest, they say, is history.
The same year (1977), Canada’s Food Guide recommended that Canadians limit fat to <30% of daily calories with no more than 1/3 from saturated fat but did not specify an upper limit for dietary cholesterol. This was based on the belief that total dietary fat and saturated fat were responsible blood levels of LDL cholesterol levels and total serum cholesterol [10]. Cholesterol in general (total cholesterol) and LDL cholesterol was assumed to be tied to heart disease, so the focus was on lowering the proxy measurements of LDL cholesterol and total cholesterol.
Recommendations for the continued restriction of dietary fat continued in both the US and Canada in the 2015 revision of the Dietary Guidelines based on the enduring belief that lowering saturated fat in the diet would lower blood cholesterol levels and reduce heart disease.
The question is does it?
A 2018 study published in the journal Nutrients looked at health and nutrition data from 158 countries from 1993-2011 and found that total fat and animal fat consumption were least associated with the risk of cardiovascular disease and that high carbohydrate consumption, particularly as cereals and wheat was most associated with the risk of cardiovascular disease [11]. Significantly, both of these relationships held up regardless of a nation’s average national income.
These findings support those of the 2017 PURE (Prospective Urban and Rural Epidemiological) study, the largest-ever epidemiological study which recorded dietary intake of 135,000 people in 18 countries over an average of 7 1/2 years, including high-, medium- and low-income nations. The PURE study found an association between raised cholesterol and lower cardiovascular risk and that ”higher carbohydrate intake was associated with higher risk of total mortality”. It also reported that ”total fat and individual types of fat were related to lower total mortality (death)” [12].
A recent study published in the American Journal of Clinical Nutrition reports that long-term consumption of the saturated fat found in full-fat dairy products is not associated with an increased risk of cardiovascular disease (atherosclerosis, coronary artery disease, etc.) or other causes of death, and may actually be protective against heart attack and stroke [13].
This recent large-scale epidemiological data provides strong evidence that eating a diet containing saturated fat is not associated with heart disease. While eating saturated fat raises blood levels of LDL cholesterol, we now know that there is more than one type of LDL cholesterol and only the small, dense LDL cholesterol is linked to atherosclerosis. The large, fluffy LDL is protective [14].
We now know that fat was made out to be the villain in scientific reviews paid for by the sugar industry and this combined with Ancel Key’s Diet-Heart Hypothesis ended up being the impetus for the creation of an entire food industry designed to extract fat from industrial seed oils, such as soybean oil and rapeseed (Canola). These industrial seed oils are the so-called ”healthy polyunsaturated fats” that we are encouraged to eat instead of so-called ”dangerous” saturated fat, yet these industrial seed oils are only able to be produced using solvent-based chemical extraction under very high temperature. Should we be confident in industrial fats brought to us by the same industry that brought us ”trans fats”? With a lack of evidence that natural fats such as butter or cream are dangerous, perhaps eating a bit of real animal fat and plenty of natural plant-based monounsaturated fats such as olive oil is the better way to go?
For more than forty years, generations of Americans and Canadians have avoided eggs, full fat cheese and creamery butter — and done so because they have believed that saturated fat raising LDL cholesterol predisposed them to heart disease. We know much more than we did in the 1970s when the first Dietary Guidelines were created in the US (under the watchful editorial oversight of one of the researchers that had been paid by the sugar industry to vilify fat). We now know that eating foods with saturated fat will raise LDL-cholesterol, but not all LDL-cholesterol is ”bad”[14]. Before we knew this high total LDL-cholesterol (LDL-C) was seen as a good proxy (indirect substitute) measurement for heart disease risk, but no longer.
It has been known since the early 1990s that a high TG:HDL ratio is very good estimator of coronary heart disease risk [15].
The measurement of the LDL-cholesterol particle number (LDL-P) which measures the actual number of LDL particles is a much stronger predictor of cardiovascular events than LDL-C [16] because the more particles there are, the more small, dense LDL there are.
The ratio of apolipoprotein B (apoB): apolipoprotein A (apoA) is another good estimator of cardiovascular risk. Lipoproteins are particles that transport cholesterol and triglycerides (TG) in the blood stream and are made up of apolipoproteins, phospholipids, triglycerides and cholesterol. Apolipoprotein B is an important component of many of the lipoprotein particles associated with atherosclerosis, such as chylomicrons, VLDL, IDL, LDL — with most found in LDL. Since each lipoprotein particle contains one apoB molecule, measuring apoB enables the determination of the number of lipoprotein particles that contribute to atherosclerosis and for this reason that ApoB is considered a much better predictor of cardiovascular disease risk than LDL-C [17].
In light of the recently published epidemiological evidence and much stronger proxy measurement of cardiovascular risk we must update our thinking that fat in general, or saturated fat in particular is the ”villain”. It’s not.
Perhaps you could use some help as to which fats you should eat more of and in what amounts, or on deciding on what ratio of protein to fat in your diet will best help you reach your health and weight goals? I can help.
I provide services via Distance Consultation (Skype, long distance telephone) as well as in-person in my Coquitlam office.
If you have questions on my services, please send me a note using the Contact Me form located on the tab above, and I will reply as soon as I’m able.
To our good health!
Joy
If you would like to read well-researched, credible ”Science Made Simple” articles on the use of a low carb or ketogenic diet for weight loss, as well as to significantly improve and even reverse the symptoms of Type 2 Diabetes, high cholesterol and other metabolic-related symptoms, please click here.
LEGAL NOTICE: The contents of this blog, including text, images and cited statistics as well as all other material contained here (the ”content”) are for information purposes only. The content is not intended to be a substitute for professional advice, medical diagnosis and/or treatment and is not suitable for self-administration without the knowledge of your physician and regular monitoring by your physician. Do not disregard medical advice and always consult your physician with any questions you may have regarding a medical condition or before implementing anything you have read or heard in our content.
References
Keys, A., Atherosclerosis: a problem in newer public health. J Mt Sinai Hosp N Y, 1953. 20(2): p. 118-39.
Yerushalamy, J. and Hilleboe HE, Fat in the diet and mortality from heart disease; a methodologic note. N Y State J Med, 1957. 57(14): p. 2343-54.
Coronary heart disease in seven countries. Summary. Circulation, 1970. 41(4 Suppl): p. I186-95.
Harcombe, Z., An examination of the randomised controlled trial and epidemiological evidence for the introduction of dietary fat recommendations in 1977 and 1983: A systematic review and meta-analysis. 2015, University of the West of Scotland.
Husten, L., How Sweet: Sugar Industry Made Fat the Villain. 2016.
Kearns, C.E., L.A. Schmidt, and S.A. Glantz, Sugar Industry and Coronary Heart Disease Research: A Historical Analysis of Internal Industry Documents. JAMA Intern Med, 2016. 176(11): p. 1680-1685.
McGandy, R.B., D.M. Hegsted, and F.J. Stare, Dietary fats, carbohydrates and atherosclerotic vascular disease. N Engl J Med, 1967. 277(4): p. 186-92 contd.
Krimsky, S., Sugar Industry Science and Heart Disease. Account Res, 2017. 24(2): p. 124-125.
Hegsted D.M. Introduction to the Dietary Goals for the United States. p. 17 of 130.
McDonald, B.E., The Canadian experience: why Canada decided against an upper limit for cholesterol. J Am Coll Nutr, 2004. 23(6 Suppl): p. 616S-620S.
Grasgruber, P., et al., Global Correlates of Cardiovascular Risk: A Comparison of 158 Countries. Nutrients, 2018. 10(4).
Dehghan, M., et al., Associations of fats and carbohydrate intake with cardiovascular disease and mortality in 18 countries from five continents (PURE): a prospective cohort study. Lancet, 2017. 390(10107): p. 2050-2062.
de Oliveira Otto, M.C., et al., Serial measures of circulating biomarkers of dairy fat and total and cause-specific mortality in older adults: the Cardiovascular Health Study. Am J Clin Nutr, 2018.
Lamarche, B., I. Lemieux, and J.P. Després, The small, dense LDL phenotype and the risk of coronary heart disease: epidemiology, patho-physiology and therapeutic aspects. Diabetes Metab, 1999. 25(3): p. 199-211.
Manninen, V., et al., Joint effects of serum triglyceride and LDL cholesterol and HDL cholesterol concentrations on coronary heart disease risk in the Helsinki Heart Study. Implications for treatment. Circulation, 1992. 85(1): p. 37-45.
Cromwell, W.C., et al., LDL Particle Number and Risk of Future Cardiovascular Disease in the Framingham Offspring Study – Implications for LDL Management. J Clin Lipidol, 2007. 1(6): p. 583-92.
Lamarche, B., et al., Apolipoprotein A-I and B levels and the risk of ischemic heart disease during a five-year follow-up of men in the Québec cardiovascular study. Circulation, 1996. 94(3): p. 273-8.
INTRODUCTION: To avoid ignoring important warning signs that our body is not working as it should, we first need to understand how it is supposed to work and what begins to go wrong — long before we receive a diagnosis of Type 2 Diabetes. That way we can make the necessary dietary and lifestyle changes to prevent it from ever progressing further. Type 2 Diabetes can be prevented and this article explains what to look for.
When the human body is healthy, it maintains blood sugar between 3.3-5.5 mmol/L (60-100 mg/dl). The beta (β) cells of the pancreas produce the hormone insulin, store it and release it into the blood in the correct amount and at the right time. The β-cells of healthy people are constantly making insulin and storing most of it within the cell until it receives a signal that food with carbohydrate has been eaten. β-cells constantly release a little bit of insulin all the time in very small pulses called basal insulin. This basal insulin allows the body to use blood sugar even when the person hasn’t eaten for several hours or even longer.
Normal insulin and glucose curves (adapted from Crofts, C., et al., Identifying hyperinsulinaemia in the absence of impaired glucose tolerance: An examination of the Kraft database. Diabetes Res Clin Pract, 2016. 118: p. 50-7.)
The rest of the insulin stored in β-cells is only released when blood sugar rises after the person eats foods containing carbohydrate. This insulin is released in two phases [1]. The first-phase insulin response occurs as soon as the person begins to eat and peaks within 30 minutes and can be seen at 30 minutes on the graph above.
The amount of the first-phase insulin release is based on how much insulin the body is used to needing each time the person eats. Provided the person eats more or less the same amount of carbohydrate-based food at each meal, the amount of insulin in the first-phase insulin response will be enough to move the excess glucose from the food into the cells, returning blood sugar to ~5.5 mmol/L (100 mg/dl). If there is not enough insulin in the first-phase insulin response, the β-cells will release a smaller amount of insulin within an hour to an hour and a half of the person beginning to eat. This is the second-phase insulin response [1] and can be seen at 60 minutes on the graph above.
In healthy people, the combination of the larger first-phase insulin response and the smaller second-phase insulin response is sufficient to keep blood sugar level from rising above 7.8 mmol/L (140 mg/dl), even after the person has eaten a lot of carbohydrate. In healthy people whose β-cells are working properly and receiving the correct signals from their small intestines, blood sugar levels will return to their normal fasting level between 4.6-5.5 mmol/L (83-100 mg/dl range) by 2 hours.
In the early stages when people are becoming insulin resistant, receptors in the liver and muscle cells begin to stop responding properly to insulin’s signal. To compensate, the β-cells of the pancreas begin producing and releasing more insulin (hyperinsulinemia). This can be seen on the graph below (in black), which is superimposed over the normal glucose and insulin curve (light grey).
As a result of the insulin resistance of the liver and muscle cells, it takes more insulin to move the same amount of glucose into the cells.
Beginning of insulin resistance and hyperinsulinemia (adapted from Crofts, C., et al., Identifying hyperinsulinaemia in the absence of impaired glucose tolerance: An examination of the Kraft database. Diabetes Res Clin Pract, 2016. 118: p. 50-7.)
At this point, only 3% of people will meet the criteria for diagnosis with Type 2 Diabetes [2].
Insulin resistance doesn’t come by itself but is accompanied by hyperinsulinemia — too much insulin in the blood. Hyperinsulinemia is the result of the body trying to compensate for insulin resistance by making more and more insulin to try to keep blood sugar levels normal. With ongoing high intake of carbohydrate, especially refined carbohydrate the amount of insulin that has to be released from the β-cells is enormous (see the dashed black line on the graph below compared to the dashed grey line of a healthy person).
Advancing insulin resistance and hyperinsulemia (adapted from Crofts, C., et al., Identifying hyperinsulinaemia in the absence of impaired glucose tolerance: An examination of the Kraft database. Diabetes Res Clin Pract, 2016. 118: p. 50-7.)
The first-phase insulin response won’t produce enough insulin be able to clear the extra blood glucose after a high carbohydrate meal into the cells and even the second-phase insulin response won’t be enough to overcome the insulin resistance of the cells. At this point, the β-cells of the pancreas are unable to make enough insulin to clear the excess glucose from the blood and blood glucose rises above the normal high peak of 7.8 mmol/L (140 mg/dl), to levels of 9.0 mmol/L (160 mg/dl) or higher.
In this case, since blood glucose is able to be returned to baseline after 2 hours, only 7% of people will be diagnosed with Type 2 Diabetes (T2D) [2] but clearly these people’s insulin response and blood glucose response (in black) is very dysfunctional compared to that of a healthy person (in grey). In fact, almost 30% of people will have normal blood glucose, but they already have hyperinsulinemia and insulin resistance.
If the body is forced to continue to process a high refined-carbohydrate diet, it will make more and more insulin but not without a cost to the β-cells of the pancreas. β-cell failure will begin to occur as a result of this high demand [3].
Since most physicians only monitor fasting blood glucose (FBG) to detect whether their patients are becoming insulin resistant or Diabetic, they and their patients have no idea that between ½ and 1 hour after beginning a meal, the person’s blood sugar had reached levels well in excess of the normal high peak of 140 mg/dl (7.8 mmol/L). Blood sugar in these individuals often goes as high as 9.0 mmol/L (160 mg/dl ) and even higher but no one knows because no one is checking for it.
A standard fasting blood glucose test won’t pick this up and even if a doctor requisitions a two-hour oral glucose tolerance test (OGTT) where the person is required to fast and then drink a standard amount of glucose and have their blood sugar checked, glucose levels are only measured at baseline when the person is fasting (FBG) and after 2 hours, by which time blood sugar has returned to normal, so this huge peak in blood sugar won’t be seen.
People with these abnormal insulin-glucose responses are at significantly increased risk for developing Type 2 Diabetes and the cardiovascular disease (heart attack and stroke) that often accompanies it, but if no one checks, no one knows.
We can only obtain the right answers if we ask the right question, but often we are asking the wrong questions.
Severe insulin and glucose dysfunction (adapted from Crofts, C., et al., Identifying hyperinsulinaemia in the absence of impaired glucose tolerance: An examination of the Kraft database. Diabetes Res Clin Pract, 2016. 118: p. 50-7.)
By the time people’s insulin and glucose curves look like above in black, ~75% of people will already meet the diagnostic criteria Type 2 Diabetes [2].
When people’s fasting blood sugar and glycated hemoglobin (HbA1C) falls in the normal range, it can’t simply be assumed that “everything’s fine” if these same individuals also have other symptoms that are known to be associated with hyperinsulinemia, including high blood pressure (hypertension), high triglycerides (TG) and/or low HDL cholesterol [4]. If fasting blood glucose and/or HbA1C lab test results comes back within normal range and the person has some of these other symptoms and/or a family history of them, then requisitioning a fasting insulin test along with a fasting blood glucose test will enable some calculations to be done to estimate insulin resistance using the homeostasis model assessment (HOMA-IR) described in previous articles, but assessing hyperinsulinemia is a more involved process as it requires assessing both insulin response and glucose response simultaneously over several hours. The problem is that hyperinsulinemia is mechanistically linked to Metabolic Syndrome (described below), Type 2 Diabetes and as a result, cardiovascular disease (atherosclerosis, thrombosis) and other diseases associated with Metabolic Syndrome. Hyperinsulinemia is also an independent risk factor for specific cancers (including breast and colon/rectum, Alzheimer’s disease and other forms of dementia and non-alcoholic liver disease [3]. Hyperinsulinemia is a silent disease, with no overt symptoms. Clinical tools such as assessing insulin and glucose at the same time in response to a glucose load (called a ‘Kraft Assay’) may be useful to predict those who are at risk. In order to be able to prevent people from receiving this diagnosis, clinicians must ask the right questions.
If a doctor is willing to requisition a 2-hour glucose tolerance test, then something as simple as having blood glucose checked at baseline, 1/2 an hour, 1 hour and 2 hours — and not just at baseline and at 2 hours will “catch” abnormal spikes after a carbohydrate load. While it is not as involved as a Kraft Assay which assesses insulin levels simultaneously with glucose levels over several hours, it can provide some useful information. Such a simple addition is not very expensive and can go a very long way to enabling a person to make dietary and lifestyle changes to reverse hyperinsulinemia and as a result, decrease insulin resistance and avoid a diagnosis of Type 2 Diabetes. Certainly, left on its own, there is a good chance these individuals will be diagnosed even though their blood sugar didn’t reflect the risk far enough in advance.
Someone taking their own blood sugar reading at 1/2 hour and an hour after eating a high carbohydrate meal can provide them with sufficient early warning to look further. I have loaned glucometers to my clients for just this purpose. It doesn’t need to be complicated. We simply need to ask the right questions.
If people already have some form of cardiovascular disease (CVD), essential hypertension (high blood pressure that has no identifiable cause), Polycystic Ovarian Syndrome (PCOS) or non-alcoholic fatty liver disease (NAFLD) we need to consider that insulin resistance and hyperinsulinemia are very often associated [4].
We need to look past the what appears on the surface to be ‘normal’, because we may be overlooking early warning signs because we didn’t ask the right questions.
Perhaps you have questions about whether you may be insulin resistant or have hyperinsulinemia even though your blood sugar is normal or are concerned that your family history puts you at increased risk of developing Type 2 Diabetes and you want to make some simple dietary and lifestyle changes to avoid what seems as “inevitable”. Please send me a note using the Contact Me form on the tab above and I’d be pleased to reply as soon as I can.
I provide services by Distance Consultation (Skype, long distance telephone) as well as in person in my Coquitlam office. Detailed information can be found on the Services tab, as well as in the Shop. You can download the Intake and Service Option Form under the package of your choice if you would like to get started and please let me know if you need more information.
To your good health,
Joy
If you would like to read well-researched, credible ”Science Made Simple” articles on the use of a low carb or ketogenic diet for weight loss, as well as to significantly improve and even reverse the symptoms of Type 2 Diabetes, high cholesterol and other metabolic-related symptoms, please click here.
LEGAL NOTICE: The contents of this blog, including text, images and cited statistics as well as all other material contained here (the ”content”) are for information purposes only. The content is not intended to be a substitute for professional advice, medical diagnosis and/or treatment and is not suitable for self-administration without the knowledge of your physician and regular monitoring by your physician. Do not disregard medical advice and always consult your physician with any questions you may have regarding a medical condition or before implementing anything you have read or heard in our content.
References
Del Prato, S., P. Marchetti, and R.C. Bonadonna, Phasic insulin release and metabolic regulation in type 2 diabetes. Diabetes, 2002. 51 Suppl 1: p. S109-16.
Crofts, C., et al., Identifying hyperinsulinaemia in the absence of impaired glucose tolerance: An examination of the Kraft database. Diabetes Res Clin Pract, 2016. 118: p. 50-7.
Crofts, C., Understanding and Diagnosing Hyperinsulinemia. 2015, AUT University: Auckland, New Zealand. p. 205.
Halban, P.A., et al., β-cell failure in type 2 diabetes: postulated mechanisms and prospects for prevention and treatment. Diabetes Care, 2014. 37(6): p. 1751-8.
Reaven, G., The metabolic syndrome or the insulin resistance syndrome? Different names, different concepts, and different goals. Endocrinol Metab Clin North Am, 2004. 33(2): p. 283-303.
This week Stanford University published a study which substantiates the huge glucose spikes that “healthy” people with normal blood sugar levels experience and that Dr. Joseph Kraft began documenting 45 years ago [2,3,4] — until just before his death in 2017 [5]. To those of us that are familiar with the research of Dr. Kraft, this is a bit like the 1969 Apollo 11 lunar astronauts ‘discovering’ the existence of craters and mountains on the moon that were documented by Galileo in 1609.
Kraft called these abnormal glucose spikes along with the corresponding abnormalspikes of insulin ‘occult diabetes‘ or ‘diabetes in situ‘ [4] and used the term ‘occult diabetes’ to describe it since ‘occult’ in this context means “not accompanied by readily discernible signs or symptoms“. It is these ‘covert’ glucose spikes that Stanford university researchers reported this week.
The Stanford Study
Stanford researchers gave 57 healthy subjects without prior diagnosis of diabetescontinuous glucose monitors (CGM)that recorded their blood sugar fluctuations in their normal environment for two weeks. There were 32 women, 25 men — ranging in age from 25 to 76, with an average age of 51 years [1].
Subject’s Blood Sugar Upon Screening
Upon screening for the study, 5 of the subjects were discovered to have met criteria for having type 2 diabetes, as defined as HbA1c ≥6.5%, fasting blood glucose ≥ 126 mg/dL (7.0 mmol/L), or 2-hour glucose during 75 gram Oral Glucose Tolerance Test (OGTT) ≥ 200 mg/dL (11.1 mmol/L); 14 subjects were found to meet the criteria for prediabetes, defined as HbA1c > 5.7% and < 6.5%, fasting blood glucose 100—125 mg/dL (5.5 mmol/l-6.9 mmol/L) , or 2-hour glucose during OGTT 140—199 mg/dL (7.8-11.0 mmol/L). The remaining 38 subjects had normal blood glucose defined as fasting and 2-hour OGTT plasma glucose and HbA1c below the diagnostic thresholds for prediabetes and diabetes. Average fasting glucose was 93 mg/dL (5.2 mmol/L), 2-hour glucose 125 mg/dL (6.9 mmol/L) and HbA1c 5.4%[1].
Huge Variations in Blood Sugar Response
Researchers found that there was huge inter-individual (between individuals) and intra-individual (in the same individual at different times) variation in blood sugar response — which is exactly what a 2015 Israeli study that fitted 800 people with CGMs reported [6]. In light of only the glucose part of Kraft’s findings as well as the data from the Israeli study with a study population more than 10x the size, the Stanford findings are not ‘new’.
Using mathematical techniques including spectral clustering and dynamic time warping, researchers defined 3 clusters of glucose patterns which were said to capture 73% of the variation [1]. Based on the amount of variability in glucose levels in each cluster, researchers classified the 3 patterns as low, moderate and severe variability.
Some People had lots of Abnormal Glucose “Spikes”
The researchers found that each of the 3 patterns showed a progressive increase in both the severity and magnitude of the blood sugar fluctuations. As well, some subjects mainly stayed in the low variability range, whereas others were mostly in the moderate to severe variability range. These are basically rankings of blood sugar “spike” intensity [7].
Of significance, blood sugar in the individuals that were considered healthy fluctuated a lot more than what is normally picked up by standard ‘finger-prick’ methods of blood sugar testing and these fluctuations come in the form of “spikes’; which are rapid increases in the amount of glucose (sugar) in the blood, especially after eating specific foods — most commonly carbohydrate [7].
Dr. Michael Snyder, professor and chair of genetics at Stanford and senior author of the study said;
“There are lots of folks running around with their glucose levels spiking, and they don’t even know it. The covert spikes are a problem because high blood sugar levels, especially when prolonged can contribute to cardiovascular disease risk and a person’s tendencies to develop insulin resistance, which is a common precursor to diabetes.”
“We saw that some folks who think they’re healthy actually are misregulating glucose—sometimes at the same severity of people with diabetes—and they have no idea [7].”
~ Dr. Michael Snyder
Stanford researchers documented that abnormal glucose responses were more common than they previously thought [7], but these results come as no surprise to those of us familiar with Kraft’s research [2-5] and the findings of the 2015 study from Israel [6].
The Stanford researchers conducted a sub-study in 30 subjects whose prior blood sugar tests indicated that they were “healthy” (i.e. not prediabetic or diabetic). They were fitted with continuous glucose monitors (CGMs) and alternated between 3 breakfasts; (1) a bowl of cornflakes with milk, (2) a peanut butter sandwich and (3) a protein bar.
Significantly, more than half of the “healthy” group had blood sugar spikes at the same high levels as those who were diagnosed as prediabetic or diabetic [1,7].
Dr. Michael Snyder, professor and senior author of the study said;
“We saw that 80% of our participants spiked after eating a bowl of cornflakes and milk. Make of that what you will, but my own personal belief is it’s probably not such a great thing for everyone to be eating[7].”
Ordinary Blood Tests Available to Detect These Abnormal “Spikes”
Different people respond to carbohydrate based foods differently and even the same individual can respond to the same carbohydrate-based food differently — depending on part on the degree of processing it has undergone, or whether it is eaten alone or after eating protein-containing foods (see two articles on the Perils of Food Processing for more information).
As elaborated on in a previous article titled “Are You Pushing Your Pancreas Too Hard, abnormalities in insulin, including insulin resistance and/or hyperinsulinemia begin to occur as much as 20 years before a diagnosis of Type 2 Diabetes [8]; while blood sugar results are still normaland the results of this new Stanford study underscores the need to diagnose these abnormalities by capturing the blood glucose and insulin spikes well in advance of that!
The problem is, if we only monitor people’s fasting blood glucose and glycated hemoglobin (HbA1C) as a screening tool, we can miss that someone’s pancreas is overworking by constantly producing too much insulin.
Even if a standard 2 hour Oral Glucose Tolerance Test (OGTT) is run, if a person’s blood glucose results are normal at fasting and normal at 2 hours (such as was the case in the Stanford study!), we will miss the “spike” that occurs 30 minutes to 1 hour after the glucose is consumedin those with covert glucose spikes. The way to capture those “spikes” is to run a 2 hour Oral Glucose Tolerance Test with simultaneous glucose and insulin and do the two measurements at baseline (fasting), 30 minutes / 1 hour, and at 2 hours. When we detect these “spikes”, we can implement dietary changes to avoid further β-cell damage or β-cell death whose end-result is type 2 diabetes.
The Cost of Documenting These “Spikes” – penny wise and pound foolish
For less than $130 (cost in British Columbia, Canada), a physician can order a 2-hour OGTT with both glucose and insulin measured at (a) fasting, (b) 1 hour and (2) 2 hours which will capture abnormal glucose spikes at 1 hour, as well as the underlying hyperinsulinemia.
When there are clinical reasons to suspect that a person may be insulin resistant and/or hyperinsulinemic, a blood test that assesses simultaneous glucose and insulin response to a glucose challenge can provide sufficient motivation for individuals to implement dietary changes that can prevent progression to Type 2 Diabetes.
is such a test that costs <$130 to the public healthcare system not good value when the cost per person per year of having Type 2 Diabetes in Canada ranges from $1611 to $3427 ( more about that here)?
In British Columbia, the cost of a standard 2 hour Oral Glucose Tolerance Test is $11.82 before tax and $13.36 with HST.
Each additional glucose assessment is $3.48 before tax and $3.93 after tax.
Each insulin assessment costs $32.82 before tax and $37.09 after tax, so a 2 hour Oral Glucose Tolerance Test with additional glucose assessor at 1 hour and 3 insulin assessors at fasting, 1 hour and 2 hour costs as follows;
2 hour Oral Glucose Tolerance (fasting, 2 hours) = $ 13.36 with GST
additional glucose at 1 hour = $ 3.93 with GST
3 insulin assessors at fasting, 1 hour, 2 hours = $111.27 with GST
TOTAL = $128.56 with GST
The reason often given by physicians for NOT requisition the above tests is that it is “saving healthcare system dollars”, but in those with clear risk indicators, how is it wise to ignore what can’t be detected with standard screening tests?
More Info?
If you would like more information about determining how you respond to carbohydrate containing foods and whether you are at risk for prediabetes type 2 diabetes especially if your blood sugar values appear normal on standard screening tests, I can help.
You can learn more about my services under the Services tab or in the Shop.
If you have questions, please feel free to send me a note using the Contact Me form above and I will reply as soon as I can.
LEGAL NOTICE: The contents of this blog, including text, images and cited statistics as well as all other material contained here (the ”content”) are for information purposes only. The content is not intended to be a substitute for professional advice, medical diagnosis and/or treatment and is not suitable for self-administration without the knowledge of your physician and regular monitoring by your physician. Do not disregard medical advice and always consult your physician with any questions you may have regarding a medical condition or before implementing anything you have read or heard in our content.
Kraft JR, Glucose Insulin Tolerance. A routine Clinical Laboratory Tool Enhancing Diabetes Detection. In O.B. Hunter. Jr. (ed): Radio assay: Clinical Concepts. Skokie, IL. Professional Education Dept. G.D. Searie & Co., 1974. Pp 91-106.
Kraft JR, The Glucose Tolerance Examination: An Obsolete Procedure. read at the Symposium on Radioimmunioassay in Diagnostic Medicine.” Annual Convention, American Medical Association, Chicago, IL. June 26, 1974
Kraft JR, Detection of Diabetes Mellitus In Situ (Occult Diabetes), Laboratory Medicine, Volume 6, Issue 2, 1 February 1975, Pages 10—22, https://doi.org/10.1093/labmed/6.2.10
Crofts C, Schofield G, Zinn C, Wheldon M, Kraft J., Identifying hyperinsulinaemia in the absence of impaired glucose tolerance: An examination of the Kraft database. Diabetes Res Clin Pract, 2016. 118: p. 50-7.
Zeevi D, Korem T, Zmora N, et al. Personalized Nutrition by Prediction of Glycemic Responses. Cell. 2015 Nov 19;163(5):1079-1094.
A June 2018 article written by Sacha Uelmen, RDN, CDE, Director of Nutrition at the American Diabetes Association (ADA) sheds much light on the expanded role for low carb diets in the treatment and management of Type 2 Diabetes [1].
In answering the question “should people with Diabetes cut back on carbs?”, Uelmen says;
“It’s true that foods high in carbohydrate have the biggest impact on blood glucose compared with foods high in protein and fat. Carbohydrates break down into glucose after they are digested, so it makes sense to think that cutting carbs would lead to lower blood glucose levels and better diabetes management. “
Without going into the fact that our body can make glucose from fat and protein, Uelmen says that while our brain needs glucose “there’s a lot of debate around what is the ideal mix of carbohydrate, protein, and fat needed by people with Diabetes” and adds “we don’t have any evidence that one specific proportion will be right for everyone.”
I am in complete agreement.
Uelmen makes the same point that I did in part 3 of my 4-part series titled Some Carbs Are Better Than Others that “what kind of carb is just as important as how much”. This is something that I explain in detail to each one of my clients when I am teaching them their Meal Plan. I agree with her when she says that “some carbs are better for you than others”.
Uelmen explains,
”Refined” carbs refer to foods made with white flour and sugar, such as pretzels, cookies, cakes, and white breads. These foods raise your blood glucose levels quickly, and do not provide much nutritional value. On the other hand, carbs found in vegetables, beans, lentils, fruit, and whole grains break down slower and are packed with fiber, vitamins, and minerals that provide many health benefits.
Unfortunately, what she didn’t explain was the role of food processing in how foods such as legumes (beans and lentils) and grains will raise blood sugar. As I covered in part 1 of my article on The Perils of Food Processing, there are a number of factors other than how many grams of carbohydrate are in a food that will affect how much a food will raise blood sugar. These factors include the amount and types of food processing, including simple grinding, pressing or pureeing, as well as how the food is cooked and for how long. From that article;
Mechanical processing of a food doesn’t change the amount of carbohydrate that is in it. That is, when we compare 60g of whole apple with 60 g of pureed apple or 60g of juiced apple, there is the same amount of carbohydrate each. When we compare the Glycemic Index of these three, the results are very similar so this isn’t very helpful to tell us about the blood glucose response to actually eating these different foods. When these foods are eaten, the blood glucose response 90 minutes later is significantly different.
In the ADA article, Uelmen explains that legumes and whole grains “break down slower” than “refined carbs” such as those made with white flour, but fails to mention that ground beans and lentils or grains will result in a much higher release of glucose and much quicker than legumes or grains that are whole and intact. As well, how they are cooked and for how long will also affect how quickly they release blood sugar. You can read more about that in this article. In short this means that hummus will not have the same effect on blood sugar as the same amount of whole chickpeas. As well, what most people consider “whole grain bread” (i.e. whole wheat bread) has the same Glycemic Index (GI) and Glycemic Load (GL) as white bread. That is, they will both raise blood sugar just as quickly.
“Whole wheat bread” is what most people think of when they hear “whole grain bread” and whole wheat bread has a Glycemic Index of 74 ± 2 and white bread isn’t much worse at 75 ± 2. Compare these to the GI of whole grain rye bread which is 53 [2]. One slice of white bread has a Glycemic Load of 10 and so does one slice of whole wheat bread, but the GL of a real whole grain rye bread is much lower at 7 [2]. Breads made with the whole intact grain or grain that is only coarsely cracked, such as German-style pumpernickel are very different than the “whole grain” bread available in most supermarkets and affect blood sugar much less.
Uelmen makes another point which is correct, but also neglects to mention information that is important. She says;
“The timing and amount of carbs you eat are also important. Eating a lot of carbs in one meal, even if they are high quality carbs, can cause a spike in your blood sugar.”
This is true and I agree with her recommendation;
“Try to spread them [the amount of carbs] across your meals and snacks throughout the day based on your personal carb goal”.
…but there are two things that she fails to mention.
The first omission is that when carb-based foods are eaten at a mixed meal along with fat, they will raise blood sugar significantly more than at meals where carb-based foods are eaten without fat. This is due to the combined effect of carbs and fat on the incretin hormone GIP, from the K-cells. As well, carbohydrate-based foods will spike blood sugar much less if they are eaten at the end of the meal, after protein and fat foods. Secondly, Uelman omits to mention that eating snacks (which are really just smaller meals) frequently results in an overall greater amount of insulin being released than if one eats larger meals less often. When one is trying to lower insulin resistance, eating snacks between meals makes things worse than eating the same amount of food over three (or two) meals. You can read more about both of these in part 2 of The Perils of Food Processing.
Uelmen makes other excellent points;
“Remember, there are many other factors that can affect your blood glucose. Things like changes in activity or sleep, timing and dose of diabetes medicine, and stress can all have an impact on your blood glucose. It’s not always just about food!”
She offers this terrific advice;
“When deciding how much carb is best for you, start by looking at what you are eating on a regular basis. How many grams of carbohydrate are you eating in each of your meals and snacks?”
If people are normally eating 200-300 g of carbohydrate per day, starting a “low carb diet” at 130 g per day will provide significantly better blood sugar control, if the carbs that are selected have a minimum of food processing (grinding) and cooking. Then, carbohydrate amount can be lowered as needed to help achieve clinical and metabolic outcomes.
Uelmen advises;
“If you are considering a low carb eating pattern, be sure to think about how much time you are willing to devote to meal planning. Strict low carb eating patterns, such as the ketogenic (keto) diet, require careful planning and regular visits to your doctor to ensure you are getting all of the vitamins and minerals you need to stay healthy.”
I’m not sure where she arrived at the idea that eating low carb requires people to devote more time to meal planning. When meals center around a protein food and low-carb veggies — with a few nuts or seeds or cheese thrown in, they are super easy and fast to cook.
I agree with Uelmen that for people following a “strict low carb eating pattern, such as the ketogenic (keto) diet” require regular visits to their doctor, but not for the reasons she lists. Yes, a doctor can run tests to check for vitamin or mineral deficiency, however when a Meal Plan is done by a Dietitian that knows how to design a well-formulated ketogenic diet, it takes into consideration adequate intake of vitamins and minerals. Low nutrient intake is likely going to be less of an issue than when the person was eating a Standard American Diet. That said, people following a low carb or ketogenic diet do require regular visits to their doctor IF they are taking any medications that lower blood glucose or blood pressure. Please read this article if you fall in this category.
Uelman says;
“What can we all agree on when it comes to carbohydrates? Whether you follow a Mediterranean, vegan, keto, low carb, or any other eating pattern, one thing is for sure: Eat plenty of colorful non-starchy vegetables. They are full of vitamins, minerals, dietary fiber, and antioxidants to name just a few.”
…and this is excellent advice!
She concludes her article with two excellent suggestions that I long to hear reflected by Diabetes Canada in the days ahead. The first one is;
“How many carbohydrates should you eat each day? Well, that choice is yours. With careful review of your blood glucose trends and your usual eating patterns, you can often find the right balance that meets your daily nutrition needs and health goals as well as satisfying your appetite. Remember, the best meal plan for YOU is the one that you can stick with while meeting your health goals and feeling good!“
Her second recommendation is that if people need more help following a low carb or ketogenic diet that they should find a Registered Dietitian with RD or RDN credentials to help them.
Final thoughts…
At present, Diabetes Canada 2018 Clinical Practice Guidelines continue to recommend that those with Diabetes still eat ~half or more (45% to 65%) of their daily calories as carbohydrate and limit dietary fat regardless of its source to 20% to 35% of daily calories.
Why is this?
Both Americans and Canadians based their dietary recommendation on the exact same Dietary Reference Intakes (DRIs) yet the American Diabetes Association does not hold rigidly to the Acceptable Macronutrient Distribution Ranges (AMDRs) for macronutrients as a percentage of total energy for Diabetics; which are 45% to 65% of energy as carbohydrate, 10% to 35% of energy as protein and 20% to 35% of energy as fat.
What I don’t understand is why Diabetes Canada continues to recommend that Diabetics keep following the same macronutrient distribution (percent of carbs, protein and fat) as the general population when the American Diabetes Association now supports both low carb and ketogenic (keto) diets for Diabetics?
Both Diabetes Canada and the ADA freely admit that carbohydrate-containing foods have the biggest impact on blood glucose compared with foods high in protein and fat, so why are American Diabetics supported in their desire to follow a ketogenic diet, but not Canadian Diabetics?
Or is it just that the Canadian recommendations haven’t yet caught up with the American recommendations?
If you have questions as to how I can help support your preference to follow a low carb lifestyle, please send me a note using the “Contact Me” form on this web page and I’ll reply as soon as possible.
LEGAL NOTICE: The contents of this blog, including text, images and cited statistics as well as all other material contained here (the ”content”) are for information purposes only. The content is not intended to be a substitute for professional advice, medical diagnosis and/or treatment and is not suitable for self-administration without the knowledge of your physician and regular monitoring by your physician. Do not disregard medical advice and always consult your physician with any questions you may have regarding a medical condition or before implementing anything you have read or heard in our content.
A new study published this week in the American Journal of Clinical Nutrition reports that long-term consumption of the saturated fat found in full-fat dairy products is not associated with an increased risk of cardiovascular disease (atherosclerosis, coronary artery disease, etc.) or other causes of death, and may actually be protective against heart attack and stroke[1].
The study which took place over almost a quarter of a century measured three specific fatty acids found in dairy products in 2,900 older adults, aged 65 years and above— first in 1992, again in 1998 and finally in 2015. The three fatty acids they measured were pentadecanoic, heptadecanoic, and palmitoleic acids.
During the 22 year period, 2,428 of the participants died of which 833 were due to heart disease. When the data was analyzed, none of the three fats was associated with the risk of total mortality (death) or heart disease — in fact, high levels of heptadecanoic acid was associated with a lower risk of death from heart disease and stroke.
This is significant because while higher amounts of saturated-fat consumption, including the saturated fats in this study increase blood LDL cholesterol, they also increase HDL cholesterol and decrease triglycerides[2], both of which are protective. Since it was unknown what the ‘net effect’ on total mortality (death) and cause-specific death, this study was done to determine what effect, if any increased dairy fats had on these outcomes.
The results were clear.
Not only did long-term consumption of these three dairy fats have no effect on either total death or heart disease, high levels of one of the fats found in full-fat dairy was actually found to be associated with a lower risk of heart disease and stroke!
The authors of the study conclude;
“For decades dairy fat consumption has been hypothesized to be a risk factor for CVD, as well as potentially diabetes, weight gain, and cancer, little empirical evidence for these effects existed from studies of clinical events. In current years, a growing number of prospective studies have shown generally neutral or protective associations between self-reported dairy foods and dairy fat consumption with the risk of CVD, diabetes, weight gain and cancers, raising questions about this conventional wisdom.”
The results of this long-term study with almost 3,000 older adults demonstrates that the saturated fat found in full-fat dairy is not associated with cardiovascular disease (CVD), diabetes or cancer and may even be protective against both heart attack and stroke.
Final Thoughts…
With both the American and Canadian Dietary Guidelines currently being revised— and “front of label labeling” in Canada to advise against foods high in saturated fat, it is time for both the US Office of Disease Prevention as well as Health Canada to review their respective recommendations with regards to consumption of low-fat dairy, in light of current research.
Dairy protects play an important role in health and nutrition and are rich sources of calcium, potassium, and phosphorus and are a ready supply protein and essential fat not only to growing children, but to older adults who risk osteoporosis and sarcopenia (muscle wasting). Given the results of this study on the saturated fat in dairy, as well as the results of a recent 158-country study which found that total fat and animal fat consumption were least associated with the risk of cardiovascular disease, it is time to re-evaluate the long-held belief that animal fat (whether in meat or dairy), is somehow ‘dangerous’.
A Few Words “Fat Phobia”
I regularly come across people in my practice who grew up in the last 40 years and who have spent their entire lives avoiding any form of animal fat. The very idea of eating the yolk in egg is a source of anxiety — and it need not be so.
I am not suggesting that these folks suddenly start eating copious amounts eggs, meat, cheese, cream and butter but often suggest they start with things such as avocado, olives, nuts and seeds that are rich in monounsaturated fats that have been less villainized than saturated fat. I encourage them to use a little cream on top of fresh berries or use a bit of butter to cook with. In time, I may show them delightful egg recipes that have other foods they are used to eating and enjoy, such as a spinach-ricotta pie, which makes a lovely summer-time dinner when it’s too hot too cook.
Overcoming “fat phobia” takes time — especially when it has been ingrained in you since you’re young. I understand. When we work together, you set the pace.
People are sometimes concerned than they can’t follow a low-carbohydrate lifestyle because they “can’t eat all that fat”, but the truth is, not all low-carb diets have large amounts of fat. It’s only because fat has 2 1/2 times the calories as protein and carbs that some types of low-carb diet are still considered “high fat”. There is a whole range of low-carb diets which you can read about here as well as different types of ketogenic (“keto”) diets that you can read about here.
Have questions about which type of low carbohydrate diet may be best for you? Or perhaps you have questions about my services and their costs. Maybe you’d just like to meet me for a one-hour consultation (in-person or via Skype) to ask questions and see if this may be an option for you. Please send me a note using the “Contact Me” form on this web page and I’ll be glad to reply as soon as I’m able.
LEGAL NOTICE: The contents of this blog, including text, images and cited statistics as well as all other material contained here (the ”content”) are for information purposes only. The content is not intended to be a substitute for professional advice, medical diagnosis and/or treatment and is not suitable for self-administration without the knowledge of your physician and regular monitoring by your physician. Do not disregard medical advice and always consult your physician with any questions you may have regarding a medical condition or before implementing anything you have read or heard in our content.
References
Otto MC , Lemaitre, RN, Song, X et al; Serial measures of circulating biomarkers of dairy fat and total and cause-specific mortality in older adults: the Cardiovascular Health Study,The American Journal of Clinical Nutrition, https://doi.org/10.1093/ajcn/nqy117
Mensink RP, Zock PL, Kester AD, Katan MB. Effects of dietary fatty acids and carbohydrates on the ratio of serum total to HDL cholesterol and on serum lipids and apolipoproteins: a meta-analysis of 60 controlled trials. Am J Clin Nutr 2003;77(5):1146—55
It has been my conviction for some time that the “perfect storm” which underlies the current obesity epidemic was the marketing of novel food products that were a combination of refined carbohydrates and manufactured vegetable oils and today I came across evidence that the food industry has known for some time that this specific combination results in significant weight gain. The proof wasn’t in a remote journal article, but in a product that was deliberately designed from refined carbohydrates and manufactured vegetable oils and marketed for the specific purpose of causing weight gain. Yes, you read that correctly.
Just 5 years after the first manufactured vegetable oil product, Crisco® was created in 1911 — the brainchild of soap manufacturer Proctor and Gamble, a product called Wate On® was created by Dendron Distributors [1] of Chicago, Illinois in 1916 and promoted to doctors and the general public to promote weight gain through its “proven weight building elements”.
Wate On® boasted in magazine and newspaper ads that it was “loaded with concentrated calories so prepared to be far easier to be used by the system in building wonderful body weight“.
So what was its specially prepared formula?
It was the combination of vegetable oil and refined carbohydrates with added vitamins and minerals together in one easy-to-take product.
Early advertisement for Wait-On
Here are the words of the ad, above;
“if you are skinny, thin and underweight, mail this coupon for the latest discovery of modern medical science. It’s called WATE ON and anyone in normal health may quickly gain 2, 4 as much as 5 lbs. in a week…then 10 pounds, 20 pounds and more so fast, it’s amazing! Not a medicine, not intended to cure anything. Instead WATE ON is a new different formula that’s pleasant to take as directed and is loaded with concentrated calories so prepared to be far easier to be used by the system in building wonderful body weight. Cheeks fill out, neck and bust-line gain, arms, legs, thighs, ankles, skinny underweight figures fill out all over the body.”
Wate-On®’s formulation was no secrete and was published in their advertisements.
Actress June Wilkinson, in an ad from the early 1960s in referring to the two formulations, WATE-ON® and SUPER WATE-ON® writes”both forms of WATE-ON are super-concentrated with weight-building calories, vitamins, minerals, quick energy elements”. In other parts of the same ad, it lists that the product is “saturated with calories from maize oil” and that SUPER WATE-ON has “extra calories from energy-giving sucrose and easy-to-digest vegetable oils“.
Wate-On ad featuring June Wilkinson, early 1960s
The obesity crisis should have come as no surprise.
In the 1940s, 50s and 60s, manufactured vegetable oils combined with sucrose (the refined carbohydrate of table sugar) were sold and promoted for weight gain.
Then, in the early 1950’s, Ancel Keys proposed his diet-heart hypothesis (the belief that eating foods high in saturated fat contributed to heart disease) which was followed by publication of his Six Country Study in 1953 where he claimed to have demonstrated that there was an association between dietary fat as a percentage of daily calories and death from degenerative heart disease. Despite the fact that 4 years later (1957) Yerushalamy et al published a paper with data from 22 countries which showed a much weaker relationship between dietary fat and death by coronary heart disease than was suggested by Keys’s Six Countries Study data, the link between saturated fat and heart disease endured (see this earlier article for more details and references.)
In August of 1967, Stare, Hegsted and McGandy — the 3 Harvard researchers paid by the sugar industry published their review inthe New England Journal of Medicine — which vindicated sugar as a contributor of heart disease and laid the blame on dietary fat and in particular, saturated fat and dietary cholesterol.
This vilification of saturated fat laid the foundation for the food industry to promote their novel vegetable fats to the general consumer as a ‘healthy’ alternative to ostensibly ‘unhealthy’ saturated fats.
…and promote them they did!
In the late 1980s, the food industry marketed their manufactured vegetable fats to an unsuspecting public by providing “teaching resources” to future Dietitians to promote their products as “healthy oils”. I know. I was one of them (more in this article). Then came the proliferation of manufactured “convenience foods” and “fast foods” — sold as products to make life easier, but which made us fatter instead. These products were (and are) the very combination of manufactured vegetable oil and refined carbohydrates of which weight-gain products of years-gone-by were made from!
Can the food industry claim — like the tobacco industry before them that they didn’t know fast food and convenience food would result in ill health, stemming from overweight and obesity? I don’t think so.
The food industry knew that the combination of manufactured vegetable oil and refined carbohydrates would lead to weight gain because before they were sold together as ‘convenience food’ and ‘fast food’, they were sold together in products deliberately designed to promote weight gain.
I remember when when the tobacco industry was challenged and how very long it took before a final verdict was reached and marketing and selling of disease-causing tobacco products to the public was legislated. How long will it take for foods containing a combination of manufactured vegetable oil and refined carbohydrates that we KNOW cause weight gain, to be likewise legislated?
How many more millions of people will die from food-related death or live poor quality-of-life due to obesity and obesity-related metabolic disease before the food industry is challenged?
Final Thoughts…
Having read this article, I would encourage you to begin reading labels of the foods you buy — and see how many of them have this combination of manufactured vegetable oil and refined carbohydrates. Start with ones in your pantry or fridge, then begin to read labels before you purchase them.
The manufactured vegetable oils to look for are mainly soybean oil, canola oil and corn oil [also called maize oil in imported products] and the refined carbohydrates can be anything from white flour to various types of sugar (sucrose, glucose, other words ending in —ose).
Then, look for healthful alternatives available in the marketplace. Monounsaturated fats such as olive oil and avocado oil are great alternatives and many of the products that have added sugars and vegetable oils really don’t need them, such as salad dressing or peanut butter!
Finding healthy products rarely requires shopping at a “health food store”, but simply shopping wiser at an ordinary supermarket — and realizing the the products you and others buy are the ones that stores will restock. If your store doesn’t have a healthy alternative to a product, then ask to speak to the department manager to request that they stock some.
When you have some time, ask for the ingredient list to the products you buy at your local fast food restaurant or coffee house — or go online and find them. By law (in both Canada and the US), food service companies are required to make these available. Ask. Read them. Look for they types of fats that are used and the types of refined carbohydrates.
Then, make food purchases for yourself and your family based on what you know and what you learned in this article about products that contain a combination of manufactured vegetable fats and refined carbohydrates.
If you need help to make healthier food choices, I can help.
Please send me a note using the Contact Me form located on the tab above and I will reply soon.
LEGAL NOTICE: The contents of this blog, including text, images and cited statistics as well as all other material contained here (the ”content”) are for information purposes only. The content is not intended to be a substitute for professional advice, medical diagnosis and/or treatment and is not suitable for self-administration without the knowledge of your physician and regular monitoring by your physician. Do not disregard medical advice and always consult your physician with any questions you may have regarding a medical condition or before implementing anything you have read or heard in our content.
In previous articles in this series on Some Carbs are Better than Others, I’ve covered both Glycemic Index (GI) and Glycemic Load (GL) which are useful measures of how easily carbohydrate-based foods raise the blood sugar of healthy people. For those that are insulin resistant or have Type 2 Diabetes, Insulin Index is much more useful because it indicates how much insulin is required for a specific food. Insulin is the hormone that tells our body to store excess energy as glycogen or fat, and that is also responsible for lowering blood sugar.
Unlike GI and GL, the Insulin Index is not limited to carbohydrate-based foods because protein-based foods (have no carbohydrate in them) still cause an insulin response. Some foods that have a low GI or GL result in a lot of insulin being released — and knowing this is important to those who are insulin resistant or have already been diagnosed with Type 2 Diabetes and are working at lowering their fasting insulin levels.
As presented in Part 3 of this series Some Carbs are Better than Other (for Diabetics), I demonstrated how 25 g of carbs made from highly processed flour and sugar produced a very different glucose response a Type 2 Diabetic (me!) than 25 g of carbs of an unrefined (intact) food — even though at the time I did this ‘experiment’, I had been eating very low carb for over a year.
Why the difference when both had 25 g of carbs?
The 25 g of carbs as a cracker with chocolate was a combination of highly refined white flour and fat (chocolate) which raises blood glucose to a much higher degree than a food that contains carbohydrates alone (see The Perils of Food Processing, Part 2) . The 25g of carbs as intact chickpeas that were cooked from soaked, dry ones were fully intact — as they were prepared with the minimum necessary cooking. As covered in Part 1 of the series on The Perils of Food Processing, highly refined and carb-based processed foods cause a much higher and more immediate glucose response due to the incretin hormone GIP, than foods with the same number of carbs that has its plant structure intact (i.e. the chickpeas). This explains WHY I had three times the glucose response with the cracker, as I did with the chickpeas — even though both foods had the same amount (25 g) of carbohydrate in them.
What about Insulin Response in response to these two foods?
The 25 g of carbs as a cracker with chocolate would have resulted in a huge stimulation of the gut (incretin) hormone GIP in the upper intestine and resulted in a pronounced release of insulin. The 25 g of carbs as cooked chickpeas would not have resulted in a huge stimulation of GIP because they were intact and as a result, the starch in them was not readily available to the enzyme that digests it (α-amylase). In fact, some of the carbohydrate in the chickpeas would have passed through the gut undigested.
The insulin response of these two foods (each with 25 g of carbohydrate) would have been very different.
What is the Insulin Index?
Shortly after I was diagnosed as having Type 2 Diabetes in 2007, I came across a research paper from 1997 called “An insulin index of foods: the insulin demand generated by 1000-kJ portions of common foods”. In this paper, the Insulin Score of a food was determined by feeding individual foods that contained exactly 239 calories (kcals) / 1000 kilojoules each to non-diabetic subjects and then measuring their insulin response over three hours. The results from each food were then compared to the insulin response of pure glucose, which was assigned an arbitrary value of 100%. The Insulin Index ranks each individual food compared to the insulin response of pure glucose.
Below is a graph from that paper:
Holt S, Brand-Miller J & Petocz P (1997). An insulin index of foods
At the time, the graph was quite puzzling to me as eggs, cheese, fish and beef —which have no carbohydrate in them at all, still caused insulin to be released. It would take close to 10 years for me to better understand this.
As far as I could see, there were two major limitations to the Insulin Index; the first was that there were only 38 foods evaluated. One really can’t make any inferences based on only 38 foods! The second limitation was that it measured the insulin response in healthy, non-diabetic people.
Last year, I had heard that a PhD researcher from the University of Sydney , under the oversight of Prof. Jennie Brand Miller (who had worked on the original study in 1997) had conducted a research project on the clinical application of the Insulin Index to Diabetes (Type 1). In addition to her thesis, she had also created a database of the Insulin Index of a large number of foods.
This was huge!
As it turned out, some foods that were high in protein and low in fat (such as lean steak or fish) resulted in a large insulin release and foods such as navy beans or All Bran® cereal resulted in a relatively low insulin response. As it turns out, it’s not only the amount of carbohydrate in a food that influences insulin release, but also protein and fiber.
What is especially helpful about the Insulin Index and the database of Insulin Scores is that it enables those with Type 1 or insulin-dependent Type 2 Diabetes to more accurately estimate their injected insulin needs.
However, for those with insulin-dependent Type 2 Diabetes, there is another option.
Results from recent research studies such as the one-year data from the Virta study have been published and demonstrate that reversal of Type 2 Diabetes symptoms is possible — even for those injecting themselves with insulin!
At the beginning of the study, 87% of participants were taking at least one medication for Diabetes but after only 10 weeks of following a well-formulated ketogenic diet, almost 57% had one or more Diabetes medications reduced or eliminated. At the end of a year, sulfonylurea medication was entirely eliminated. Insulin therapy was reduced or eliminated in 94% of of those following the well-formulated ketogenic diet at a year.
For those taking any of the types of medication listed below, following a well-designed ketogenic diet requires one’s doctor’s oversight. As I wrote about in a previous article, medical supervision is absolutely required before a person changes the amount of their carbohydrate intake if they have been prescribed any of the following medications;
(1) insulin
(2) medication to lower blood glucose such as sodium glucose co-transporter 2 (SGLT2) medication including Invokana, Forxiga, Xigduo, Jardiance, etc. and other types of glucose lowering medication such as Victoza, etc.
(3) medication for blood pressure such as Ramipril, Lasix (furosemide), Lisinopril / ACE inhibitors, Atenolol / βâ‚ receptor antagonists
(4) mental health medication such as antidepressants, medication for anxiety disorder, and mood stabilizers for bipolar disorder and schizophrenia.
I don’t provide low carbohydrate / ketogenic dietary services those taking insulin (either Type 1 Diabetes or Type 2 Diabetes), I encourage those that are taking it to consult with their endocrinologist and work with a knowledgeable healthcare professional with CDE certification.
As I said previously, people taking any of these medications should not adjust the dosage of their medication without first consulting with their doctor and being instructed by them to do so. The consequences can be very serious, even life-threatening. For example, people taking SGLT2 inhibitors such as Invokana or Jardiance and who decrease insulin dosage suddenly are at increased risk for a life-threatening condition called ”Diabetic ketoacidosis (DKA)”. Medication dosages and timing must be adjusted by a doctor.
If you are not taking insulin — or have been stable for a period of time after having had insulin withdrawn by your doctor, I’d be happy to work with you to coordinate dietary and lifestyle changes with you and your doctor, as they monitor your health and adjust the levels of prescribed medications. In complex cases, I will ask for written consent to coordinate care with your doctor depending on medications you are prescribed, as your doctor will need to know in advance what level of carbohydrates you have been advised to eat, so that they can monitor your health and make adjustments in your medication dosage.
If you have questions as to how I can help you or how I’d work with you and your doctor as they oversee you adopting a low carb lifestyle please feel free to drop me a note using the Contact Me form on the tab above.
To your good health!
Joy
If you would like to read well-researched, credible ”Science Made Simple” articles on the use of a low carb or ketogenic diet for weight loss, as well as to significantly improve and even reverse the symptoms of Type 2 Diabetes, high cholesterol and other metabolic-related symptoms, please click here.
Holt S, Brand-Miller J & Petocz P (1997). An insulin index of foods: the insulin demand generated by 1000-kJ portions of common foods. Am J Clin Nutr 66, 1264-1276. The American journal of clinical nutrition. 66. 1264-76.
Bell K, University of Sydney, School of Molecular and Microbial Bioscience, Clinical Application of the Food Insulin Index to Diabetes Mellitus, May 14, 2014. https://ses.library.usyd.edu.au/handle/2123/11945
LEGAL NOTICE: The contents of this blog, including text, images and cited statistics as well as all other material contained here (the ”content”) are for information purposes only. The content is not intended to be a substitute for professional advice, medical diagnosis and/or treatment and is not suitable for self-administration without the knowledge of your physician and regular monitoring by your physician. Do not disregard medical advice and always consult your physician with any questions you may have regarding a medical condition or before implementing anything you have read or heard in our content.
This article on the Perils of Food Processing is based on a lecture given by Gabor Erdosi, MSc, MBA— Food News Conference, May 19, 2018 — Prague, Czech Republic.
INTRODUCTION: In the first part of this article on the Perils of Food Processing, we considered the effect of different types of simple food processing such as grinding and cooking on the hormonal response of the incretin hormones to carbohydrate intake. While interesting, we rarely eat meals that are only made up carbohydrate, without any fat or protein. Even if we eat a slice of bread or toast and put peanut butter on top, it is now mixture of carbohydrate, fat and protein. How does a mixed meal” with fat and protein affect the body’s hormonal response to carbohydrate? How does the presence of fiber impact this hormonal response? Does it matter how often we eat, or how fast? This and more are covered in this article.
Response of Incretin Hormones to Meal with Fat and Carbohydrate
In the first study we’re going to look at, the researchers designed a sandwich that produced a very stable glucose response in healthy individuals. The sandwich was made of 120 g of white bread, 20 g of butter and 10 g of dried meat. As can be seen from curve A, blood sugar rose to ~150 mg/dl (~8.3 mmol/L) and stayed relatively stable for the next 3 hours (180 minutes).
But what happened to the insulin response when these foods were eaten separately and together in a sandwich?
Effect of fat and protein on incretin effect of a mixed meal – – Gabor Erdosi – Food News 2018
Looking at curve B (bottom), it can be seen when subjects ate only the dried meat, blood insulin levels didn’t rise much at first, but then rose a little bit at ~ 90 minutes and stayed relatively constant. When subjects ate only the butter, insulin levels rose a little bit more and then only increased slightly over the next several hours. But when they ate the sandwich with the white bread, butter and dried meat, you can see that blood insulin levels rose quite steeply, beginning before 30 minutes, reaching a maximum level at 60 minutes, and then decreased very slowly over the next several hours. This makes sense, because of the presence of the carbohydrate in the bread.
What is interesting is what happens to the two gut hormones, GIP (from the K-cells) and GLP-1 (from the L-cells) in response to eating these foods.
Contribution of fat and protein to the incretin effect of a mixed meal – – Gabor Erdosi – Food News 2018
Looking at the second curve (graph on the right) it can be seen that in response to the mixed meal’ of the sandwich, GIP from the K-cells (high up in the intestine) is released rapidly and in large amounts. That is, a mixed meal results in a large stimulation of both insulin and glucagon release. Insulin moves the glucose into the cell for storage at the level of the fat cells increases lipoprotein lipase, which increases triglyceride storage. This is an anabolic process of storing nutrients for use later.
As can be seen from the first curve, when a mixed meal’ is eaten, GLP-1 is released from the L-cells lower down in the intestine responded but is much less pronounced. That is, in response to GLP-1 secretion, insulin is released to a small extent, but there is little of the signalling to decrease glucagon, which means little effect on the hunger signal and little satiety (feeling full).
Incretin Response to a Standard Western Diet Meal versus a Paleo-style Meal
In this next study, we can see the same effect in a plant-based meal, using a reference meal and a paleolithic style meal (called PAL2) that both had the same number of calories (~1600 kcals) and very similar macronutrient distributions (carbohydrate, fat, protein). The only difference between the reference diet and the Paleolithic type diet is the amount of processing.
Plant-rich Paleo-type Meal versus Standard Western-type Meal – – Gabor Erdosi – Food News 2018
The reference meal was made up of cooked, long grain rice, mango and boiled carrots, some fish cooked over dry heat and some olive oil.
The paleo type meal was made up of raw strawberries, raw apple, as well as the same significantly more fish cooked over dry heat, raw mushrooms, seedless raisins, zucchini (courgettes), flax seed, cinnamon and capers. While both of these meals had the same number of calories, as can be seen, there was a significant difference in the weight between these two meals — with the reference meal weighing only 248 g, uncooked and the paleo type meal weighing 718 g.
In each of these two types of meals, the response of the two gut incretin hormones, GIP from the upper intestine K-cells and GLP-1 from the lower intestinal L-cells were very different!
Looking at the bottom of the 3 graphs, it can be seen that GIP from the K-cells (high up in the intestine) was released rapidly and in large amounts in the reference meal — a meal that is quite similar to the Standard Western Diet. Recall that the GIP from the K-cells acts on the pancreas to trigger both insulin release from the beta-cells and to trigger glucagon release from the alpha cells. The insulin results in the body storing glucose from the meal and the glucagon release signals the body to release stored glucose, if the blood sugar falls too low. The rise of GIP in response to the paleo-type meal was very slow and gradual and didn’t rise very high, which means that much less insulin was triggered to be released from the pancreas’ beta-cells and much less glucogon was triggered to be released from the alpha-cells.
What happened to GLP-1 release from the L-cells in the lower intestine in response to these two different types of meals?
The Western-type meal (the reference meal) caused a very short rise in GLP-1 from the lower L-cells, which decreased back to baseline quickly. That means that very little additional insulin was released to move additional glucose into the cells and significantly, there was very little decrease of glucagon which means that appetite was not decreased and there was little to no stimulus to increase satiety (feeling full) and little to no signal to decrease food intake.
The paleo-type meal resulted in significant release of GLP-1, which caused the pancreas to release insulin from the beta-cells and also decreases glucagon release from the alpha-cells of the pancreas — which at the level of the brain, acts to decrease appetite and increase satiety.
This is key; based on this study, a meal based on a Standard Western Diet did not trigger the signal that the body had taken in sufficient food and that appetite could now decrease.
The Effect of Food Texture even Greater than the Effect of Macronutrient Distribution
This next study is very interesting — showing that food texture has an even greater effect on obesity induced from diet than macronutrient content of the diet.
Disrupted food texture versus a high-fat and high sugar diet – – Gabor Erdosi – Food News 2018
The top graph demonstrates that mice fed a ”high fat diet” — which was really high in both sugar and fat (not just high in fat) gained significantly more weight than mice fed standard mice chow.
The bottom graph shows that if you take the standard mice chow and grind it fine into a powder and feed it to the mice, they gain weight to the same degree as when fed a diet high in fat and sugar. That is, the degree of food processing in the diet has at least as great an effect on obesity as the amount of fat and sugar in the diet itself.
There is something about grinding the food that changes the satiety/hunger signal.
Meal Size and Meal Frequency
Common advice given by nutritionists and Dietitians is that it is better to eat small, frequent meals than large meals less often, but there are some studies that support that it as far as hunger and satiety signalling are concerned, it is better to eat fewer, larger meals due to the effect of the incretin hormones.
The Effect of Meal Size and Meal Frequency on Incretin Hormones – – Gabor Erdosi – Food News 2018
[study on right hand side of slide]
After a low-calorie smaller meal, insulin response is proportionately higher compared to a larger meal. That is, a small meal triggers a proportionately greater insulin response that a larger meal, so if one eats small meals frequently, there is an overall greater amount of insulin released than if one eats larger meals less often.
Interestingly, it is the same for those with Type 2 Diabetes. It is possible to modulate the beta-cell sensitivity to glucose by giving obese people and those with Type 2 Diabetes fewer large meals compared to more frequent smaller meals.
Eating Speed
If one eats more slowly the incretin hormones that trigger satiety (feeling full) are released in a more pronounced manner. This holds true even when obese subjects eat calorically dense foods such as ice-cream. More of the satiety hormones are released when people eat slowly.
Glycemic Load as a Proxy for the Amount of Carbohydrate Processing
Glycemic Load indicates how a healthy person’s body will respond to amount of carbohydrate in one serving of a food. One usual serving of a food would be considered to have a very high Glycemic Load if it is ≥ 20, a high Glycemic Load if it is between 11-19 and a low Glycemic Load if it is ≤10.
Glycemic Load as a proxy for amount of carbohydrate processing – – Gabor Erdosi – Food News 2018
When one compares the Glycemic Load estimated from ancient diets at the time of the Agricultural Revolution (A on the graph) compared with the Industrial Revolution (B on the graph), the Glycemic Load at the Industrial Revolution is approaching 20, and after that point, continues to go up in an almost vertical manner. That is, Glycemic Load is a fairly accurate proxy for the degree of food processing of the diet; the more processed the diet, the higher the Glycemic Load.
Amount of Fiber as a Proxy for the Amount of Carbohydrate Processing
This next graph shows the consumption of total carbohydrate over the last century — from 1909-2000 and the amount of carbohydrate from fiber as a percentage.
Consumption of total carbohydrate from 1909-2000 and the amount of carbohydrate from fiber as a percentage – – Gabor Erdosi – Food News 2018
As can be seen, at the beginning of the century, the total amount of carbohydrate started off high and gradually decreased until about 1954, leveled off, then began to increase again. The decrease in the fiber content in carbohydrate-based foods is also evident on this graph from ~ 1960 onward.
What happened?
Perhaps it was the introduction of supposedly “healthy” polyunsaturated vegetable oils (industrial seed oils) in the 1960s that contributed to the dramatic increase in the consumption of ultra-refined carbohydrates.
At the very same time that ultra-refined carbohydrate appeared on the scene, so were novel industrial seed oils — ultra-refined fats. Perhaps it is the combination of the two in many processed food products which contributed to carbohydrate content of the diet climbing exponentially — and along with it, obesity and metabolic diseases.
Structure and Speed of Absorption
Recall from Part 1 of this article that there are several nutrient-sensing hormones in the small intestine, but with respect to the effect of food processing, SGLT1 is a glucose sensor and both K-cells and L-cells contain this nutrient-sensing receptor.
Intact versus disrupted structure affects the speed of absorption in morbidly obese – Gabor Erdosi – Food News 2018
In the morbidly obese, intestinal glucose absorption high up in the intestine is accelerated due to SGLT-1 from the K-cells. SGLT-1, along with GIP from the K-cells results in high insulin and high glucagon release, which results in both hyperinsulinemia and hyperglycemia.
Intact structures in grain are not accessible to the digestive enzyme amylase (which breaks down starch to glucose), so when grain is consumed intact, this delays gastric emptying and creates a barrier to starch digestion. The degree to which grain is intact was found to be more effective in improving glucose metabolism than dietary fiber, irrespective of the type of cereal
Evidence for Why We Get Hungry 3-4 Hours After Eating Refined Carbohydrate
Recall from Part 1, the hormone ghrelin is the only hormone that can increase hunger.
Effect of Eating Refined Carbs on Ghrelin and Blood Glucose – Gabor Erdosi – Food News 2018
Looking at the graph in the top left, we can see that when one eats carbohydrate, ghrelin decreases at first below baseline for the first two hours (120 minutes), but then begins to rise. It continues to rise, exceeding baseline at three hours (180 minutes) and continues rising until four hours; resulting in significantly increased hunger.
At the same time as ghrelin (the hunger hormone) is increasing between 3 and 4 hours after eating refined carbs, serum glucose has dipped below baseline in response to eating refined carbs (as demonstrated in Part 1 of this article) and from 3 hours to 4 hours (180 minutes – 240 minutes), so that serum glucose remains low.
That is, in response to eating refined carbohydrates alone (without combining them with protein) you end up having low blood sugar and feel hungry 3-4 hours later. Blood glucose only gradually begins to increase until it is returns to baseline again at 6 hours (360 minutes).
This next study is a comparison between normal weight and obese people.
Satiety and Hunger Signaling in Normal-Weight and Obese Subjects – Gabor Erdosi – Food News 2018
On the right-hand side, at the top one can see that normal weight people have normal signalling. Satiety (feeling full) goes up and one can see that PYY correspondingly goes up, hunger goes down and correspondingly, ghrelin goes down.
Below that, one can see that in the morbidly obese, their signalling for hunger and satiety is dysregulated. Satiety is going down even after they’ve eaten and correspondingly, PYY shows this dysregulation in that it also goes down. While hunger goes down and the hormone ghrelin also goes down, it is to a much lesser degree that in normal subjects.
So, the obese individuals may feel slightly less hungry, but they don’t feel satiated. This holds true whether obese individuals eat carbohydrate, protein or fat but it is especially pronounced when carbohydrate is eaten. That is, signalling is largely preserved in the morbidly obese when it comes to protein and fat, but it is lost when it comes to carbohydrate.
Obese people should avoid eating diets high in refined carbohydrate because their hunger and satiety signals are dysfunctional and they don’t receive signals that they have eaten.
Here is another study showing that in obese Chinese men, a high protein meal or a high fat meal produces more satiety and better appetite hormonal response after eating than a high carbohydrate meal.
High protein or high fat meal produces more satiety than high carbohydrate meal – Gabor Erdosi – Food News 2018
In another study, different conditions were looked at such as whether it made a difference in the hunger hormone, ghrelin, if the carbohydrate food was eaten first or last. It turned out that it is best to eat carbs last, as ghrelin continues to decrease for 2 ½ hours (150 minutes) after eating carbohydrate.
This next illustration shows that there is positive feedback mechanism between insulin and GIP.
Insulin drives GIP expression but requires glucose to do it. When you eat food with carbohydrate, GIP in the upper intestines is released, resulting in insulin being released. If you keep eating carb-based foods, there is lots of glucose present, which continues to drive the release of more and more GIP, triggering more and more insulin to be released.
This next slide shows a study with two kinds of sugar, sucrose which is ordinary table sugar and isomaltulose, which is made up of the exact same molecules of fructose and glucose, just attached together in a different configuration.
Sucrose’s effect on Plasma Glucose and GIP, GLP-1 – Gabor Erdosi – Food News 2018
As can be seen, sucrose causes a huge spike in plasma GIP secreted from the K-cells high up in the intestine compared to isomaltulose which triggers high insulin and high glucagon release and which results in both hyperinsulinemia and hyperglycemia. Sucrose also results in much lower release of GLP-1 from the L-cells, lower down in the intestine which results in some release of insulin, but a much smaller decreases glucagon so that at the level of the brain, there is less of a decrease in appetite and less of an increase satiety (feeling full). As a result, eating foods sweetened with sucrose results in higher glucose, higher insulin, very little decrease in appetite, less feeling full and less decreased food intake, compared with isomaltulose.
As a result, sustained feeding with sucrose in mice results in insulin resistance and fatty liver.
Differential Effect of eating Sucrose with a Meal or Alone – Gabor Erdosi – Food News 2018
If these sugars are eaten with a meal, instead of alone, the effect on blood glucose and insulin is removed, but GIP release is still triggered to be released to a large extent compared with isomaltulose, and fatty liver persists in the mice in the sucrose group.
The Effect of Combining Refined Carbohydrates with Fat
As can be seen from the graph on the left hand side at the bottom, when refined carbs are combined with fat, there is a huge response of GIP.
Effect of having Fat with Carbohydrate-based Food – Gabor Erdosi – Food News 2018
Eating boiled potato and low-fat veal didn’t result in this effect but the addition of butter to the potato dramatically changed this.
From an evolutionary perspective it makes sense, because there are no naturally occurring cases where a food has both high carbohydrates and high fat at the same time. Our body’s have not evolved to see these two macronutrients together.
The following is from a recent overview from May 2018 which provides a summary of GIP actions in response to a high Glycemic Index meal.
Summary of actions of GIP in response to a high Glycemic Index meal – Gabor Erdosi – Food News 2018
When high GI carbohydrate food is eaten and passes through digestion in the stomach and then as it enters the upper small intestine, the K-cells release GIP which has several actions, including decreasing lipolysis, increasing insulin secretion in the pancreas, decreasing fat oxidation, increasing the AKT-mTOR pathway in the brain, and increasing fat storage in the liver.
How Does Bariatric Surgery / Gastric Bypass Work
Many people assume that the reason gastric bypass works is because the stomach is made smaller, so that the person cannot overeat, but this is not primarily what makes it effective.
But what occurs within a week of the Roux-en-Y gastric bypass surgery is that there is a dramatic change in the balance of the incretin hormones.
Effect of Roux-en-Y Bypass Surgery on Incretin Hormones; first two weeks – Gabor Erdosi – Food News 2018
After only a week, GIP release is ½ what it was before the surgery and GLP-1 is almost doubled.
These changes in only a week are not a result of weight loss, but of the surgery’s impact on correcting the imbalance in the incretin hormones — essentially causing an opposite imbalance’ which corrects the defect cause by the Type 2 Diabetes and overeating of ultra-refined carbs.
There are other types of surgical interventions, such as the Duodenal-Jejunal bypass liner tube that impact incretin hormones, as well as numerous medications. There are selective sodium-dependent glucose transporter 1 inhibitors that block glucose absorption and impair GIP release in the same way that a roux-en-Y gastric bypass does.
“Gastric Bypass in a Pill” – Gabor Erdosi – Food News 2018
There are also numerous other medications such as sodium-glucose co-transporter 2 inhibitors, Glucagon-like Peptide 1 Agonists, and Dipeptidyl Peptidase 4 Inhibitors that impact the incretin hormones to varying degrees (and even some that claim to and do nothing!).
Numerous Other Medications Used to Impact Incretin Hormones – Gabor Erdosi – Food News 2018
…and there are low carbohydrate diets that significantly reduce the release of GIP from the K-cells, because there are low levels of carbohydrate consumed at any one time to trigger it’s release. As a result, significantly less insulin is release, which is how LCHF diets followed over time lower insulin resistance.
Effect of a Low Carbohydrate Diet on GIP – Gabor Erdosi – Food News 2018
Summary of Part 1 and Part 2 of the Perils of Food Processing
Speed and location of intestinal nutrient absorption is crucial in determining metabolic response to a food
The greatest effect in incretin hormone response is seen with carbohydrate rich plant processing, therefore retaining the plant or grain structure as much as possible is crucial
Diets high in ultra-refined, quick absorbing food plausibly results in altered intestinal hormonal profile, altered hunger / satiety signalling and as a result higher food intake and increased meal frequency
The above effect is exaggerated when ultra-processed carbohydrates are consumed in combination with significant amounts of fat (the ”doughnut effect”).
GIP may be part of a ”thrifty mechanism” in mammals; easily digestible, high energy density foods overstimulate it (think ”honey” to hunter-gatherers).
Practical ”Takeaways”
Processing of food that are high in fat and protein has little effect on intestinal hormone levels, so prioritize food items in terms of desired amount of macronutrients
Plant or grain foods (carbohydrate containing) should be carefully selected based on their most dense, undisturbed structure. Processing, whether grinding, pureeing or cooking disrupts the plant / grain structure and accelerates absorption of the carbohydrate, which triggers an intestinal hormonal response which results in reduced satiety. Excluding most carbohydrate-based foods also solves this problem
Consume carbohydrate foods at the end of the meal (after protein and fat foods)
Have fewer, larger meals vs small, frequent ones. Avoid ”snacking” between meals
Eat meals slowly to maximize the satiety effect and increase the release of the lower intestinal hormones.
Technical summary
Refined carbs trigger huge amounts of GIP, although the decreased GIP:GLP-1 ratio may be more important than the GIP AUC alone.
Refined carbs increase GIP response to fat and proteins, and the effect of glucose and long chain fatty acids are additive.
Fats and proteins both trigger large amounts of GIP, depending on the context
Refined carbs does not trigger GLP-1 (does it impair it?). GLP-1 secreting L cells have an hour-glass like distribution in the small and large intestine. Duodenal GLP-1 has an important role in the so-called cephalic phase of insulin response.
Everything triggers GLP-1, just the pattern and amount differs based on intestinal stimulation by food.
Quick-digesting carbs are absorbed mainly in the proximal small intestins and fail to induce gastric retention. If carbs are eaten first, a huge amount of GIP is created (i.e. balance between the incretin hormones is tilted in favour of GIP release).
Roughage, protein and fat delay gastric emptying and even out glucose release profile along the small intestine. That is, if carbs are eaten last, GLP-1 is slowly released to counter the effect of GIP.
Perhaps you wonder what all this information means for you. How should this information change the way you eat and what you eat? What does this mean in practical terms when planning dinner, or eating dinner – especially if you have Type 2 Diabetes or insulin resistance and also if you are well now, but have a family history with many common metabolic disorders. How can you change how you eat to stay well?
I can help.
Please send me a note using the “Contact Me” form located on the tab above to find out information about the services I offer (in-person or via Distance Consultation using telephone or Skype) and I will reply shortly.
16. Carrel, G., L. Egli, C. Tran, P. Schneiter, V. Giusti, D. D’Alessio, and L. Tappy. ”Contributions of Fat and Protein to the Incretin Effect of a Mixed Meal.” American Journal of Clinical Nutrition 94, no. 4 (2011):
997—1003.
17. Bligh, H. Frances J., Ian F. Godsland, Gary Frost, Karl J. Hunter, Peter Murray, Katrina MacAulay, Della Hyliands, et al. ”Plant-Rich Mixed Meals Based on Paleolithic Diet Principles Have a Dramatic Impact on
Incretin, Peptide YY and Satiety Response, but Show Little Effect on Glucose and Insulin Homeostasis: An Acute-Effects Randomized Study.” British Journal of Nutrition 113, no. 04 (2015): 574—84.
18. Desmarchelier, Charles, Tobias Ludwig, Ronny Scheundel, Nadine Rink, Bernhard L. Bader, Martin Klingenspor, and Hannelore Daniel. ”Diet-Induced Obesity in Ad Libitum-Fed Mice: Food Texture Overrides the Effect of Macronutrient Composition.” British Journal of Nutrition 109, no. 08 (2013): 1518—27.
19. Vilsbí¸ll, T., T. Krarup, J. Sonne, S. Madsbad, A. Ví¸lund, A. G. Juul, and J. J. Holst. ”Incretin Secretion in Relation to Meal Size and Body Weight in Healthy Subjects and People with Type 1 and Type 2 Diabetes
Mellitus.” The Journal of Clinical Endocrinology & Metabolism 88, no. 6 (2003): 2706—13.
20. Alsalim, Wathik, Bilal Omar, Giovanni Pacini, Roberto Bizzotto, Andrea Mari, and Bo Ahrén. ”Incretin and Islet Hormone Responses to Meals of Increasing Size in Healthy Subjects.” The Journal of Clinical
Endocrinology & Metabolism 100, no. 2 (2015): 561—68.
21. Koopman, Karin E., Matthan W.A. Caan, Aart J. Nederveen, Anouk Pels, Mariette T. Ackermans, Eric Fliers, Susanne E. la Fleur, and Mireille J. Serlie. ”Hypercaloric Diets with Increased Meal Frequency, but Not Meal Size, Increase Intrahepatic Triglycerides: A Randomized Controlled Trial.” Hepatology 60, no. 2 (2014): 545—53.
22. Stote, Kim S., David J. Baer, Karen Spears, David R. Paul, G. Keith Harris, William V. Rumpler, Pilar Strycula, et al. ”A Controlled Trial of Reduced Meal Frequency without Caloric Restriction in Healthy, Normal-Weight, Middle-Aged Adults.” The American Journal of Clinical Nutrition 85, no. 4 (April 1, 2007): 981—88.
23. McQuaid, S. E., L. Hodson, M. J. Neville, A. L. Dennis, J. Cheeseman, S. M. Humphreys, T. Ruge, et al. ”Downregulation of Adipose Tissue Fatty Acid Trafficking in Obesity: A Driver for Ectopic Fat Deposition?” Diabetes 60, no. 1 (2010): 47—55.
24. Kokkinos, Alexander, Le Roux, Carel W, Kleopatra Alexiadou, Nicholas Tentolouris, Royce P. Vincent, Despoina Kyriaki, et al. ”Eating Slowly Increases the Postprandial Response of the Anorexigenic Gut
Hormones, Peptide YY and Glucagon-Like Peptide-1.” The Journal of Clinical Endocrinology & Metabolism 95, no. 1 (January 1, 2010): 333—37.
25. Rigamonti, A. E., F. Agosti, E. Compri, M. Giunta, N. Marazzi, E. E. Muller, S. G. Cella, and A. Sartorio. ”Anorexigenic Postprandial Responses of PYY and GLP1 to Slow Ice Cream Consumption: Preservation in
Obese Adolescents, but Not in Obese Adults.” European Journal of Endocrinology 168, no. 3 (March 1, 2013): 429—36.
26. Llewellyn, Clare H., Van Jaarsveld, Cornelia Hm, David Boniface, Susan Carnell, and Jane Wardle. ”Eating Rate Is a Heritable Phenotype Related to Weight in Children.” The American Journal of Clinical Nutrition
88, no. 6 (December 1, 2008): 1560—66.
27. Chapter 1. in ”Sweeteners and Sugar Alternatives in Food Technology”, 2nd Edition Kay O’Donnell (Editor), Malcolm Kearsley (Editor) ISBN: 978-1-118-37397-2 Jul 2012
28. Wiley-Blackwell Gross, Lee S., Li Li, Earl S. Ford, and Simin Liu. ”Increased Consumption of Refined Carbohydrates and
the Epidemic of Type 2 Diabetes in the United States: An Ecologic Assessment.” The American Journal of Clinical Nutrition 79, no. 5 (2004): 774—779.
29. Scazzina, Francesca, Susanne Siebenhandl-Ehn, and Nicoletta Pellegrini. ”The Effect of Dietary Fibre on Reducing the Glycaemic Index of Bread.” British Journal of Nutrition 109, no. 07 (2013): 1163—74.
https://doi.org/10.1017/S0007114513000032.
30. Nguyen, Nam Q., Tamara L. Debreceni, Jenna E. Bambrick, Bridgette Chia, Judith Wishart, Adam M. Deane, Chris K. Rayner, Michael Horowitz, and Richard L. Young. ”Accelerated Intestinal Glucose Absorption in Morbidly Obese Humans: Relationship to Glucose Transporters, Incretin Hormones, and Glycemia.” The Journal of Clinical Endocrinology & Metabolism 100, no. 3 (2015): 968—76.
31. Foster-Schubert, Karen E., Joost Overduin, Catherine E. Prudom, Jianhua Liu, Holly S. Callahan, Bruce D. Gaylinn, Michael O. Thorner, and David E. Cummings. ”Acyl and Total Ghrelin Are Suppressed Strongly by Ingested Proteins, Weakly by Lipids, and Biphasically by Carbohydrates.” The Journal of Clinical Endocrinology & Metabolism 93, no. 5 (2008): 1971—79.
32. Lomenick, Jefferson P., Maria S. Melguizo, Sabrina L. Mitchell, Marshall L. Summar, and James W. Anderson. ”Effects of Meals High in Carbohydrate, Protein, and Fat on Ghrelin and Peptide YY Secretion in
Prepubertal Children.” The Journal of Clinical Endocrinology & Metabolism 94, no. 11 (2009): 4463—71.
33. Rizi, Ehsan Parvaresh, Tze Ping Loh, Sonia Baig, Vanna Chhay, Shiqi Huang, Jonathan Caleb Quek, E. Shyong Tai, Sue-Anne Toh, and Chin Meng Khoo. ”A High Carbohydrate, but Not Fat or Protein Meal Attenuates Postprandial Ghrelin, PYY and GLP-1 Responses in Chinese Men.” PLOS ONE 13, no. 1 (January 31, 2018): e0191609.
34. Shukla, Alpana P., Elizabeth Mauer, Leon I. Igel, Wanda Truong, Anthony Casper, Rekha B. Kumar, Katherine H. Saunders, and Louis J. Aronne. ”Effect of Food Order on Ghrelin Suppression.” Diabetes
Care, 2018, dc172244.
35. Hí¤gele, Franziska A, Franziska Bí¼sing, Alessa Nas, Julian Aschoff, Lena Gní¤dinger, Ralf Schweiggert, Reinhold Carle, and Anja Bosy-Westphal. ”High Orange Juice Consumption with or In-between Three
Meals a Day Differently Affects Energy Balance in Healthy Subjects.” Nutrition & Diabetes 8, no. 1 (2018).
https://doi.org/10.1038/s41387-018-0031-3.
36. García-Martínez, Jose Manuel, Ana Chocarro-Calvo, Antonio De la Vieja, and Custodia García-Jiménez. ”Insulin Drives Glucose-Dependent Insulinotropic Peptide Expression via Glucose-Dependent Regulation of
FoxO1 and LEF1/β-Catenin.” Biochimica et Biophysica Acta (BBA) – Gene Regulatory Mechanisms 1839, no. 11 (November 1, 2014): 1141—50.
37. Pfeiffer, Andreas F.H., and Farnaz Keyhani-Nejad. ”High Glycemic Index Metabolic Damage — a Pivotal
Role of GIP and GLP-1.” Trends in Endocrinology & Metabolism, 2018.
38. Collier, G., and K. O’Dea. ”The Effect of Coingestion of Fat on the Glucose, Insulin, and Gastric Inhibitory Polypeptide Responses to Carbohydrate and Protein.” The American Journal of Clinical Nutrition 37, no. 6 (June 1, 1983): 941—44.
39. McClean, P. L., N. Irwin, R. S. Cassidy, J. J. Holst, V. A. Gault, and P. R. Flatt. ”GIP Receptor Antagonism Reverses Obesity, Insulin Resistance, and Associated Metabolic Disturbances Induced in Mice by Prolonged
Consumption of High-Fat Diet.” AJP: Endocrinology and Metabolism 293, no. 6 (October 23, 2007):E1746—55.
40. Ceperuelo-Mallafré, Victí²ria, Xavier Duran, Gisela Pachón, Kelly Roche, Lourdes Garrido-Sánchez, Nuria Vilarrasa, Francisco J. Tinahones, et al. ”Disruption of GIP/GIPR Axis in Human Adipose Tissue Is Linked
to Obesity and Insulin Resistance.” The Journal of Clinical Endocrinology & Metabolism 99, no. 5 (May 2014): E908—19.
41. Gí¶gebakan, í–zlem, Martin A. Osterhoff, Rita Schí¼ler, Olga Pivovarova, Michael Kruse, Anne-Cathrin Seltmann, Alexander S. Mosig, Natalia Rudovich, Michael Nauck, and Andreas F. H. Pfeiffer. ”GIP Increases Adipose Tissue Expression and Blood Levels of MCP-1 in Humans and Links High Energy Diets to Inflammation: A Randomised Trial.” Diabetologia 58, no. 8 (August 2015): 1759—68.
42. Mohammad, S., R. T. Patel, J. Bruno, M. S. Panhwar, J. Wen, and T. E. McGraw. ”A Naturally Occurring GIP Receptor Variant Undergoes Enhanced Agonist-Induced Desensitization, Which Impairs GIP Control of
Adipose Insulin Sensitivity.” Molecular and Cellular Biology 34, no. 19 (2014): 3618—29.
43. Nie, Y., R. C. Ma, J. C. N. Chan, H. Xu, and G. Xu. ”Glucose-Dependent Insulinotropic Peptide Impairs Insulin Signaling via Inducing Adipocyte Inflammation in Glucose-Dependent Insulinotropic Peptide
Receptor-Overexpressing Adipocytes.” The FASEB Journal 26, no. 6 (2012): 2383—93.
44. Timper, K., J. Grisouard, N. S. Sauter, T. Herzog-Radimerski, K. Dembinski, R. Peterli, D. M. Frey, et al. ”Glucose-Dependent Insulinotropic Polypeptide Induces Cytokine Expression, Lipolysis, and Insulin
Resistance in Human Adipocytes.” AJP: Endocrinology and Metabolism 304, no. 1 (2012): E1—13.
46. Boylan, Michael O., Patricia A. Glazebrook, Milos Tatalovic, and M. Michael Wolfe. ”Gastric Inhibitory Polypeptide Immunoneutralization Attenuates Development of Obesity in Mice.” American Journal of
Physiology – Endocrinology And Metabolism 309, no. 12 (2015): E1008—18.
47. Nasteska, D., N. Harada, K. Suzuki, S. Yamane, A. Hamasaki, E. Joo, K. Iwasaki, K. Shibue, T. Harada, and N. Inagaki. ”Chronic Reduction of GIP Secretion Alleviates Obesity and Insulin Resistance Under High-Fat
Diet Conditions.” Diabetes 63, no. 7 (2014): 2332—43.
48. Althage, M. C., E. L. Ford, S. Wang, P. Tso, K. S. Polonsky, and B. M. Wice. ”Targeted Ablation of Glucose-Dependent Insulinotropic Polypeptide-Producing Cells in Transgenic Mice Reduces Obesity and
Insulin Resistance Induced by a High Fat Diet.” Journal of Biological Chemistry 283, no. 26 (2008): 18365—76.
49. Calanna, S., F. Urbano, S. Piro, R. M. Zagami, A. Di Pino, L. Spadaro, F. Purrello, and A. M. Rabuazzo. ”Elevated Plasma Glucose-Dependent Insulinotropic Polypeptide Associates with Hyperinsulinemia in
Metabolic Syndrome.” European Journal of Endocrinology 166, no. 5 (2012): 917—22.
50. Chia, Chee W., Juliana O. Odetunde, Wook Kim, Olga D. Carlson, Luigi Ferrucci, and Josephine M. Egan. ”GIP Contributes to Islet Trihormonal Abnormalities in Type 2 Diabetes.” The Journal of Clinical Endocrinology & Metabolism 99, no. 7 (July 2014): 2477—85.
51. Chen, Shu, Fumiaki Okahara, Noriko Osaki, and Akira Shimotoyodome. ”Increased GIP Signaling Induces Adipose Inflammation via a HIF-1α-Dependent Pathway and Impairs Insulin Sensitivity in Mice.” American
Journal of Physiology-Endocrinology and Metabolism 308, no. 5 (December 23, 2014): E414—25.
52. Cavin, Jean-Baptiste, André Bado, and Maude Le Gall. ”Intestinal Adaptations after Bariatric Surgery: Consequences on Glucose Homeostasis.” Trends in Endocrinology & Metabolism 28, no. 5 (May 2017):
354—64.
53. Xiong, Shao-Wei, Jing Cao, Xian-Ming Liu, Xing-Ming Deng, Zeng Liu, and Fang-Ting Zhang. ”Effect of Modified Roux-En-Y Gastric Bypass Surgery on GLP-1, GIP in Patients with Type 2 Diabetes Mellitus.”
Gastroenterology Research and Practice 2015 (2015): 1—4.
54. Falkén, Y., P. M. Hellstrí¶m, J. J. Holst, and E. Ní¤slund. ”Changes in Glucose Homeostasis after Roux-En-Y Gastric Bypass Surgery for Obesity at Day Three, Two Months, and One Year after Surgery: Role of Gut
Peptides.” The Journal of Clinical Endocrinology & Metabolism 96, no. 7 (July 1, 2011): 2227—35.
55. Salinari, S., A. Bertuzzi, S. Asnaghi, C. Guidone, M. Manco, and G. Mingrone. ”First-Phase Insulin Secretion Restoration and Differential Response to Glucose Load Depending on the Route of Administration
in Type 2 Diabetic Subjects After Bariatric Surgery.” Diabetes Care 32, no. 3 (March 1, 2009): 375—80.
56. Jirapinyo, Pichamol, Andrea V. Haas, and Christopher C. Thompson. ”Effect of the Duodenal-Jejunal Bypass Liner on Glycemic Control in Patients With Type 2 Diabetes With Obesity: A Meta-Analysis With
Secondary Analysis on Weight Loss and Hormonal Changes.” Diabetes Care 41, no. 5 (May 1, 2018):1106—15.
57. Narita, T., H. Yokoyama, R. Yamashita, T. Sato, M. Hosoba, T. Morii, H. Fujita, K. Tsukiyama, and Y. Yamada. ”Comparisons of the Effects of 12-Week Administration of Miglitol and Voglibose on the Responses of Plasma Incretins after a Mixed Meal in Japanese Type 2 Diabetic Patients.” Diabetes, Obesity and Metabolism 14, no. 3 (2012): 283—87.
58. Dobbins, Robert L., Frank L. Greenway, Lihong Chen, Yaping Liu, Sharon L. Breed, Susan M. Andrews, Jeffrey A. Wald, Ann Walker, and Chari D. Smith. ”Selective Sodium-Dependent Glucose Transporter 1
Inhibitors Block Glucose Absorption and Impair Glucose-Dependent Insulinotropic Peptide Release.” American Journal of Physiology-Gastrointestinal and Liver Physiology 308, no. 11 (2015): G946—54.
59. Zheng, Sean L., Alistair J. Roddick, Rochan Aghar-Jaffar, Matthew J. Shun-Shin, Darrel Francis, Nick Oliver, and Karim Meeran. ”Association Between Use of Sodium-Glucose Cotransporter 2 Inhibitors,
Glucagon-like Peptide 1 Agonists, and Dipeptidyl Peptidase 4 Inhibitors With All-Cause Mortality in Patients With Type 2 Diabetes.” JAMA 319, no. 15 (2018): 1580.
60. Lin, Po-Ju, and Katarina T. Borer. ”Third Exposure to a Reduced Carbohydrate Meal Lowers Evening Postprandial Insulin and GIP Responses and HOMA-IR Estimate of Insulin Resistance.” PLOS ONE 11, no.
10 (2016): e0165378.
LEGAL NOTICE: The contents of this blog, including text, images and cited statistics as well as all other material contained here (the ”content”) are for information purposes only. The content is not intended to be a substitute for professional advice, medical diagnosis and/or treatment and is not suitable for self-administration without the knowledge of your physician and regular monitoring by your physician. Do not disregard medical advice and always consult your physician with any questions you may have regarding a medical condition or before implementing anything you have read or heard in our content.
A study that is due to be published on July 3, 2018 in the scientific journal Cell Metabolism is the first to demonstrate that compared to foods high in carbs or fat, foods with both carbs and fats together result in much more dopamine being released from the striatum, which is the reward-center of our brain [1]. Dopamine is the same neurotransmitter that is released during sex and that is involved in the addictive “runner’s high” familiar to athletes. This is one powerful neurotransmitter!
It is thought that there are separate areas of the brain that evaluate carb-based foods and fat-based foods and both are involved in the release of dopamine, but when carbs and fat appear in the same food together, this results in what the researchers called a “supra-additive effect”. That is, both areas of the brain get activated at the same time, resulting in much more dopamine being released and a much bigger feeling of “reward” being produced.
This combination of carbs and fat in the same food is why we find foods such as French fries, donuts and potato chips irresistible.
In fact, the study found that people were willing to pay more for foods that combine both carbs and fat than for foods that were only high in carbs but not fat such as candy, or only high in fat but not carbs, such as cheese.
This powerful reward-system involving dopamine is why we will choose the fries over the baked potato and why we have no difficulty wolfing back a few donuts, even when we’ve just eaten a meal.
This “supra-additive effect” on the pleasure center of our brain, along with the fact that more insulin is released when both carbs and fat are eaten together[2] may help explain the roots of the current obesity epidemic and the metabolic diseases such as Type 2 Diabetes that go along with it.
Carbohydrate intake was high in the early 1900s and gradually decreased until about 1954, leveled off, then began to increase again[3]. What caused that to occur? At that time, ultra-refined carbohydrates began appearing in the market and these by their very nature were devoid of the whole, unprocessed grain that slows the release of insulin [3] (for more information on the mechanism, please see this article). Excess release of insulin made worse by the constant eating of ultra-refined carbohydrate foods underlies the process of how insulin resistance develops and in time, how Type 2 Diabetes develops [3].
The early 1950’s was also when the ”diet-heart hypothesis” proposed by Ancel Keys took root, along with the recommendation that Americans (and later, Canadians) reduce their consumption of saturated fat (more in this article). With the recommendation to decrease saturated fat was the necessity to create fats to replace them, which is when and why both soybean oil and later, canola oil were created (see this article for more information). These industrial seed oils began to replace natural fats such as butter, lard and tallow in home and restaurant cooking, frying and baking.
With the creation of “polyunsaturated vegetable oils”, French fries were now a healthy food – after all, they were vegetables fried in “healthy polyunsaturated fat”. What could possibly go wrong?
This new study provides the missing link as to the mechanism by which the “perfect storm” was created. That “perfect storm” was the simultaneous appearance in the late 1950s and early 1960s of ultra-refined carbohydrates and industrial seed oils (promoted as “heart healthy” by the American and Canadian Dietary Guidelines) that literally hijacked the reward system of our brain!
Is there little wonder why rates of overweight and obesity began rising at in the early 1960s and have continued to rise dramatically ever since?
As far as our brains are concerned, French fries are much more desirable than a baked potato and donuts and pastry much more desirable than toast because they literally make us feel good! Eating French fries and pastry results in considerably more dopamine being released than eating baked potato or plain toast. Eating these foods produce something comparable to a “runner’s high” in people that have never run a block or have even gotten off the couch!
While discovery of the dopamine-centered mechanism is new to this study, the food industry has known for some time that processed foods containing both carbohydrate and fat will result in people coming back and buying more and more of their product. Carbs and fat is why Lays® chips could boast “betcha can’t eat just one!“, but it’s not just Lays®. This combination of carbs and fat is in all processed foods; from so-called “junk food” such as chips and Cheezies® to foods that are perceived as “healthy foods”, such as granola bars and commercial peanut butter.
Carbs and fats together are the essence of “fast food” – from Big Macs® dripping with cheese and mayo sandwiched between several buns, to French fries of all types, super-sized or not. People may joke about “junk food being addictive”, however understanding the “supra-additive” effect of carbohydrate combined with fat makes these foods as addictive to our brains as a “runner’s high” is to an athlete, or what makes people seek out sex. Addictive? Maybe not in the truest sense of the word except in cases of food addiction, but certainly in the rest of us there is a powerful draw to want to eat them.
Knowing and understanding this mechanism is of no small consequence! It should inform our food choices.
We need to be aware of foods that we eat that “hijack” our appetites. They could be “healthy foods” like cashews that are both high in fat and high in carbohydrate. Given what we know about the triggering of the reward system in the brain, should those of us with current or past weight problems have them around?
Another way this knowledge should inform our food choices is around the concept of “cheat days”. People who see me seeking weight loss often ask me about whether they can have one day a week, or one day a month where they eat “cheat foods”. Knowing the very potent chemically-mediated reward system involved with eating foods such as pizza or French fries or ice cream, do you think these are foods that are helpful to eat once a week or once a month? How much will eating those foods cause you to crave them later, after your “cheat day”? Is it worth it?
From a purely academic perspective, knowing the mechanism also helps explains why metabolically healthy people can lose weight either following a low-fat diet or a low-carb diet, because it is the combination of both carbs and fats that stimulate the reward centers.
Note: a low-carb approach is preferable for people who have have already become insulin resistant or diagnosed with Type 2 Diabetes because they are no longer able to handle more than small amounts of carbohydrate at a time without it significantly impacting their blood sugar (and insulin) levels.
So, knowing that eating carbs and fat together result in a huge release of dopamine and light up the reward-centers of our brain, how should we choose foods differently? What do we do if we eat carbs and fat at the same meal; does it matter which we eat first? Does how we process and prepare our carb-based foods make a difference on our blood sugar?
The answer to these questions is easy. Yes, based in this study and many others, how we eat meals that have carbs, fat and protein (called “mixed meals”) matters and how quickly or slowly our blood sugar rises depends on when we eat them as well as how we process and prepare them.
This is where I can help.
I can explain in a very easy to understand way how to eat in such as ways as to minimize the impact on blood sugar, and beyond that, how to lower insulin release and insulin resistance which keeps blood sugar levels high.
If you would like information about my services or about having me design a Meal Plan for you, please send me a note using the “Contact Me” tab above and I will reply as shortly.
Di Feliceantonio et al., 2018, Supra-Additive Effects of Combining
Fat and Carbohydrate on Food Reward, Cell Metabolism 28, 1—12
Carrel, G., L. Egli, C. Tran, P. Schneiter, V. Giusti, D. D’Alessio, and L. Tappy. ”Contributions of Fat and Protein to the Incretin Effect of a Mixed Meal.” American Journal of Clinical Nutrition 94, no. 4 (2011):997—1003.
Gross, Lee S., Li Li, Earl S. Ford, and Simin Liu. ”Increased Consumption of Refined Carbohydrates and the Epidemic of Type 2 Diabetes in the United States: An Ecologic Assessment.” The American Journal of Clinical Nutrition 79, no. 5 (2004): 774—779.
O’Dea, K., Nestel, P.J., and Antonoff, L. ”Physical Factors Influencing Postprandial Glucose and Insulin Responses to Starch” 33, no. 4 (April 1, 1980): 760—65. https://doi.org/10.1093/ajcn/33.4.760.
LEGAL NOTICE: The contents of this blog, including text, images and cited statistics as well as all other material contained here (the ”content”) are for information purposes only. The content is not intended to be a substitute for professional advice, medical diagnosis and/or treatment and is not suitable for self-administration without the knowledge of your physician and regular monitoring by your physician. Do not disregard medical advice and always consult your physician with any questions you may have regarding a medical condition or before implementing anything you have read or heard in our content.
In my time interacting on social media (Facebook, Twitter) as the LCHF-Dietitian (@lchf-RD) I keep coming across many of the same misconceptions about eating a low carb diet, so I decided to write an article dispelling 10 of the most common myths.
Myth 1: “A low carb diet will cause clogged arteries and heart attacks because it is too high in saturated fat.”
Firstly, as elaborated on in a previous article, a recent study published at the end of March 2018 in Nutrients looked at health and nutrition data from 158 countries worldwide and found that total fat and animal fat consumption were least associated with the risk of cardiovascular disease, so even if someone following a low carb diet chose to eat foods high in saturated fat, it does not mean they are necessarily at higher risk of heart attacks or strokes.
Secondly, a low carb diet does not necessarily have to be high in saturated fat. In fact, it may have very little added fat at all such as when people are aiming to lose weight, so that they burn more of their own body fat.
While there is no increased risk with eating the saturated fat that is naturally found in meat (chicken, beef, pork, etc.), except for specific clinical requirements (for example, a ketogenic diet for epilepsy) there is no reason anyone has to add additional saturated fat. There are other sources of fat that are delicious and have beneficial properties, such as monounsaturated fats found naturally in olive oil and avocados and their oils.
Myth 2: “A low carb diet has way too much protein in it!”
There are different types of low carb diets and a low carb diet may not necessarily have a lot of protein – whether as eggs, cheese, meat, or fish.
In a very low carb (ketogenic) diet used for epilepsy, the diet is mostly fat and has low protein, however in a low carb diet used for weight loss and improving metabolic conditions such as Type 2 Diabetes or high blood pressure, the amount of protein will be moderate.
How much protein is “too much”?
The RDA for Protein is set at 56 gm per day (based on 0.8 g protein per kg of body weight) is the minimum amount to prevent deficiency. This is not the optimal amount, but the absolute minimum amount. So, whether a given person is eating 1200 calories a day or 2500 calories per day they have an absolute requirement for 56 gm of protein per day.
The maximum amount of protein per day is set at ~200 g / day and is calculated based on >2.5 g protein per kg of body weight, and the range from 56 g to 200 g of protein per day is referred to as the range of safe intake.
According to Dr. Donald Layman, Professor Emeritus of Human Nutrition from the University of Illinois, a high protein diet doesn’t start “until well above 170 g / day”. You can read more about this here.
Everybody’s needs for protein is different and many people, especially adults and older adults are either not getting enough protein or it is mostly at dinner, with little at breakfast and lunch, which is a concern in older adults, as it puts them at risk for sarcopenia, the muscle wasting often seen in older adults eating a Westernized diet. You can read more about that here.
In any case, most low carb diets aren’t anywhere near the level of what is considered a “high protein diet”, let alone “too high in protein”.
Myth 3: “Low Carb Diets involve eating lots of meat”.
While there are some, especially those involved in the body-building or body-sculpting world that choose to follow a variation of a low-carb diet which involves eating lots of meat (and protein, in general), there are some variations of a low-carb diet that don’t involve eating meat at all. As mentioned above, ketogenic diets used for those with epilepsy or seizure disorder are mostly fat and ketogenic diets used as an adjunct therapy in treatment of specific types of cancer are often mostly fat, as well depending on the specific type of cancer.
Therapeutic low carb or ketogenic diets used for weight loss or improving metabolic conditions such as Type 2 Diabetes, high blood pressure and abnormal cholesterol may be based on a moderate amount of protein, with some of that as meat if the individual eats it and enjoys it. To eat low-carb, there is no requirement to eat meat at all.
A low carb diet can be designed to accommodate pescatarians (those that only eat fish), as well as vegetarians. There are even some vegans that choose to follow a low carb diet for a variety of reasons, although getting enough of all nutrients is a major challenge, just as it is for those following a Standard American/Canadian Diet.
I’ve written an article about the range of foods that can be eaten on a low carb diet which can be read here.
Myth 4: “Low carb diets are dangerous because the brain needs a certain amount of carbohydrate”.
Except for erythrocytes (red blood cells) every cell in the body has mitochondria (the so-called “powerhouse of the cell”). The mitochondria can use a variety of fuel sources and turn it into Acetyl-CoA, which then enters the Kreb’s Cycle and generates Adenosine Triphosphate (ATP) which is what every cell in the body requires for life. The brain is no different than any other cell in the body that has mitochondria, as it can efficiently and safely use Acetyl-CoA can be made from carbohydrate (e.g. glucose), ketone bodies (a byproduct of fatty acid breakdown) and amino acids from protein to generate Acetyl-Coa. Most parts of the brain have no requirement for dietary carbohydrate, as it can use ketones generated from fat breakdown.
Certain parts of the brain and red blood cells do need glucose (approximately 30 g a day) and that need is fulfilled by a process called gluconeogenesis where glucose is made by the liver and kidneys from substrates other than carbohydrate, including amino acids (from proteins) or glycerol (from fat breakdown).
In fact, the human body doesn’t require any dietary carbohydrate provided the amount of protein and fat in the diet is sufficient (to be used as substrates, as mentioned above); from page 275 of Dietary Reference Intakes for Energy, Carbohydrate, Fiber, Fat, Fatty Acids, Cholesterol, Protein and Amino Acids (2005);
”The lower limit of dietary carbohydrate compatible with life apparently is zero, provided that adequate amounts of protein and fat are consumed.
This does not mean that low carb diets contain no carbohydrate! As mentioned above, some liberal low carb diets have enough carbohydrate such that the person does not go into ketosis, while therapeutic ketogenic diets (done under medical supervision) such as those used for the management of epilepsy or as an adjunct to cancer treatment may have < 30 g of carbohydrate.
Myth 5: “A Low carb diet is imbalanced and causes nutrient deficiencies”.
With the exception of a therapeutic ketogenic diet for epilepsy or as an adjunct to cancer treatment, eating a well-formulated low-carb diet provides adequate nutrients, even those such as thiamine (vitamin B1) and folate which are normally associated with grain products. There are many low-carb sources of thiamine, including pork, chicken liver, macadamia nuts and peanuts, flax-seed and asparagus and just 1 serving of each of these can meet an adult’s daily requirement.
Likewise, there are many low-carb sources of folate (vitamin B9), including the low carb leafy vegetables that are abundant in a well-formulated low carb diet, as well as other green vegetables such as asparagus, spinach, Brussels Sprouts and avocado.
Vitamin C is plentiful in foods outside of citrus fruit, including red and green bell pepper, broccoli, cauliflower and strawberries, as well as in lemon and lime that can be used as a seasoning for salad dressing, fish or to flavour water.
Calcium is easily obtained from well-designed meal plans that include cheese and yogurt, fish (such as sardines and canned salmon), almonds and leafy vegetables such as spinach, collards and kale.
A well-designed low carb diet provides a wide range of foods; from cheese and other dairy products, nuts, seeds, fruit, low carb vegetables and meat, fish and poultry and can provide the essential nutrients that a healthy body requires, including vitamins and minerals.
The only two nutrients that will likely be sub-optimal are vitamin D and magnesium— but are certainly not provided in lesser amounts than in the average Canadian or American diet. I advocate for supplementation of both of these nutrients, whether someone is following a Standard American or Canadian diet or a low-carb diet.
Myth 6: “Low carb diets are so restrictive”.
This is one of the two myths that I often joke about around the dinner table, because the food we eat is anything but restrictive.
People can eat a huge variety of vegetables and meat, fish and poultry which require the minimum of cooking and food preparation so even for someone with little or no cooking skill or time to prepare food, a well-designed low carb diet is entirely possible. I design them for clients all the time, because many people fall into this category or live alone and don’t want to cook elaborate meals for themselves.
For those that enjoy cooking and have the time to do it there are very few, if any traditional foods that can not be made low carb – and made very tasty!
As can be easily seen in the recipes on this web page, as well as the article I wrote on what people can eat on a low carb diet, there is almost no recipe that can be adapted for those that choose to eat low carb. There is even rolls for sandwiches and several different types of pizza (to suit those who follow a higher fat low carb diet or a lower fat low carb diet). I invent the recipes for myself and share them on my webpage because food should not only be healthy, but enjoyable.
Myth 7: “Low carb diets are not sustainable”.
This is the second myth that makes me chuckle, because I know of people that have been eating this way for 15 or 20 years which in and by itself demonstrates it is quite sustainable. There are one-year and two-years studies on this web page the also indicate that a well designed low carb diet is quite sustainable.
What is ”not sustainable” about eating fresh, healthy, whole foods that can be prepared with a minimum of cooking or as elaborate as one’s imagination allows?
Myth 8: “Low carb diets require you to constantly count carbs and check your ketone levels”.
First of all, a well-designed low carb Meal Plan does all the “carb counting” for you – all you need to do is decide what you want to eat. This is no different whether someone eats a moderate amount of carbs or a low amount of carbs. In fact, how foods are grouped on your Meal Plan, you’ll know how many carbs are in one serving any food in that group, should you want to add something to your Meal Plan.
As far as checking ketones, unless one is on a low level of carbohydrates (ketogenic diet) and either has certain health conditions or taking specific medications, there is no need.
Myth 9: “It doesn’t matter if you eat low carb or low fat, the only thing that matters is Calories In Calories Out”.
This answer may stir up some controversy, because there is a wide range of opinion on this.
Some advocates of a low-carb diet insist that Calories In Calories Out (CICO) is irrelevant because metabolism is different when one eats low carb. Some advocates of a low-fat diet will say that low-carb only works because in the end, people eat less calories.
I think it is “both / and not “either / or”.
Most low-fat diets are calorie-restricted diets and when calories are restricted, people’s metabolism slows down. That is why people following a carbohydrate-based low-calorie diet feel cold, tired and lethargic; because their body is conserving the calories it is getting for important metabolic functions. Because the body is primarily using carbohydrate as fuel, fat stores are only accessed when carbohydrate is restricted – which also slows down metabolism.
When people are eating a diet that is low in carbohydrate and which has sufficient protein, and is higher in a variety of fats, people’s bodies are mainly using fat as fuel. If their Meal Plan is designed for weight loss, then some of the fat they are using for fuel is their own fat stores – so ‘fuel’ is never restricted. If the body needs more energy, it will take the “extra” it needs from fat stores. In this way, the body doesn’t have to slow metabolism to conserve energy, because there is always more fat in the person’s fat stores. Eating a diet based predominantly based on healthy fats and protein with much lower level of carbohydrates makes people feel full after eating much less, so the end result is that they generally eat less calories, which is why they are able to lose weight.
That is, a calorie is still a calorie but all fuels are not considered equal.
Myth 10: “Ketones are dangerous and you can die from them!”
Unfortunately, this is way too common a myth – even one in which some healthcare professionals are confused.
Ketones are naturally produced in our bodies during periods of low carb intake, in periods of fasting for religious or medical tests, and during periods of prolonged intense exercise. This state is called ketosis. It is normal and natural and something everyone’s body does when using fat as its main fuel source.
Once our glycogen levels are used up, fat is broken down for energy and ketone bodies are a byproduct of that. These ketones enter into the mitochondria of the cell and are used to generate energy (as ATP) to fuel our cells.
Ketosis is a normal, physiological state and we may produce ketones after sleeping all night, if we haven’t gotten up and eating something in the middle of the night.
Ketoacidosis on the other hand is a serious medical state that can occur inuntreated or inadequately treated Type 1 Diabetics, where the beta cells of the pancreas don’t produce insulin. It may also occur in those with Type 2 Diabetes who decrease their insulin too quickly or who are taking other kinds of medication to control their blood sugars.
In inadequate management of Type 1 Diabetes or in insulin-dependent Type 2 Diabetes, ketones production will be the first stage in ketoacidosis. This is not the case when the above medical issues are not present.
Final Thoughts…
There are a wide range of low-carb diets with various levels of carbohydrate, protein and fat. Some are high in meat, others low in meat, while others have no meat at all. Some are very high in protein and others are very high in fat. Some promote weight loss, others make it very difficult. There are different types of low carb diets because they are used for different purposes.
Each person’s requirement for protein is different, so following a generic “low carb diet” downloaded from the internet will be based on an ‘average’ amount of protein for adults and not your needs . The amount of fat you will be encourage to eat will be based around the protein needs that are set by the web page. If you are wanting to lose weight, very often you may find that you lose a bit at first and then weight plateaus for extended periods of time. Many of my clients come to me after trying this approach, feeling that a “low carb diet doesn’t work for me”. The issue very often is that the plan wasn’t designed for “them” at all.
Most general types of “low carb diets or plans” allow people to select the level of carbohydrate they want to limit. Often, people will choose a ketogenic level because they want to lose weight quickly, with little regard for making sure they are getting sufficient nutrients.
For otherwise healthy young adults with no major risk factors and who are not taking any medications, this might work out fine however for adults with medical or metabolic conditions – and especially for those taking medications for Diabetes or high blood pressure, this can put them at significant risk. As outlined in more detail in a previous article, medical supervision is absolutely required before a person changes the level of their carbohydrate intake if they are taking;
(1) insulin
(2) medication to lower blood glucose such as sodium glucose co-transporter 2 (SGLT2) medication including Invokana, Forxiga, Xigduo, Jardiance, etc.
(3) medication for blood pressure such as Ramipril, Lasix (furosemide), Lisinopril / ACE inhibitors, Atenolol / βâ‚ receptor antagonists
or
(4) mental health medication such as antidepressants, medication for anxiety disorder, and mood stabilizers for bipolar disorder and schizophrenia.
For everyone who does not fall into the above category, it’s important to realize that there is a very big difference between a generic meal plan downloaded from a “low-carb” website and one designed just for you, based on your physiological needs and ensuring that you get adequate nutrients based on your own medical history and family risk factors. For a low-carb style diet to provide the nutrients that you need for your age, gender and activity level, it needs to be designed for you; factoring in your need for specific nutrients. It’s not simply a matter of choosing a level of “macronutrients” (“macros”) such as carbohydrate, fat and protein, but ensuring adequate “micronutrients”, too. That is the difference between having an Individual Meal Plan designed specifically for you by a knowledgable Registered Dietitian and one that is based on general cutoff points.
For this to be a way of eating that is balanced in terms of overall nutrients and will meet specific health goals and which is healthy and interesting enough to be sustainable over the long term, it needs to be carefully designed for each individual.
Do you have questions about how I can help design a Meal Plan for you? Or for you and your partner?
Please send me a note using the Contact Me form located on the tab above and I will reply shortly.
LEGAL NOTICE: The contents of this blog, including text, images and cited statistics as well as all other material contained here (the ”content”) are for information purposes only. The content is not intended to be a substitute for professional advice, medical diagnosis and/or treatment and is not suitable for self-administration without the knowledge of your physician and regular monitoring by your physician. Do not disregard medical advice and always consult your physician with any questions you may have regarding a medical condition or before implementing anything you have read or heard in our content.
This article is based on a lecture given by Gabor Erdosi, MSc, MBA— Food News Conference, May 19, 2018 — Prague, Czech Republic
Introduction — Gabor Erdosi, MSc, MBA is a Molecular Biologist from Debrecen, Hungary who is employed in the Food Industry but whose hobby is reading scientific publications and analyzing the available information. The talk that this article is based on was given at the Food News Conference, May 19, 2018 — Prague, Czech Republic and is the condensation of approximately 4 years worth of Gabor’s studying of the literature.
Gabor founded and heads up the Lower Insulin group on Facebook which is dedicated to discussing the scientific basis of the relationship between metabolic diseases and food and lifestyle factors. At present, the group has ~5300 members.
This new series titled The Perils of Food Processing reflects Gabor’s conviction that what’s of primary importance in the interaction between food and our physiology (GI tract) is the speed and location of food absorption in the digestive system. This article is arranged according to the same principle.
The reason I am writing this series of articles is because I believe what Gabor Erdosi has come to understand about the effects of food processing on the speed and location of food absorption — especially carbohydrate, and which affects the very nature of hunger and satiety is absolutely crucial to understanding the current epidemic of metabolic diseases we now face.
This first article provides an overview of the gastrointestinal system and the so-called “incretin hormones” and how the amount a food is cooked or ground impacts how quickly it is absorbed and the energy stored.
When talking about Food Processing, the issue arises as to how to properly define the concept of processing’.
How do we define ‘food processing’? Humans have been processing their food in one way or another for hundreds of thousands of years — be it cutting, cooking or grinding their food in some way. These are all forms of food processing.
In terms of the effect of Food Processing on human physiology, a few main questions that this series of articles will address, arise;
(i) are all forms of food processing created equal?
(ii) does the food processing of different macronutrients and foods have different results?
(iii) could these changes in food processing over the last few hundred years or so have anything to do with the epidemic of metabolic diseases that we now face?
1. Overview of Gastrointestinal Physiology
Before getting into the topic of the effect of different types of food processing on the speed and place of absorption, it’s necessary to provide an overview of the gastrointestinal physiology and how the digestive system works and what hormones are released in response to different nutrients.
The important concept here is that we have ”sensor cells” (K-cells, L-cells) within our gastrointestinal tract and these cells release different hormones in response to different nutrients.
K-cells release an incretin hormone called GIP and the L-cells release an incretin hormone called GLP-1, as well as GLP-2, PYY and Oxyntomodulin (OXM).
What is important to note is that the distribution of these cells is not uniform.
The K-cells are more abundant in the upper part of the small intestine and other cells, the L-cells are more abundant in the lower part of the small intestine. This uneven distribution of these incretin-hormone-releasing sensor-cells has profound implications, as will be seen later.
Uneven distribution of the K-cells and L-cells in the small intestine – Gabor Erdosi – Food News 2018
2. Nutrient Sensing, the Incretin Effect and Hunger-Satiety Signalling in the Gut
Nutrient-Sensing
So, what happens when we eat foods that we have evolved to see for millennia? As the food goes through the small intestine, it triggers hormonal release from these incretin-hormone-releasing sensor-cells.
If you eat meat and berries, for example, which are foods we have evolved to see for hundreds of thousands of years, they have a fairly balanced stimulatory effect on these sensor cells. These incretin hormones will be released in a more or less balanced manner.
However, as will be shown later on, when we eat food products that we have not evolved to see — relatively new food products on an evolutionary scale, these patterns are completely disrupted.
There are several nutrient-sensing hormones in the small intestine, but the one to focus on with respect to the effect of food processing is SGLT1 – which is a glucose sensor. Both the K-cells and the L-cells contain this nutrient-sensing receptor, and most others, as well.
Keep in mind for the next articles that the distribution of these cells is uneven; with more in the K-cells higher up in the small intestine and increasing numbers further down in the L-cells.
The Incretin Effect
When we eat glucose, such as in an oral glucose tolerance test or when someone gets intravenous glucose in a hospital, the difference in the insulin response is called the ”incretin effect”.
As you can see from the diagram below, the response to an oral or intravenous glucose load is very large and can be 50-70% of the insulin response.
The “Incretin Effect” to oral or intravenous glucose – Gabor Erdosi – Food News 2018
The majority of the insulin response is stimulated by these incretin hormones (GIP, GLP-1, etc.) secreted by the K-cells and L-cells and not directly via glucose.
The Physiological Effects of the Incretin Hormones
In addition to the insulin-stimulating effect, these incretin hormones have very different effects.
The K-cells, which are more abundant in the upper small intestine, secretes Glucose-dependent Insulinotropic Polypeptide (GIP) which acts on the pancreas — not only to result in insulin release, but also increase glucagon. At the level of the fat cells, the adipose tissue, it increases increases triglyceride storage, resulting in weight gain. In this way, GIP supports insulin’s effect on storing lipids. This is an anabolic-type of hormone and if it is very high, it can cause inflammation in adipose tissue.
The L-cells, which are more abundant in the lower small intestine, secrete Glucagon-like Peptide-1 (GLP-1) which also acts on the pancreas to increase insulin, but decreases glucagon. This GLP-1 at the level of the brain, acts to decrease appetite, increase satiety (feeling full) and decrease food intake.
Hunger-Satiety Signalling in the Gut
Effects of Intestinal hormones on hunger-satiety signaling – Garbor Erdosi – Food Net 2018
It is important to note that there is only one hormone that can increase hunger and that is ghrelin which is synthesized in the stomach.
All the other hormones, including CCK, PP, PYY, GLP-1 and OXM (Oxyntomodulin) decrease hunger. That is, all of these hormones promote satiety; the feeling of being full’. It is very important to note that four of these hormones, CCK, PYY, GLP-1 and OXM are all synthesized in the small intestine L-cells.
The above is the all the basic physiology that is needed to understand the effects of food processing on the speed and location of nutrient absorption, the nature of hunger and satiety and how the current epidemic in metabolic diseases we now face is a result of disregulation of this system.
3 a. The Effect of Cooking Foods on Body Weight
One of the most ancient forms of food processing is cooking, and there are studies which indicate that there is an association between how many raw foods people eat and their body weight. There is a generally tendency that the more raw foods a person eats, the lower their body weight. That does not mean that eating a vegetarian diet is more desirable, it is only to point out that with more and more processing — in this case, cooking, the higher body mass tends to be.
The Effect of Cooking Foods on Body Weight – Gabor Erdosi Food News 2018
3b. The Effect of Cooking Foods on Nutrient Availability
Carbohydrate-rich Foods
The relationship between cooking foods and body weight is particularly important with respect to carbohydrate-rich foods. For example, when grains are cooked they become much more digestible — meaning that more of the nutrients in the grain is available to be absorbed. In the case of potatoes, there is double or triple the amount of energy (calories) available to the body when they are cooked versus when they are raw. When a potato is cooked, the digestible starch increases 2-3 times, which means that these calories are now available to the body where they weren’t when they were raw.
The Effect of Cooking Carbohydrate on Nutrient Availability – Gabor Erdosi – Food News 2018
Lipid and Protein-rich Foods
The Effect of Cooking Lipid (fat) and Protein-rich Foods on Nutrient Availability – Gabor Erdosi Food News 2018
When foods that are high in lipids (fats) such as peanuts are cooked, the amount of energy the body is able to derive from the food, increases. As well, significantly more amino acids in protein-rich foods such as egg make it to the large intestine (where their nutrients are absorbed) when the protein-rich food is cooked.
3c. The Effect of Non-Thermal Food Processing on Nutrient Availability
Mechanical processing, such pounding food is also an ancient form of food processing which has an effect on how many nutrients are available to be digested. The nutrients available to the body when food is eaten raw and whole versus raw and pounded is significant, and this holds true whether the food is animal protein such as meat or a starchy vegetable such as sweet potato.
In a study with mice, one group of mice was fed meat either raw and whole or raw and pounded and then the group was crossed over to cooked and whole or cooked and pounded. The other group of mice was fed sweet potato eaten raw and whole or raw and pounded and then crossed over to cooked and whole or cooked and pounded.
When the meat or starchy vegetable (sweet potato) was eaten raw and whole, it was associated with lower body mass than the same foods eaten raw and pounded because the mice lost weight. As expected from what is known about the effect of cooking on nutrient availability (see above), when the mice ate the cooked meat or cooked sweet potatoes, they either didn’t lose as much weight (in the case of the meat) or actually gained weight (in the case of the sweet potato).
The conclusion of this study was worth noting;
”Our results indicate that human dieters who count calories and eat similar mixed diets but cook them to different extents would experience different weight gain outcomes at comparable levels of physical activity. This prediction is consistent with recent long-term data indicating that preparation-specific factors affect the relationship between caloric consumption and weight gain in humans.”
3 d. The Effect of Hydrolyzing Protein on Hormonal Response in the Small Intestine
Hydrolyzed protein, is essentially pre-digested protein and this process has an impact on which hormones are released in the small intestine when it is eaten.
In a 2010 study, comparing soy protein with soy protein hydrolysates and whey protein with whey protein hydrolysates, it was found that significantly more insulin compared to glucagon is released with the hydrolysates versus the intact protein. This means that the insulin to glucagon ratio is higher and insulin is the hormone which signals the body to store energy. A higher insulin to glucagon ratio means that the body is storing energy rather than responding to glucagon which signals the body to use glucose and fat for energy.
4 a. The Effect of Mechanical Processing on the Blood Glucose Response of a Carbohydrate Food
Grinding / Juicing Fruit
Mechanical processing of a food doesn’t change the amount of carbohydrate that is in it. That is, when we compare 60g of whole apple with 60 g of pureed apple or 60g of juiced apple, there is the same amount of carbohydrate each. When we compare the Glycemic Index of these three, the results are very similar so this isn’t very helpful to tell us about the blood glucose response to actually eating these different foods.
When these foods are eaten, the blood glucose response 90 minutes later, is significantly different.
Note: It’s not relevant to the outcome, but on this graph, slow and quick puree and juice as just differences in the amount of time it took for the liquid to be drunk.
The Effect of Mechanical Processing of Fruit on Blood Glucose Response – Gabor Erdosi – Food News 2018
As can be seen by the graph on the right, in healthy individuals blood insulin level goes very high with the juiced apple and in response, blood glucose then goes very low, below baseline.
The response that we see with the juiced apple is typical of what is seen with ultra-processed carbohydrates.
Grinding Grains
Grinding grains is another type of ancient food processing which changes the hormonal response in the small intestine.
The Effect of Mechanical Processing of Wheat on Blood Glucose Response – Gabor Erdosi – Food News 2018
When healthy individuals eat grain-based meals, the plasma insulin response increases the smaller the particle size of the grain. That is, a specific amount of whole grain releases less insulin than the same amount of cracked grains, which is less than the same amount of course flour. The highest amount of insulin is released in response to eating the same amount of fine flour.
What was true for wheat in this study was true for rice as well and what was of interest, is there wasn’t a big difference between the insulin response with brown rice versus white rice.
The Effect of Mechanical Processing of Rice on Blood Glucose Response – Gabor Erdosi – Food News 2018
There is no difference in the Glycemic Index or Glycemic Load of whole wheat versus ground wheat or whole rice versus ground rice, but there is a huge difference in the insulin response with difference types of mechanical processing.
It’s also important to note that the amount of fiber that was in the grain did not make a difference in the amount of insulin released, only the amount of mechanical processing of the grain. So, eating brown rice versus white rice won’t change the amount of insulin that is released – and insulin is a hormone that signals the body to store energy (calories).
In this next study, the same response that we saw with the pureed and juiced apples (above) is also seen with finely ground wheat bread. We see plasma glucose rise rapidly and then it drops below baseline at 120 minutes (circled).
Plasma glucose rises rapidly with bread made with wheat flour, then drops below baseline at 120 minutes
We know that the difference wasn’t due to the amount of fiber, because in this study they added back the fiber and it didn’t make a difference.
The difference had to do with the amount of disruption to the structure of the grain. So, eating whole wheat bread versus eating white bread — which is just adding the fiber that was taken out back won’t help much in terms of the insulin response.
The disruption of the structure of the grain had very adverse effects on the hormonal response; both the insulin response and GIP response, which can be seen in the next graph;
Disruption to structure of grain has adverse effect on insulin response and GIP response – Gabor Erdosi – Food News 2018
The bread made with flour resulted in a much larger insulin response and plasma GIP response than those made with whole kernel grains
Recall from the first article in this series, that GIP is released from the K-cells, which are dominant in the upper part of the small intestine. Bread made from ground flour results in a much greater and earlier hormonal response than bread made from whole grains.
The same researchers did another study a year later, this time with wheat bread, rye bread with the endosperm, traditional rye bread and high-fiber rye bread. As can be seen from these graphs (whether wheat or rye bread), it is the structural difference of the bread that explains the insulin response after a meal, not the total amount of fiber.
Note: Gabor Erdosi made a table comparing the Area Under the Curve (AUC) of the hormonal response of GIP (from the K-cells in the upper part of the small intestine) and GIP-1 (from the L-cells in the lower part of the small intestines) for the different breads which was very telling.
Area Under the Curve (AUC) of the hormonal response of GIP and GIP-1 for the different breads – Gabor Erdosi – Food News 2018
As can be seen from this table, there was almost double the GIP/GLP-1 ratio in the refined wheat bread (5.02) than the traditional rye bread (2.75) and this difference was largely due to significantly more GIP being released from the K-cells high up in the small intestine with the refined wheat bread than with the traditional rye bread.
It wasn’t due to fiber, because there was less GIP released with the traditional rye bread than even with the high fiber rye bread.
4 b. In-Vitro Hydrolysis of Starch Highly Correlates to Starch Digestion in the Small Intestine
This study shows a striking ability to predict how starch is hydrolyzed (broken down) in the small intestine with how it is broken down in a petri-dish in a lab using alpha-amylase. A perfect correlation would be = 1 and in this case it is 0.95.
Glycemic Response and Insulin Response to Starch Hydrolysis in-vitro and In-vivo – Gabor Erdosi – Food News 2018
As can be seen from these graphs, the glycemic response (blood sugar response) and the insulin response in the body can be accurately predicted using this method.
In this article we considered the effect of various kinds of food processing’ on the speed and location of food absorption of individual macronutrients (such as protein, fat and carbohydrate), but we rarely eat meals that are only carbohydrate, or only protein or only fat.
How does the presence of protein and fat-rich foods influence the hormonal response in the small intestine and how do these affect the hormonal response to carbohydrate? How does fiber content or addition of fiber affect the hormonal response, or does it? These will be the topic of the next article where we’ll look at the hormonal response of the body to mixed meals (meals with different combinations of fat, protein and carbohydrate.
Perhaps you wonder what all this information means for you.
Maybe, like many you’ve become metabolically unwell with Type 2 Diabetes or high blood pressure or high cholesterol despite eating a diet rich in whole wheat bread, whole grain rice and lots of cooked vegetables and are beginning to realize that how your food is processed is as important a factor as the nutrients it contains in it’s unprocessed form.
I can help.
Feel free to send me a note using the “Contact Me” form located on the tab above to find out information about the services I offer, both in-person in my office or via Distance Consultation (using telephone or Skype).
Gribble, Fiona M., and Frank Reimann. ”Enteroendocrine Cells: Chemosensors in the Intestinal Epithelium.” Annual Review of Physiology 78, no. 1 (2016): 277—99.
Reimann, Frank, and Fiona M Gribble. ”Mechanisms Underlying Glucose-Dependent Insulinotropic Polypeptide and Glucagon-like Peptide-1 Secretion.” Journal of Diabetes Investigation 7 (2016): 13—19.
Nauck, Michael A., and Juris J. Meier. ”Incretin Hormones: Their Role in Health and Disease.” Diabetes, Obesity and Metabolism 20 (2018): 5—21.
Perry, B., and Y. Wang. ”Appetite Regulation and Weight Control: The Role of Gut Hormones.” Nutrition & Diabetes 2, no. 1 (January 2012): e26.
Groopman, Emily E., Rachel N. Carmody, and Richard W. Wrangham. ”Cooking Increases Net Energy Gain from a Lipid-Rich Food.” American Journal of Physical Anthropology 156, no. 1 (2015): 11—18.
Evenepoel, Pieter, Dirk Claus, Benny Geypens, Martin Hiele, Karen Geboes, Paul Rutgeerts, and Yvo Ghoos. ”Amount and Fate of Egg Protein Escaping Assimilation in the Small Intestine of Humans.”
American Journal of Physiology-Gastrointestinal and Liver Physiology 277, no. 5 (November 1999): G935—43.
Carmody, R. N., G. S. Weintraub, and R. W. Wrangham. ”Energetic Consequences of Thermal and Nonthermal Food Processing.” Proceedings of the National Academy of Sciences 108, no. 48 (2011):
19199—203.
Morifuji, Masashi, Mihoko Ishizaka, Seigo Baba, Kumiko Fukuda, Hitoshi Matsumoto, Jinichiro Koga, Minoru Kanegae, and Mitsuru Higuchi. ”Comparison of Different Sources and Degrees of Hydrolysis of
Dietary Protein: Effect on Plasma Amino Acids, Dipeptides, and Insulin Responses in Human Subjects.” Journal of Agricultural and Food Chemistry 58, no. 15 (August 11, 2010): 8788—97.
Haber, G.B., K.W. Heaton, D. Murphy, and L.F. Burroughs. ”Depletion and Disruption of Dietary Fiber” The Lancet 310, no. 8040 (1977): 679—82.
Heaton, K.W., S.N. Marcus, P.M. Emmett, and C.H. Bolton. ”Particle Size of Wheat, Maize, and Oat Test Meals: Effects on Plasma Glucose and Insulin Responses and on the Rate of Starch Digestion in Vitro” 47,no. 4 (1988): 675—82.
O’Dea, K., Nestel, P.J., and Antonoff, L. ”Physical Factors Influencing Postprandial Glucose and Insulin Responses to Starch” 33, no. 4 (April 1, 1980): 760—65.
Juntunen, Katri S., Leo K. Niskanen, Kirsi H. Liukkonen, Kaisa S. Poutanen, Jens J. Holst, and Hannu M. Mykkí¤nen. ”Postprandial Glucose, Insulin, and Incretin Responses to Grain Products in Healthy Subjects.”The American Journal of Clinical Nutrition 75, no. 2 (2002): 254—262.
Juntunen, K.S., D.E. Laaksonen, Leo K Niskanen Karin Autio Jens J Holst, Kari E Savolainen, Kirsi-Helena Liukkonen, Kaisa S Poutanen, and Mykkí¤nen, H.M. ”Structural Differences between Rye and Wheat Breadsbut Not Total Fiber Content May Explain the Lower Postprandial Insulin Response to Rye Bread” 78, no. 5(2003): 957—64.
Bornet, F R, A M Fontvieille, S Rizkalla, P Colonna, A Blayo, C Mercier, and G Slama. ”Insulin and Glycemic Responses in Healthy Humans to Native Starches Processed in Different Ways: Correlation with in Vitro Alpha-Amylase Hydrolysis.” The American Journal of Clinical Nutrition 50, no. 2 (1989): 315—23.
LEGAL NOTICE: The contents of this blog, including text, images and cited statistics as well as all other material contained here (the ”content”) are for information purposes only. The content is not intended to be a substitute for professional advice, medical diagnosis and/or treatment and is not suitable for self-administration without the knowledge of your physician and regular monitoring by your physician. Do not disregard medical advice and always consult your physician with any questions you may have regarding a medical condition or before implementing anything you have read or heard in our content.
Three years ago, my theory about the roots of the current obesity and Diabetes epidemic was simple. I believed that it was largely a matter of us eating too many carbs while having reduced the amount of healthy fat we ate. I now think it is a little more subtle than that, and that it is specifically the combination of a diet too high in refined carbs while high in industrial seed oils (such as soybean and canola oil) that underlies the issue.
When I first started reading and writing about the current obesity and Diabetes epidemic, my thoughts were summarized in two articles written in May and June of 2015. In the first article, I documented how in 1970-72 only 6% of men and 11.7% of women were considered obese (Body Mass Index > 30) in Canada, but by 2013 obesity in men had tripled to 20.1% in men and to 17.4% in women. In the second article, I explained how the changes in the obesity rates coincided with the changes in the Dietary Recommendations that began in 1977 and continued in 1982, 1992 and 2005 and which encouraged people to eat considerably more carbs and a lot less fat coincided with the increased obesity rates, and that the increasing rates of Type 2 Diabetes (9.4% in 2014 in Canada) was just a natural outworking of the higher obesity rates.
The problem was, I really didn’t know of any specific mechanisms that related one to the other.
Now I know of several.
This article summarizes my current theory of obesity, as it relates to previous articles and a brand new study published last week.
Correlation is not Causation
There’s an expression in science is that “correlation is not causation”.
That is, the fact that a dramatic increase in obesity rates correlates (or coincides) with the changes in the Dietary Recommendations doesn’t mean that the Dietary Recommendations ’caused’ the obesity epidemic or the Diabetes epidemic.
One can hypothesize that there is a relationship between these two things, but without some understanding of the mechanism and more data, we don’t know what this relationship might be.
From the reading I have been doing the last number of years, I have some ideas of some of what may be involved.
Evolution of the Theory
A presentation at a conference at the beginning of March (documented in two previous articles) got me thinking that the picture was bigger than just “too many carbs” and a “decrease in the satiety effect of saturated fat” from full fat milk, cheese and butter. I was challenged by the fact that in the late 1960s and early 1970s, people in the US and Canada were generally slim, despite eating carbohydrates at just about every meal;
“They ate cereal or toast for breakfast and just about every household had a toaster. Lunch was often sandwiches, as there were no microwaves to heat food up in. Potatoes were a mainstay at dinner, sometimes pasta — yet the majority of young adults and adults were slim. Of course there were always some people that were overweight. Most elementary school classes had one chubby’ kid, but when one looks around the classes of today or on public transit or in stores and supermarkets, most people are considerably heavier than people in the 1950’s and 1960’s”
The question was raised ‘what resulted in overweight and obesity all of a sudden exploding in the 1970’s and just keep rising?’
What changed?
We knew that (based on US data) people began eating ~240 calories a day more as carbohydrate but what was causing them to do this? Was it just because the Dietary Recommendations were encouraging us to eat more carbohydrate or was there something else going on?
Not More Fat but the Type of Fat
While people were eating more carbohydrate, neither people in Canada nor the US were eating more fat, but the type of fat we’ve been eating since the 1970s has changed substantially. This tweaked my interest.
We’d reduced our intake of saturated fat (because the “Diet-Heart Hypothesis” had told us they were the “cause of cardiovascular disease”) and we dutifully ate more and more of ‘polyunsaturated fats’ / vegetable oils which as I wrote about previously are more appropriately called “industrial seed oils”. These oils, including soybean, corn oil and canola oil contain high amounts of linoleic acid which is at the very top of the omega 6 (n-6) pathway and these fats which elongate to arachidonic acid are pro-inflammatory products in nature.
There is nothing inherently ‘bad’ about linoleic acid which is found naturally in nuts and seed oils, including walnut, macadamia and sesame oil, but it is the sheer amount of these industrial seed oils which suddenly became excessive in our diet, which I think may be a significant factor. These fats are in our bread, pastries, salad dressing, margarine and even our peanut butter. Canned fish is packed in it, our mayonnaise is made from it and everything we eat that is fried from a restaurant is bathed in these industrial seed oils. On top of that, many of us use it our own homes to cook with.
So many of the foods we now eat are prepared with soybean or canola oil and as a result, we consume a much greater amount of linoleic acid than our body ever evolved to handle.
As outline in previous articles, these oils are much more unstable than the saturated fats they were created to replace. What I mean by ‘unstable’ is that they are more easily oxidized – that is, when industrial seed oils are heated in the making of commercial foods using them or in cooking, they react with oxygen in the air to form toxic substances including aldehydes and lipid peroxides. When these oils are heated, they produce oxidized metabolites which have been also been implicated in the development of a variety of conditions, including non-alcoholic fatty liver disease (NAFLD), cardiovascular disease and cancer and it has been proposed that inflammation is involved in the development of Type 2 Diabetes and metabolic syndrome, as well.
Also as written about previously, cardiolipin is an important component of the inner membrane of the mitochondria (the so-called “powerhouse of the cell”) and the fats that make up cardiolepin change, depending on the types of fats in the diet. That is, the fatty acid composition of cardiolepin is altered by us eating a diet high in linoleic acid, such as soybean and canola oil. This past week a study about cardiolepin was published that added a very interesting piece to my evolving theory of the obesity and Type 2 Diabetes epidemic.
In this new study, researchers at the University of Copenhagen found that when large amounts of cardiolipin are produced in ‘brown fat’ cell mitochondria, there is much stronger calorie-burning. Conversely, when there are low amounts of cardiolepin in brown fat, there is much less calorie-burning. Low amounts of cardiolepin and less calorie-burning in brown fat was reported to be associated with obesity and Type 2 Diabetes [1].
Note: “Brown fat” is a specialized type of fat that burns fat, rather than stores it and cardiolepin acts like a kind of on-off switch for the activity in our brown fat.
This study got me thinking that since it is known that the fatty acid composition of cardiolepin changes according to the fatty acid composition of the diet (covered in previous blogs), what effect has the massive increase in linoleic acid intake in the diet in both Canada and the US had on the function of the cardiolipin?
Could it be that a shift in the types of fats that make up cardiolepin in brown fat stemming from a very high linoleic acid intake from industrial seed oils has had a similar effect as an absolute decrease in cardiolepin – and that this is somehow related to the increase in obesity and Type 2 Diabetes?
Type of Fats and Refined Carbohydrates
My theory of obesity has evolved and will likely continue to evolve. I don’t think that increased carbohydrate consumption based on changes in the Dietary Recommendations in the late 1970s / early 1980s in and by itself resulted in the obesity epidemic and huge increase in Type 2 Diabetes we see now.
I currently believe that the introduction of these manufactured industrial seed oils (soybean, canola, corn) that were created in the 1970s and meant to replace saturated fat in the diet (presumably to protect people from heart disease!) may be part of the initiation of the disease process.
As documented in earlier articles, we know that these fats are easily oxidized, have a direct impact on increasing inflammation and triggering the disease generation process in several health conditions and on acting on the endo-cannibinoid receptors in the body, in much the same way as cannabis (marijuana). Could it be that these created oils that are very high in the average Western diet actually lead people to consuming more and more carbohydrate-based foods; foods that often comes liberally bathed in more industrial seed oils?
The mechanism of how the above might work was presented in an earlier article and had to do with how energy is generated in the electron transport chain of the mitochondria being different for saturated fats and unsaturated fats.
There are several possible mechanisms that may link consumption of these novel fats to obesity and development of Type 2 Diabetes (oxidation, inflammation, food cravings) and now based on this new study, the possibility of an increase in linoleic acid content in cardiolepin and it’s effect on fat burning.
It will take years more research before we have a fuller picture, so what do we do in the meantime?
Sensible Recommendations based on the Current Knowledge
For someone who is metabolically healthy (i.e. does not have Type 2 Diabetes or Insulin Resistance, hypertension or high cholesterol), it would seem that a whole-foods approach combined with avoiding omega – 6 industrial seed oils such as soybean, canola and corn oil combined with being mindful of the amount and type of carbohydrate in the diet may be sufficient to avoid developing these chronic diseases. Such a scenario would not be unlike the diet of the average American or Canadian in the 1950s and 60s. Not that that diet was that healthy, when compared with a classic Mediterranean diet, Japanese or Okinawan-style diet, or a whole food low-carbohydrate diet. These, it would seem offer a much healthier alternative.
For those who are already are insulin resistant or been diagnosed with Type 2 Diabetes, avoiding industrial seed oils would prudent and eating naturally-obtained vegetable fats such as olive oil or avocado oil instead. Since it does not seem that studies clearly support that saturated fat causes heart disease and not simply increase in surrogate markers of heart disease such as higher LDL (which LDL subfraction?), it would seem that using modest quantities of real butter is preferable to eating margarine made from industrial seed oils. It would also seem that at least initially, eating a diet where the amount and type of carbohydrate is kept to a quantity that does not trigger large amounts of insulin release or spike blood glucose makes good sense. As I wrote about recently, with the availability of Continuous Glucose Monitoring (CGM), this approach can be tailored to each individual person’s response to specific foods. We are no longer reliant on Glycemic Index or Glycemic Load, which are derived from healthy people’s response to foods, not those with Type 2 Diabetes. A suitable diet could be expressed as a variety of different lifestyles (just as for the healthy individual) including a Mediterranean diet, Okinawan-style diet, or whole food low-carbohydrate diet – with carbohydrate levels tailored on an individual basis, based on glycemic response and insulin levels.
Whether a person is healthy or metabolically unwell, based on the studies I have read and some of the mechanisms that have come to light, I can see no benefit in people eating either industrial seed oils or refined, processed carbohydrates. There is every reason to believe that both of these may have been part of the underlying cause of the current obesity and Type 2 Diabetes epidemic.
Unrefined Carbohydrates and Healthy Fats
If someone is metabolically healthy, I recommend eating minimally processed carbohydrates as they reduce the ‘incretin effect’ of hormones such as GIP, GLP-1 and GLP-2 that are released in the intestine and trigger the release of insulin from the pancreas beta-cells. Eating minimally processed carbs would result in less triggering of the release of insulin, thus reducing the likelihood of developing either insulin resistance or Type 2 Diabetes.
If someone is already insulin resistant or has Type 2 Diabetes, it seems from recent studies that minimizing carbohydrate initially, along with weight loss and some forms of activity may be at least as good if not more beneficial than a low-fat calorie-restricted diet. Certainly, many people find they are a lot less hungry eating a low carbohydrate whole foods diet and are easily able to stick with it long term (a year or two in studies), allowing for a period of improving insulin sensitivity and lower overall blood sugar levels. It certainly has been demonstrated to be safe and effective in periods up to two years.
For both those that are metabolically healthy or insulin resistant or have Type 2 Diabetes, avoiding industrial seed oils makes good sense, for all the reasons outlined above.
What about your specific situation?
Do you have questions about the type and amount of carbohydrates that are most suitable for you based on your health and family history? What about which fats are are the best choices given your lifestyle?
I can help.
Please feel free to send me a note using the “Contact Me” form located on the tab above to find out how I can support your needs and I will reply as soon as possible. Remember, I provide both in-person services and am experienced providing services via Distance Consultation (telephone or Skype).
Sustarsic EG, Ma T, Lynes MD et al, Cardiolipin Synthesis in Brown and Beige Fat Mitochondria Is Essential for Systemic Energy Homeostasis,
Cell Metabolism (2018), https://doi.org/10.1016/j.cmet.2018.05.003
LEGAL NOTICE: The contents of this blog, including text, images and cited statistics as well as all other material contained here (the ”content”) are for information purposes only. The content is not intended to be a substitute for professional advice, medical diagnosis and/or treatment and is not suitable for self-administration without the knowledge of your physician and regular monitoring by your physician. Do not disregard medical advice and always consult your physician with any questions you may have regarding a medical condition or before implementing anything you have read or heard in our content.


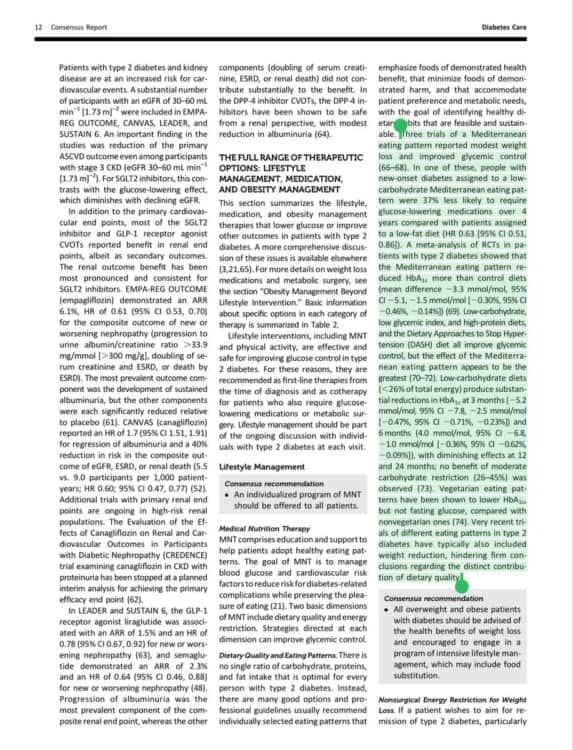
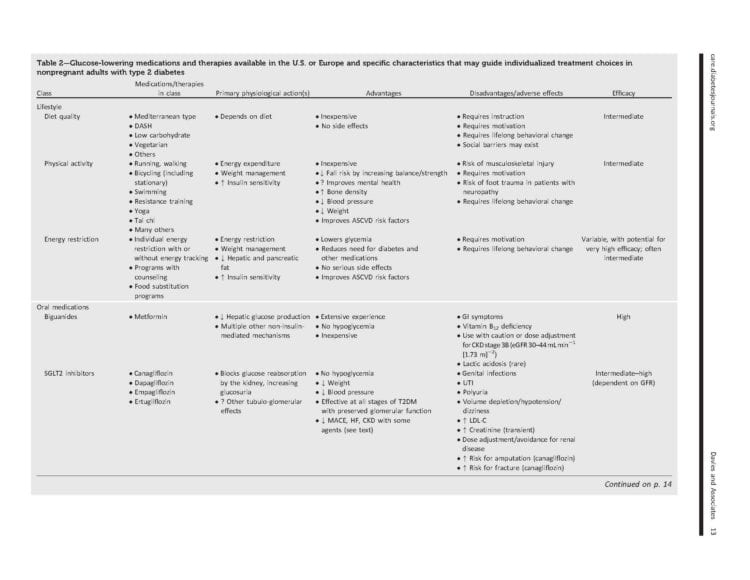
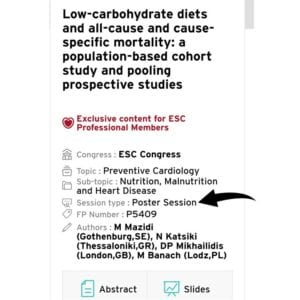 and also published the same day (August 28, 2018) in the European Heart Journal, Volume 39 Supplemental on pages 1112-1113.