A pre-publication of the long-awaited 2 year update from the Virta Health study has just been released[1] and indicates that there were improvements in body weight while following a ketogenic diet the first year which were largely sustained into the second year, with some minor rebound. Improved blood sugar control was also largely sustained and that significant metabolic markers and health improvements occurred using a ketogenic approach over the usual care model approach.
This article briefly outlines the study and baseline data and compares the newly-released two-year data to the one-year data, as well as comparing the 2 year data using a ketogenic diet to the data from the “usual care” control group.
Baseline Details
There were 238 participants enrolled in the continuous care intervention at the beginning of the study and all had a diagnosis of Type 2 Diabetes (T2D) when the study began with an average HbA1c of 7.6% ±1.5%. Participants ranged in age from 46 — 62 years of age (mean age = 54 years). Sixty-seven (67%) of participants were women and 33% were men.
Weight ranged from 200 pounds to 314 pounds (117±26 kg), with an average weight of 257 pounds (117 kg). Average Body Mass Index (BMI) was 41 kg·m-2 (class III obesity) ±9 kg·m-2, with 82% categorized as obese.
The majority of participants (87%) were taking at least 1 glycemic (blood sugar) control medication at the beginning of the study.
Intervention
Each participant in the continuous care group received an Individualized Meal Plan for nutritional ketosis, behavioral and social support, bio-marker tracking tools and ongoing care from a health coach with medication management by a physician.
Subjects typically required <30 g per day of total dietary carbohydrate. Daily protein intake was targeted to a level of 1.5 g / kg based on ideal body weight and participants were coached to incorporate dietary fats until they were no longer hungry (satiety). Other aspects of the diet were individually tailored to ensure safety, effectiveness and satisfaction, including consumption of 3-5 servings of non-starchy vegetables and enough mineral and fluid intake. Use of time restricted eating or intermittent fasting by subjects was not mentioned. The blood ketone level of β-hydroxybutyrate (BHB) was monitored using a portable, handheld device.
Participants
There were 238 participants enrolled in the continuous care intervention at the beginning of the study. At the end of a year, 218 participants (83%) were still enrolled in the continuous care intervention group. At the end of two years, 194 participants (74%) remained enrolled in the continuous care intervention group.
There were no reported serious adverse events between one and two years in this study that were attributed to the dietary intervention or that resulted in the need to discontinue participation in the study; including no reported episodes of ketoacidosis or severe hypoglycemia requiring assistance.
Medication Use
At baseline, 87% of participants were taking at least one medication for Diabetes, with ~56% (55.7%) taking Diabetes medications excluding Metfomin. After one year, Type 2 Diabetes medication prescriptions other than Metformin declined from 56% to just below 30%. At two years, Type 2 Diabetes medication prescriptions other than Metformin declined to 27% (26.8%).
Insulin therapy at baseline was 30% (29.8%) and at two-years was 11.3%. Use of sulfonylureas was 23.7% at baseline and was entirely eliminated in the continuous care intervention group at one-years and remained at 0% at two-years.
No changes in use of any Diabetes medication (excluding Metformin) or individual diabetes medication classes were observed in the usual care control group from baseline to 2 years.
Glycosylated Hemoglobin (HbA1C)
At baseline, the average HbA1c level of the intervention group was 7.7%, with less than 20% of participants having a HbA1c level of <6.5% (with medication usage). On average after one year, participants in the intervention group lowered HbA1c from 7.7% to 6.3%. At two years, HbA1C of participants in the intervention group increased to 6.7%.
By comparison, HbA1C of the usual care control group was 7.5% at baseline, 7.6% at one-year and 7.9% at two years.
Fasting Blood Glucose
At baseline, fasting blood glucose of the intervention group was 164 mg/dl (9.1 mmol/L). On average after one year, participants in the intervention group lowered fasting blood glucose to 127 mg/dl (7.0 mmol/L). At two years, fasting blood glucose of participants in the intervention group increased to 134 mg/dl (7.4 mmol/l).
By comparison,fasting blood glucose of the usual care control group was 151 mg/dl (8.4 mmol/L) at baseline,160 mg/dl (8.9 mmol/L) at one-year and 172 mg/dl (9.5 mmol/L) at two years.
Fasting Insulin
At baseline, fasting insulin of the intervention group was 28 pmol/L(4.4 uU/ml). On average after one year, participants in the intervention group lowered fasting insulin to 16.5 pmol/L (2.4 uU/mL). At two years, fasting insulin of participants in the intervention group was further reduced to 16 pmol/L (2.3 uU/mL).
By comparison, fasting insulin of the usual care control group was also 28 pmol/L(4.4 uU/ml), and at a year was 26.5 pmol/L (3.8 uU/ml) and at two years was 24.2 pmol/L (3.5 uU/ml).
Weight Loss
At baseline, body weight of the intervention group averaged at 115 kg (254 pounds). On average after one year, participants in the intervention group lowered body weight to 100.3 kg (221 pounds). At two years, body weight of participants in the intervention group increased slightly to 102.6 kg (226 pounds).
By comparison, body weight of the usual care control group was 111 kg (244 pounds) at baseline, 112 kg (247 pounds) at one-year and stable at two years.
Cholesterol and Triglycerides
LDL-cholesterol
At baseline, LDL cholesterol of the intervention group averaged 103.5 mg/dl (2.68 mmol/L). On average after one year, LDL of participants in the intervention group had increased LDL of 114 mg/dl (2.95 mmol/L). At two years, LDL of participants in the intervention group increased very slightly to 114.5 mg/dl (2.96 mmol/L).
By comparison, LDL cholesterol of the usual care control group was 100 mg/dl (2.59 mmol/L) at baseline, 88.9 mg/dl (2.30 mmol/L) at one year, and 90.0 mg/dl (2.33 mmol/L) at two years.
HDL-cholesterol
At baseline, HDH cholesterol of the intervention group averaged 41.8 mg/dl (1.11 mmol/L). On average after one year, LDL of participants in the intervention group had increased HDL of 49.5 mg/dl (1.28 mmol/L). At two years, HDL of participants in the intervention group were stable at 49.5 mg/dl (1.28 mmol/L).
By comparison, HDL cholesterol of the usual care control group was 38.7 (1.00 mmol/L) mg/dl at baseline, decreased to 37.2 mg/dl (0.96 mmol/L) at one year and 42.5 mg/dl (1.10 mmol/L) at two years.
Triglycerides
At baseline, triglycerides of the intervention group averaged 197.2 mg/dl (2.23 mmol/L). On average after one year, triglycerides of participants in the intervention group had decreased to 148.9 mg/dl (1.68 mmol/L). At two years, triglycerides of participants in the intervention group were slightly higher at 153.3 mg/dl (1.73 mmol/L).
By comparison, triglycerides of the usual care control group was 282.9 (3.19 mmol/L) mg/dl at baseline, increased to 314.5 mg/dl (3.55 mmol/L) at one year and decreased to 209.5 mg/dl (2.37 mmol/L) at two years.
Summary of Results and Significance
The main criticism for use of a ketogenic diet for the management of Type 2 Diabetes is that it is “unsustainable”, however a 74% retention rate of participants into the second year in the study demonstrates that the diet is sustainable long term and that most of the gains achieved in the first year are maintained in the second year.
While HbA1C increased slightly for the intervention group from year one (6.3% to 6.7%), the usual care group had an average HbA1C of 7.6% at one year which increased to 7.9% at two years.
CONCLUSION: While an average HbA1C of 6.7% on a ketogenic diet is not as good as it could be with better dietary adherence, it is significantly better than the 7.9% of the usual care group in this study.
Fasting blood glucose of the intervention group increased slightly from 127 mg/dl (7.0 mmol/L) at one year to 134 mg/dl (7.4 mmol/l) at two years and fasting blood glucose of the usual care group which was 160 mg/dl (8.9 mmol/L) at one-year and 172 mg/dl (9.5 mmol/L) at two years.
CONCLUSION: While an average fasting blood glucose of 134 mg/dl (7.4 mmol/l) at two years on a ketogenic diet is not nearly as good as it could be with better dietary adherence, it is significantly better than the fasting blood glucose of the usual care group which was 172 mg/dl (9.5 mmol/L) at two years.
Fasting insulin in the intervention group decreased from 28 pmol/L(4.4 uU/ml) at baseline to 16 pmol/L (2.3 uU/mL) at two years whereas in the usual care control group, fasting insulin decreased from 28 pmol/L(4.4 uU/ml) at baseline to 24.2 pmol/L (3.5 uU/ml) at to two years.
CONCLUSION: An average fasting insulin value of 16 pmol/L (2.3 uU/mL) at two years for the ketogenic diet group is significantly better than the average fasting insulin of the usual care control group of 24.2 pmol/L (3.5 uU/ml).
Weight loss in the ketogenic group was 12.4 kg (28 pounds) in two years; most of which was achieved in the first year maintained during the second year, except for very slight increase of 2.3 kg (5 pounds). No weight loss occurred in the usual care group in either the first year or the second year.
CONCLUSION: Use of a ketogenic diet resulted in significant weight loss during the first year which was largely maintained during the second year, whereas the usual care control group did not lose any weight during the course of the study.
LDL cholesterol increased in the ketogenic group from 103.5 mg/dl (2.68 mmol/L) at baseline to 114.5 mg/dl (2.96 mmol/L) at two years, but during the same time period, HDL cholesterol increased from 41.8 mg/dl (1.11 mmol/L) at baseline to 49.5 mg/dl (1.28 mmol/L) at 2 years. In the usual care control group, LDL cholesterol decreased from 100 mg/dl (2.59 mmol/L) at baseline to 90.0 mg/dl (2.33 mmol/L) at two years and HDL cholesterol only increased to 42.5 mg/dl (1.10 mmol/L) at two years from 38.7 (1.00 mmol/L) mg/dl at baseline.
At baseline, triglycerides in the ketogenic group decreased from 197.2 mg/dl (2.23 mmol/L) at baseline to 153.3 mg/dl (1.73 mmol/L) at two-years, and in the usual care control group decreased to 209.5 mg/dl (2.37 mmol/L) at two years from 282.9 (3.19 mmol/L) mg/dl at baseline.
CONCLUSION: Triglyceride to HDL ratio (a proxy measurement for LDL particle size [2,3]) went from 2.01 to 1.35 in the ketogenic intervention group and in the usual care control group only lowered from 3.19 to 2.9. While the two-year TG:HDL ratio of 1.35 in the ketogenic group is over the recommended 0.87 ratio (which indicates mostly large-fluffy LDL versus small-dense LDL), the 2-year TG:HDL ratio of 2.9 in the usual care control group indicates increased cardiovascular risk compared to the ketogenic intervention group.
This study indicates that improvement in body weight following a ketogenic diet is largely sustained into the second year with some minor rebound. Improved glycemic (blood sugar) control was also largely sustained and that significant metabolic markers and health improvements occurred using a ketogenic approach over the usual care model approach.
This study also establishes that a ketogenic diet is sustainable over the long term.
Personal Reflections
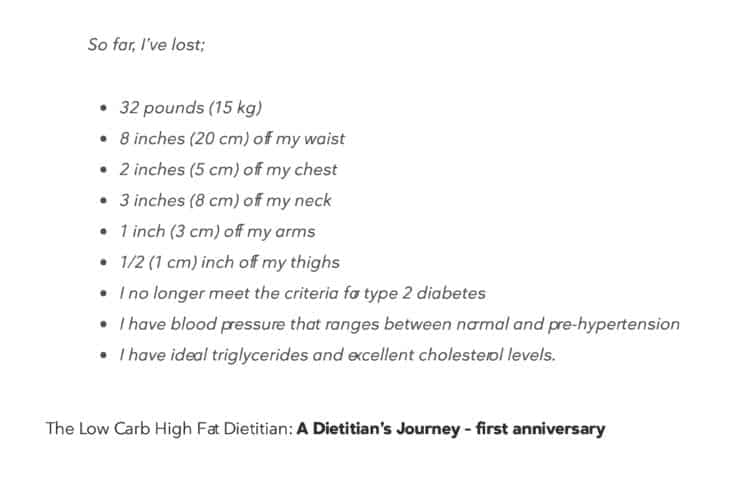
There are many anecdotal results from people such as myself that follow a similar type of dietary intervention in order to improve their health and metabolic markers and through more disciplined adherence have been able to achieve improved results than those reported in this study.
As I posted about after one year following a comparable dietary intervention as the Virta study, I lost 35 pounds in the first year and have lost an additional 15 pounds so far during the first 9 months of the second year. I know of those who have lost even more than I have during the second year, so it is by no means common for weight loss not to continue, if required.
As with participants in the Virta study, in the first year I also lowered my HbA1C to below the cut-off for Type 2 Diabetes (< 6.5%) but did so without any medication support (subjects in the Virta study were able to use Metformin support to achieve their results). Since adding Metformin in July in order to address my high morning fasting glucose resulting from Dawn Phenomena, three quarters the way into my second year, I my three month average blood glucose is ~5.5%.
Based on my lipid panel done in July, both my LDL and TG were significantly lower than these results and my HDL was also significantly higher but individual genetic variation seems to account largely for those whose LDL increase following a ketogenic diet. As I’ve said in previous articles, the issue is which LDL is increased; the large fluffy ones or the small, dense (atherosclerotic) ones.
Some Final Thoughts…
Each person is unique and each one’s commitment to continuing to follow dietary and lifestyle interventions into the second year and following will largely determine the degree of their long term success.
Those who have been following my personal story to reclaim my own health (under A Dietitian’s Journey) will know my degree of commitment is related to having had two girlfriends die within 3 months of each other and realizing that because I was overweight, had Type 2 Diabetes for a number of years and having added high blood pressure to that mix put me at high risk for heart attack and stroke. Changing my lifestyle was critical in reversing those risks. In addition, the recent diagnosis of one of my parents with Alzheimer’s Disease added to my motivation to continue to improve my blood sugar and blood insulin levels, in order to lower my risk to that as well. But A Dietitian’s Journey is my n=1 (sample set of 1) story. Everybody is different.
What the two-year data from the Virta study shows it that following “usual care” for Type 2 Diabetes does not result in weight loss nor the significant improvement in metabolic health as following a well-designed ketogenic diet does. It’s no wonder that with an average HbA1C of almost 8% and fasting blood glucose of 172 mg/dl (9.5 mmol/L) that “usual care” results in Type 2 Diabetes being a “chronic, progressive disease”. As indicated by the results of the ketogenic intervention group, it doesn’t have to be that way.
If you are seeking to improve your own health, metabolic markers or body weight and would like to do so using a low carbohydrate approach, I can help. To find out more about the packages I offer, please have a look under the Services tab or in the Shop.
If you have questions, please send me a note using the Contact Me form on this web page and I will reply as soon as I’m able.
To our good health!
Joy
You can follow me at:
 https://twitter.com/lchfRD
 https://www.facebook.com/lchfRD/
 https://plus.google.com/+JoyYKiddieMScRD
 https://www.instagram.com/lchf_rd
Copyright ©2018 The LCHF-Dietitian (a division of BetterByDesign Nutrition Ltd.)
LEGAL NOTICE: The contents of this blog, including text, images and cited statistics as well as all other material contained here (the ”content”) are for information purposes only. The content is not intended to be a substitute for professional advice, medical diagnosis and/or treatment and is not suitable for self-administration without the knowledge of your physician and regular monitoring by your physician. Do not disregard medical advice and always consult your physician with any questions you may have regarding a medical condition or before implementing anything you have read or heard in our content.
References
- Athinarayanan SJ, Adams RN, Hallberg SJ et al, Long-Term Effects of a Novel Continuous Remote Care Intervention Including Nutritional Ketosis for the Management of Type 2 Diabetes: A 2-year Non-randomized Clinical Trial. bioRxiv preprint first posted online Nov. 28, 2018; doi: http://dx.doi.org/10.1101/476275.
- Bittner V, Johnson BD, Zineh I, Rogers WJ, Vido D, Marroquin
OC, Bairey-Merz CN, Sopko G (2009) The triglyceride/highdensity
lipoprotein cholesterol ratio predicts all-cause mortality
in women with suspected myocardial ischemia: a report from the
Women’s Ischemia Syndrome Evaluation (WISE). Am Heart J
157:548—555
- Yokoyama, K., Tani, S., Matsuo, R., & Matsumoto, N. (2018). Increased triglyceride/high-density lipoprotein cholesterol ratio may be associated with reduction in the low-density lipoprotein particle size: assessment of atherosclerotic cardiovascular disease risk. Heart and Vessels.


 If we want to lose weight, get in shape and start eating healthier the way NOT to do it is by making a New Year’s Resolution.
 We may WANT to lose weight, we may WANT to exercise more and WANT to eat healthier but all the “wanting” in the world won’t move us closer to any of those goals because a goal without a plan is just a wish.
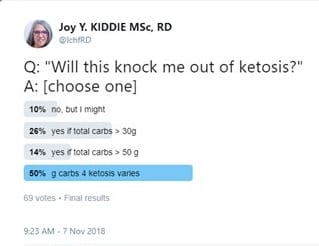
 Yesterday I asked a question on Twitter:
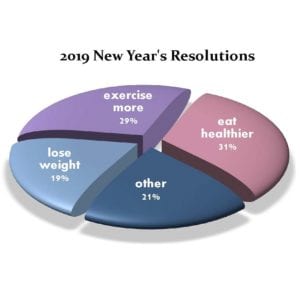


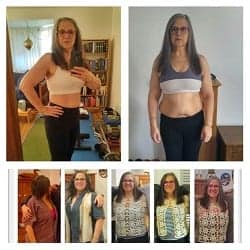
 For those who don’t know me yet, I am Joy Kiddie, a Registered Dietitian with a post graduate degree in Human Nutrition who has been in private practice for more than a decade in British Columbia (originally from Montreal, Quebec). I first heard about the current use of a low carbohydrate diet from a retired physician-friend who came to speak with me regarding my thoughts about using this approach to improve the health of a family member. My personal ‘turning point’ was March 5, 2017 when I came to the harsh realization that I was metabolically very unwell and needed to change my diet and lifestyle. I began that day and haven’t looked back. I provide both in-person and Distance Consultation (Skype, phone) services related to following a low carbohydrate diet for lifestyle or therapeutic purposes. Note: the above ‘after’ photo was taken several months ago. I have since lost an additional 12 pounds.