Recently, there has been a lot of buzz about a weight-loss program called Ideal Protein® which is often talked about as being a “low carb diet” so I decided to look into what this system is, and how it works. A local pharmacy is participating in this program, so I was able to obtain information directly from the pharmacist.
Ideal Protein®, in it’s weight-loss phase (called “Phase 1”) is both a low carb and low fat diet – and is most significantly a calorie-restricted diet promoted for weight loss.
Pharmacy-based
“Lifestyle Clinics”, many of which are located at participating pharmacies are supervised by a pharmacist (or a nurse) who oversees the promotion of the Ideal Protein® line of products required for the diet, as well as the Natura® vitamin and mineral supplements and “Ideal Salt®“, which clients are instructed to use daily.
The designated pharmacist (or nurse) reviews the sign up, but “Ideal Protein® weight loss “coaches” are the ones who review weekly “food journals” that clients are required to keep, as well as records client’s weight, body measurements and fat % readings at their weekly “check-ins”.
Restricted Foods
In addition to limiting both carbs and fats, many foods are not permitted to be eaten by those on the Ideal Protein® diet until clients achieve 100% of their weight-loss goals.
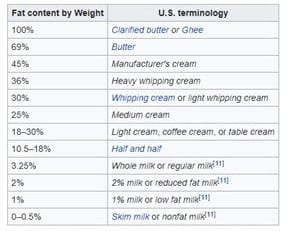
For example, no cheese or dairy is permitted during the weight loss phase, except for 30 ml (1 oz) of regular milk in coffee or tea at breakfast. Natura® supplements are prescribed to clients to ensure adequate intake of calcium and magnesium.
The only vegetables permitted during the weight-loss phase of the Ideal Protein® diet during lunch and dinner are what are called “selected vegetables” – which exclude green and wax beans, Brussels sprouts, eggplant, heart of palm, rutabaga, snow peas, tomatillo, and tomatoes. These are considered “occasional vegetables” and are allowed to a maximum of 4 cups per week.
*NOTE: I have been advised from a pharmacist that sells these products that these vegetables have “extra carbohydrates” and “slightly higher GI (glycemic index) for the most part“, which is the reason they are limited.
Glycemic Index (GI) is a measure of the effect of carbohydrates on a person’s blood sugar. I am more interested in a food’s Insulin Index (II) which is a measure of the effect of a carbohydrate on a person’s insulin levels.
Permitted “selected vegetables” are alfalfa, asparagus, bamboo shoots, bean sprouts, bell peppers, broccoli, cabbage, cauliflower, celeriac, celery, chayote, chicory, collards, cucumbers, dill pickles, fennel, Chinese broccoli, green onions, jicama, kale, kohlrabi, mushrooms, okra, onions (raw only), hot peppers, radish, rhubarb, sauerkraut, spinach, Swiss chard, turnip, and zucchini / yellow summer squash.
Only unlimited “raw vegetables and lettuce” in the list below are permitted during the weight-loss phase (and only during lunch and dinner). These are arugula, bibb lettuce, Boston lettuce, celery, chicory lettuce, cucumber, endives, escarole lettuce, frisée lettuce, green and red leaf lettuce, iceberg lettuce, mushroom, radicchio, radish, romaine lettuce, spinach and watercress lettuce. All others raw vegetables and lettuce are prohibited.
Even in Phase 2, clients are instructed to only “eat the vegetables permitted” and to “continue to omit cheese and other dairy with the exception of 30 ml (1 oz.) of milk in coffee or tea only“.
Ideal Protein® “Meals”
During the weight loss phase (Phase 1), clients are instructed to have meals as follows;
BREAKFAST: 1 Ideal Protein® diet food product, with the option of having coffee or tea with 1 oz. (30 ml) milk, plus Natura® vitamin and mineral supplements.
LUNCH: 1 Ideal Protein® diet food product, with 2 cups of “selected vegetables” and unlimited “raw vegetables and lettuce” from the above list.
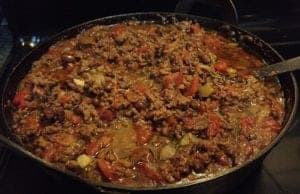
DINNER: clients can eat 8 oz (225g) of lean fish / seafood, lean beef, skinless poultry, lean cuts of pork, veal or wild game meat and 2 cups of “selected vegetables” and unlimited “raw vegetables and lettuce” from the above list plus Natura® vitamin and mineral supplements and omega 3 plus.
SNACK: For a snack, clients eat another Ideal Protein® diet food product and more Natura® vitamin and mineral supplements.
In “Phase 2”, which occurs after 100% of weight loss goals have been achieved, the number of Ideal Protein® diet food products required to be consumed is reduced to 2 and clients can eat the protein choice they wish from the approved list at both lunch and dinner, for 2 weeks. The “selected vegetables” and unlimited “raw vegetables and lettuce” remains the same.
In “Phase 3”, the number of Ideal Protein® diet food products required to be consumed is reduced to 1 and clients can continue to eat the protein choice they wish from the approved list at both lunch and dinner, for 2 weeks. The “selected vegetables” and unlimited “raw vegetables and lettuce” remains the same.
It is only in “Phase 4”, the maintenance phase” of the Ideal Protein® weight loss system where clients are allowed to eat “all whole foods, including protein and fats, and do not need to eat the Ideal Protein® products”.
Additional Instructions
Clients are instructed to follow the strict carbohydrate and fat restriction until they achieved “100% of their weight loss goals” and to “eat no more / no less” than the amount of food listed for each meal and snack. That is, “Phase 1” last as long as necessary until a person loses all the weight they planned.
They are cautioned that during Phase 1 and possibly beyond that, six symptoms may occur – especially if they “don’t follow the weight loss method as prescribed”. These symptoms are hunger, headache, nausea, fatigue, constipation and bad breath.
Restricted Calories
Ideal Protein® provides only 850-1000 calories per day, which makes it a calorie-restricted diet.
Low Carb
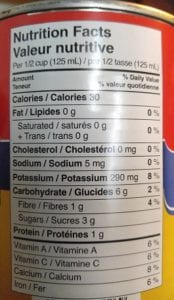
The Ideal Protein meal replacement packets provide ~20 gm net carbs per day and the “selected vegetables” and “raw vegetables and lettuce”provide ~ 20 gm net carbs per day. Total net carbs are ~40 gm / day.
High Protein
In the Ideal Protein® system, the meal supplements contain ~15-20 gm protein each and 3 of those are to be eaten each day, along with 8 oz of lean animal protein per day. From the ‘meal packets’, there are 60-80 gms of protein and anywhere from 56 gm of protein (lean ground beef) to 72 gms of protein (chicken breast). In total, the Ideal Protein system has people eating between 120 gm – 152 gm of protein per day.
According to Statistics Canada (www.statcan.gc.ca/daily-quotidien/170620/dq170620b-eng.htm), the average protein intake for an adult is 16.5% to 17.0%. Based on Ideal Protein® system having a caloric intake of 850-1000 kcals/day, and the 3 meal supplement packets providing 15-20 gm of protein each, plus the 8 oz of lean protein (another 56-72 gms of protein), the Ideal Protein® system supplies 53 – 67.5% of calories as protein.
Costs
In terms of cost, it is ~ $500 to sign up to begin the Ideal Protein® diet, which includes a ‘coaching fee’, first round of supplements and 2 weeks worth of meal replacement and meal supplement sample products.
After sign up, the cost works out to ~$100 a week to purchase the Ideal Protein® products, plus supplements i.e. each box of 7 Ideal Protein® ”meal replacements” or diet food product (required to be eaten for meals and snacks) costs ~$30 and for weight loss, 3 boxes a week are required.
Each additional month is another ~$400.
Ideal Protein® – the company
The Ideal Protein® company is headed by Dr. Randall Wilkenson MD, who has 20 years experience specializing in allergy and environmental medicine and who now works with his son Denver Wilkenson, whose experience is in managing a weight-loss clinic in Idaho for 3 years.
Ami-Higbee, RN serves as Clinic Director and Mike Ciell, RPh, a registered pharmacist certified in geriatric pharmacy, is VP of Clinic Operations.
At the time of writing, no Registered Dietitians are listed on the team, but they do have a ‘chef’ from Quebec who designs their recipes, almost all of which include ingredients from their Ideal Protein® product list.
According to a local pharmacist that I spoke with, Ideal Protein® has over 4000 of these “Lifestyle Clinics” worldwide.
A few thoughts…
This diet is very popular, but it is not a “low carb diet” but is a “low carb, low fat, calorie restricted diet”.
It’s easy because people don’t need to think what to to eat and can buy meal replacement products to satisfy breakfast and the protein component of lunch. For supper, clients are provided with recipes that use the special branded products that they already purchase to make cooking easy. A snack (deemed necessary, I presume) is another food replacement product. There is limited food preparation required.
The diet system promotes fast weight loss — where both carbohydrates and fats are limited.
Since it is overseen by a pharmacist or a nurse, it has the image of being healthy. But is it “ideal”?
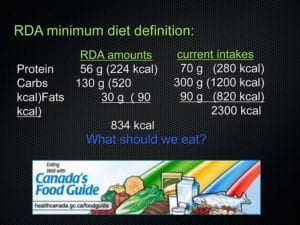
As discussed in an earlier article, our bodies have an absolute requirement for specific essential nutrients; nutrients that we must take in our diet because we can’t synthesize them. These are listed in several volumes called the Dietary Reference Intakes (DRIs), published by National Academies Press. There are essential amino acids, fatty acids, vitamins and minerals – and it is necessary to take in adequate protein and fat, when carbohydrate is restricted.
In the Dietary Reference Intakes for Energy, Carbohydrate, Fiber, Fat, Fatty Acids, Cholesterol, Protein and Amino Acids (2005) it reads;
”The lower limit of dietary carbohydrate compatible with life apparently is zero, provided that adequate amounts of protein and fat are consumed.
… however, Ideal Protein® diet restricts both carbs and fats.
It restricts calories.
It restricts cheese and all dairy except for one ounce of milk per day.
It restricts which non-starchy vegetables can be consumed.
It allows no fruit.
It allows no nuts or seeds.
It offers vitamin and mineral supplements and food replacements in place of those real foods.
In the Ideal Protein® system, people are required to eat 4 times a day with carbs contained in the branded meal supplements on each occasion. Research supports that to begin to lower insulin release in insulin-resistant people requires periods of at least a 12 hour where no food is eaten, which naturally occurs after dinner before the first meal of the day breakfast). Having people eat a ‘snack’ would appear to be self-defeating.
Eating a low carb high healthy fat with 3 meals per day, with nothing between supper and breakfast supports the lowering of insulin release, improving the cells insulin sensitivity, in time. Adding to this periods of intermittent fasting (which is not a total fast, but has no carbohydrates or significant amounts of protein) allows insulin levels to fall even further, which is often the goal of eating a low carb diet.
In the Ideal Protein® system, the meal supplements contain ~15-20 gm protein each and there are 3 of those per day and there is also 8 oz of lean animal protein per day. From the ‘meal packets’, there are 45-60 gms of protein and anywhere from 56 gm of protein (lean ground beef) to 72 gms of protein (chicken breast). In total, the Ideal Protein® system supplies between 100 gm – 132 gm of protein per day. While carb intake in the Ideal Protein® system is low, the body would synthesize glucose from the excess protein (called gluconeogenesis) resulting in insulin release. From my understanding, this appears to be self-defeating if the goal is to lower insulin release.
It would seem that the increased gluconeogenesis from the high protein intake in the Ideal Protein® system would not support increased insulin sensitivity as much as a low-carb-high-fat moderate protein diet, even without intermittent fasting.
Another factor is the $500 start-up cost for the first month, plus another $400+ for each additional month to eat ‘meals’ comprised of largely of meal replacements and supplements, along with some real food.
Ideal Protein® makes it easy and promotes rapid weight loss, but is it really “ideal” for people who have made poor eating choices in the past — when they don’t learn how to make healthy meal choices while achieving weight loss? Weight loss may be quick, but weight loss also has to be sustainable.
Also, is it really “ideal” for people who are insulin resistant when it has them eating food with carbohydrate and protein 4 times per day?
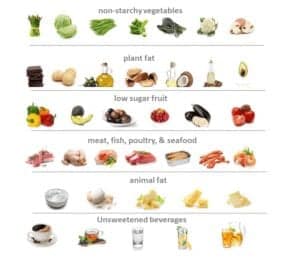
I encourage my clients to eat a wide variety of real foods — foods such as dairy products including cheese, domesticated and wild meat, poultry and fish, especially fatty fish that are rich in omega 3 fats, low-carb fruit and a vast array of low-carb vegetables. There are fats from all sources, including some healthy saturated fat, with most fat coming from healthy monounsaturated sources such as olives avocados, nuts and seeds. There are no food diaries to keep and no mandatory “weigh-ins” or “check-ins”. My clients eat real food when they are hungry and don’t eat if they are not hungry. Most significantly, they learn to make healthy food choices with whole, real food as they lose weight.
Each person needs to evaluate for themselves whether use of the Ideal Protein® system makes sense for them.
As I always do, I recommend that people consult with their own doctor before beginning any weight-loss program.
To your good health!
Joy
You can follow me at:
 https://twitter.com/lchfRD
 https://www.facebook.com/lchfRD/
Note: Everyone’s results following a LCHF lifestyle will differ as there is no one-size-fits-all approach and everybody’s nutritional needs and health status is different. If you want to adopt this kind of lifestyle, please discuss it with your doctor, first.
Copyright ©2017 The LCHF-Dietitian (a division of BetterByDesign Nutrition Ltd.)
LEGAL NOTICE: The contents of this blog, including text, images and cited statistics as well as all other material contained here (the ”content”) are for information purposes only. The content is not intended to be a substitute for professional advice, medical diagnosis and/or treatment and is not suitable for self-administration without the knowledge of your physician and regular monitoring by your physician. Do not disregard medical advice and always consult your physician with any questions you may have regarding a medical condition or before implementing anything you have read or heard in our content.


 So much for people’s good intentions of substituting a healthy monounsaturated fat for a refined, industrial seed oil like canola.


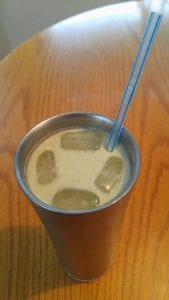 If you’re in a rush, this shake can be made quickly in a bowl and poured over ice and enjoyed…
 …or if you have a few extra minutes and a blender, it can be whirred with a little extra ice to make a wonderful meal replacement smoothie.


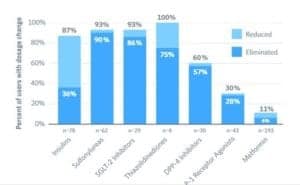
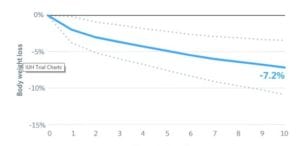 Mean body mass reduction was 7.2% from a baseline average of 117 kg (257.4 pounds) ±26 kg / 57 lbs.
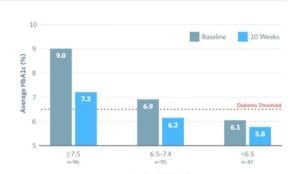 At 6 months, HbA1C was reduced to 6.1% ±0.7% from 7.5% ±1.3% in a sample of 108 participants who elected to test HbA1c at 6 months.