Joy Y Kiddie MSc., RD - I'm a Registered Dietitian in private practice in British Columbia, Canada that provides low carb and ketogenic services in-person in my Coquitlam office, as well as by Distance Consultation (using Skype / telephone).
If you live almost anywhere in Canada and are looking for a Registered Dietitian with experience providing low carbohydrate or ketogenic diet support, I can help.
Whether you live in British Columbia, Alberta, Saskatchewan, Manitoba, Ontario, Quebec, New Brunswick, Nova Scotia, Newfoundland or Labrador, I am now licensed to provide you with services.
I currently can’t provide Dietitian services to Prince Edward Island (PEI) but if I have enough demand, I will consider becoming licensed in that province, as well.
Registered in British Columbia since 2002
I have been registered with the College of Dietitians of British Columbia since 2002 as an RD(t) and since 2008 as a full registrant. This registration enables me to provide services to people across Canada, with the exception of Alberta and PEI but since I’ve had several physicians in Alberta who have asked to refer patients to me as well as individuals from Alberta requesting services, I recently applied to- and was accepted into the College of Dietitians of Alberta.
Provincial Registration Requirements for Virtual Dietetic Practice
As can be seen from the table below, Registered Dietitian such as myself that provide virtual Dietetic practice services (Distance Consultation) to other provinces are required to meet very specific registration requirements, as well as observe other regulatory regulations.
Virtual Dietetic Practice (Telepractice) – from the Alliance of Dietetic Regulatory Bodies. August, 2017
In the US or overseas?
I am a member of the College of Dietitians of British Columbia as well as the College of Dietitians of Alberta and am licensed to provide Registered Dietitian services in most provinces in Canada (except PEI), but if you live in the USA or elsewhere, I can provide you with low carb or ketogenic nutrition education services that would not be considered medical nutrition therapy (MNT) and that would be provided for information purposes only.
More Info
If you would like more information, you can find out more under the Services tab or by looking in the Shop. If you have specific questions, please send me a note using the Contact Us form on the tab above and I’d be glad to reply as I am able.
Tomorrow will be two years since I began what I’ve called “A Dietitian’s Journey” — which is my personal journey to restore my health and then to achieve optimal health.
My journey began March 5, 2017 when I felt unwell just sitting at my office desk. I didn’t know what was wrong, although in retrospect I should have given that I was a Registered Dietitian.
I took my blood pressure and it was astronomically high — so high, that had I gone to my doctor at that point he probably would have sent me directly to the hospital in an ambulance. He certainly would not have let me drive! After checking my blood sugar for the first time in ages (even though I was diagnosed with Type 2 Diabetes 8 years earlier) it was also ridiculous.
The very first step of my ‘journey’ was to come out of denial.
When we ‘deny’ something, we say it is untrue — but it was not as though I was deliberately deceiving myself or anyone else about my health, I was simply neglecting to find out the magnitude of reality, so in psychological terms, I was in denial. Taking my blood pressure and blood sugar two years ago was a huge dose of reality. I had no choice but to face the fact that I was metabolically very unwell!
As I’ve said many times on podcasts and written in my blogs, what I should have done at that point was go straight to my doctor’s office and let him either treat me with multiple medications himself or send me to the hospital to be treated and released with medications, but I didn’t. I was scared…no, I was terrified. In the preceding months, I had two girlfriends who spent their lives working in healthcare die of natural causes within 3 months of each other; one from a massive heart attack and the other from a stroke. I knew if I didn’t do something I was at very high risk of being next. When I say I changed my lifestyle “as if my life depended on it” it’s because quite literally it did.
The short video directly below was taken during my first walk at the local track 2 weeks after I had adopted a low carbohydrate lifestyle on March 5, 2017. It’s clear how obese I was and how difficult it was for me to walk and talk at the same time.
Last night I decided that the most appropriate way for me to ‘celebrate’ my two year anniversary of reclaiming my health was to go back to the very same place and make an updated short video, which is what I did this morning — even though it was really cold out this morning (for March in Vancouver, that is)!
Before you watch the updated short video, here is a summary of what I was able to accomplish this time last year — after following a low carbohydrate lifestyle for only a year;
March 5, 2018
By March 5, 2018, I had lost;
32 pounds
8 inches off my waist
2 inches off my chest
3 inches off my neck
1 inch off my arms
1/2 inch off my thighs
I no longer meet the criteria for Type 2 Diabetes (achieved without the use of medication)
I had blood pressure that ranges between normal and pre-hypertension without medication
I had ideal triglycerides and excellent cholesterol levels achieved without any medication.
As of today, March 4, 2019, I have lost;
selfie taken March 3, 2019 in the smallest jeans I have (size 12)
55 pounds
12- 1/2 inches off my waist
3 -1/2 inches off my chest
6 -1/2 inches off my neck
4 inches off each arm
2- 1/2 inches off each thigh
I met the criteria for partial remission of Type 2 Diabetes 3 months ago*
My blood pressure still ranges between normal and pre-hypertension**
I still have ideal triglycerides and excellent cholesterol levels
* My dad was diagnosed with Alzheimer’s disease in August (sometimes referred to as Type 3 Diabetes), so even though my HbA1C was 6% at the time, my endocrinologist agreed to start me on Metformin. ** I started on a ‘baby dose’ of Ramipril in October 2018 to protect my kidneys from the residual high blood pressure.
Here is the video taken this morning, after two years of following a low carbohydrate diet (of which the last 14 months was ketogenic).
If you would like to know how I can help you or a family member with weight loss or reversing the symptoms of Type 2 Diabetes, high blood pressure or high cholesterol, please click on the Services tab to learn more. If you have questions please send me a note using the Contact Me form located on the tab above and I will reply as soon as I am able.
To your good health!
Joy
NOTE: This post is classified under “A Dietitian’s Journey” and is my personal account of my own health and weight loss journey that began on March 5, 2017. Science Made Simple articles are referenced nutrition articles, and can be found here.
LEGAL NOTICE: The contents of this blog, including text, images and cited statistics as well as all other material contained here (the ”content”) are for information purposes only. The content is not intended to be a substitute for professional advice, medical diagnosis and/or treatment and is not suitable for self-administration without the knowledge of your physician and regular monitoring by your physician. Do not disregard medical advice and always consult your physician with any questions you may have regarding a medical condition or before implementing anything you have read or heard in our content.
INTRODUCTION: It is well known that adults are at risk of cardiovascular disease (CVD) due to having obesity and Type 2 Diabetes, but it is now known that children and adolescents are also at risk of premature coronary artery disease and stroke for the same reasons.
According to a new scientific statement from the American Heart Association (AHA) published in the Association’s journal Circulation this past Monday (February 25, 2019) [1], obesity and severe obesity in childhood and adolescence have been added to the list of conditions that put kids and teenagers at increased risk for premature heart disease, including coronary artery disease (CAD) and stroke and are considered at high risk of cardiovascular disease simply by having Type 2 Diabetes, whether or not they are overweight.
Childhood overweight is defined as a Body Mass Index (BMI) between the 85th to 94th percentile for age and sex, and childhood obesity is defined as having a Body Mass Index (BMI) ≥ 95th percentile for age and sex.
Youth with obesity are now considered at-risk of heart disease and stroke and those with severe obesity are now considered at moderate risk of heart disease and stroke based on a large-scale study from 2016 that followed 2.3 million people for over 40 years and found the risk of dying from a cardiovascular disease were 2-3 times higher if people’s body weight as adolescents had been in the overweight or obese category, compared to youth with normal weight [2].
Obesity, specifically the ectopic fat (fat in the organs) is considered an independent risk factor for cardiovascular disease (CVD) and is associated with other CVD risk factors such as high triglycerides, low levels of HDL cholesterol, high blood pressure, high blood sugar (hyperglycemia), insulin resistance, inflammation and oxidative stress.
It Is estimated that in 2014 ~6% of all youth 2 to 19 years old in the United States were severely obese [3] and 2015 Canadian data indicates that obesity in children aged 5-17 years of age averaged around 12% (14.5% for boys and ~9.5% in girls) [4].
Given these children are 2-3 times more likely to have premature cardiovascular disease as adults, the time to successfully address their overweight and obesity is when they are still young.
Cardiovascular Disease -a leading cause of death
Cardiovascular disease is the leading cause of death for people of all ages and both genders in the United States [5] and the second leading cause of death in Canada [6] and a large percentage of these deaths are entirely preventable with appropriate dietary and lifestyle habit changes whether they are implemented as children, youth or adults.
Proposed Mechanism – inflammation
The American Heart Association scientific statement states that the exact mechanism by which these contribute to cardiovascular disease remains to be fully understood and explained, they believe that the cardiovascular risk is brought about by a combination of insulin resistance and oxidative stress (free radical damage), but that inflammation comes first.
“Insulin resistance, oxidative stress, and inflammation are linked multidirectionally, but emerging evidence supports a mechanism by which inflammation comes first.”
SIDE-NOTE: This idea that inflammation precedes insulin resistance is something I’ve been coming across recently. Some propose that insulin resistance itself may be a protective mechanism against high levels of circulating glucose (sugar) in the blood [a], in much the same way as the ability to produced more and more subcutanous fat (the fat directly under the skin) may be protective against the accumulation of fat around the organs (called visceral fat) or fat in the organs or even the bone (called ectopic fat). That is, excess energy (calories) seen as high levels of glucose in the blood may be the result of storage problems in fat cells (the body’s inability to make new subcutaneous fat cells), and the subsequent overflow of fat may drive excess high glucose production in the liver. a. Nolan CJ, Prentki M, insulin resistance and insulin hypersecretion in the metabolic syndrome and type 2 diabetes: Time for a conceptual framework shift, Diabetes and Vascular Disease Research, Feb 15, 2019
The American Heart Association (AHA) suggests that inflammation may increase cardiovascular risk through a combination of these three factors;
(1) high triglycerides (TG) (2) low high-density lipoprotein cholesterol (HDL)
(3) high small low-density lipoprotein (LDL) particles (LDL-s)
NOTE: Studies on LDL-particle size indicate that people whose LDL is mostly the small, dense sub-particles have a 3x greater risk of coronary heart disease than those with mostly the large, fluffy sub-particle type, which is thought to be protective.”
The American Heart Association suggests that it’s the inflammatory process itself that triggers insulin resistance as a mechanism to keep blood sugar high in order to meet the needs of an immune system that has become activated, as would occur when the body is fighting a significant infection.
They propose that this process of inflammation leads to; (1) defective activity of an enzyme that is responsible for breaking down triglycerides (i.e. lipoprotein lipase) which would normally be used by the body as energy or stored in fatty tissue for later use (2) blocking of normal fat cell creation (adipogenesis) (3) an increase in triglycerides in order to deal with infectious toxins and (4) an overproduction of smaller LDL particles* and HDL particles
*The ADA suggests that the formation of small LDL particles may perform some important function in this situation of high inflammation, as small LDL particles can easily penetrate the blood vessels to deliver cholesterol to damaged tissue and that oxidation of these small LDL particles make atherosclerosis even worse.
The decrease in HDL cholesterol which is frequently seen on a standard cholesterol test (lipid panel) in the context of inflammation is thought to be associated with a decrease in reverse cholesterol transport which promotes the building up of cholesterol in the tissues, where it is used for the synthesis of cortisol for the cell membranes that have become damaged by what the body sees as an ‘infection’.
Recommended Dietary Changes
The AHA recommends different dietary and lifestyle changes for each of the risk factors
High Triglycerides(TG)
The AHA recommends a diet low in simple carbohydrates and added sugars, high in dietary fiber from fruits* and vegetables**, moderate amounts of complex carbohydrates, and high in polyunsaturated*** and monounsaturated fats, without specific restriction of saturated fats.
NOTES: * fructose, the sugar in fruit is a simple carbohydrate and can be a major contributor to high TG. ** there is no distinction between starchy vegetables such as potato and sweet potato (which accounts for a large percentage of overweight children and adult’s ‘vegetable’ servings) and non-starchy vegetables such as leafy greens and cruciferous vegetables, such as broccoli and cauliflower, as well as a whole host of other low carbohydrate non-starchy vegetables. *** it is well established that omega 6 polyunsaturated fats contribute to the inflammation process yet the recommendation doesn’t indicate that there should be a decrease in omega 6 polyunsaturated fats such as from soybean oil, canola oil, etc. and an increase in anti-inflammatory omega 3 fats from fatty fish such as tuna, salmon, sardines, etc even though the paper itself proposes inflammation at the heart of the issue. This makes no sense to me.
Total LDL Cholesterol
Diet high in fiber from fruits* and vegetables**, whole grains, high in polyunsaturated*** and monounsaturated fats, low in saturated fat and devoid of trans fats.
See Notes above for * , ** and ***.
NOTE: The body of the AHA paper elaborates on the detrimental effect of the small LDL subparticle (LDL-s), yet no such differentiation from total LDL cholesterol (LDL-c) is made in the Dietary Recommendations. Why is that? Particle size of LDL can be established by testing, using Apo B:Apo A ratio (Apo B is a component of lipoproteins involved in atherosclerosis and cardiovascular disease) and by proxy using a TG:HDL ratio. It makes no sense to me that the dietary recommendations focus on total LDL cholesterol when the paper makes it clear that it is the small LDL subparticle that is the risk factor.
Blood glucose (without diagnosis of Type 1 or Type 2 diabetes)
Low glycemic diet limiting intake of added sugar to ≤5% of total calories, high in fruits* and vegetables**, encouraging intake of polyunsaturated*** and monounsaturated fats, and without specific limitation to dietary saturated fats.
See Notes above for * , ** and ***.
Some final thoughts…
The dietary recommendations in this paper that focus on lowering simple carbohydrate and added sugars are very sound, as are recommending moderate amounts of complex carbohydrate and high in monounsaturated fat. However, to me it makes no sense for the AHA to recommend a diet high in fruit when fruit is the primary source of the simple sugar fructose and it also makes no sense to me for the dietary recommendations not to differentiate between starchy vegetables like potatoes, sweet potatoes and corn (which is actually a grain that is counted as a vegetable) that raise blood sugar and the non-starchy vegetables such as salad greens, broccoli and cauliflower and the abundance of other low carbohydrate vegetables.
Furthermore, given that the AHA proposes an inflammatory mechanism at the root of the cardiovascular disease process, it makes no sense to me for the dietary recommendations to fail to differentiate between pro-inflammatory omega 6 polyunsaturated fatty acids (such as those found in soybean and canola oil) and anti-inflammatory omega 3 polyunsaturated fatty acids, such as those found in fatty fish.
Finally, when the body of the paper makes it very clear that it is the small LDL cholesterol subparticle that contributes to athlersclerosis and that oxidization of it in particular is an additional risk factor, why do the dietary recommendations not focus on lowering the small LDL subparticle, rather than total LDL cholesterol?
Eating a lower carbohydrate intake will both reduce triglycerides (TG) and increase high density lipoproteins (HDL), resulting in an improved TG:HDL ratio, which would indicate a reduction in the small, dense LDL subfraction, and reduced risk of cardiovascular disease. Recommending a reduction in saturated fat intake will likely reduce any increase in HDL cholesterol with no consistent evidence that lower total LDL cholesterol will result in lower cardiovascular rates.
On one hand, the paper provides a good explanation about the risks of the small, dense LDL subparticle yet recommends lowering dietary intake of saturated fat, in order to lower total LDL cholesterol.
Why the avoidance of consistent dietary changes that would reduce the small, dense LDL subparticle and increase protective HDL?
If you would like to know about the services that I offer for lowering body weight in adults as well as youth as well as bringing high blood sugars under control, then please click on the Services tab to learn more. If you have questions related to my services then please send me a note using the Contact Me form located on the tab above and I will reply as I am able.
LEGAL NOTICE: The contents of this blog, including text, images and cited statistics as well as all other material contained here (the ”content”) are for information purposes only. The content is not intended to be a substitute for professional advice, medical diagnosis and/or treatment and is not suitable for self-administration without the knowledge of your physician and regular monitoring by your physician. Do not disregard medical advice and always consult your physician with any questions you may have regarding a medical condition or before implementing anything you have read or heard in our content.
References
American Heart Association, Cardiovascular Risk Reduction in High-Risk Pediatric Patients – a scientific statement from the American Heart Association, Circulation. 2019;139:00-00
Twig G, Tirosh A, Leiba A, Levine H, Ben-Ami Shor D, Derazne E, Haklai
Z, Goldberger N, Kasher-Meron M, Yifrach D, Gerstein HC, Kark JD.
BMI at age 17 years and diabetes mortality in midlife: a nationwide cohort
of 2.3 million adolescents. Diabetes Care. 2016;39:1996—2003.
Skinner AC, Perrin EM, Skelton JA. Prevalence of obesity and severe obesity
in US children, 1999—2014. Obesity (Silver Spring). 2016;24:1116—
1123. doi: 10.1002/oby.21497
Statistics Canada. 2015 Canadian Community Health Survey, Measured children and youth body mass index (BMI) (World Health Organization classification), by age group and sex, Canada and provinces, Canadian Community Health Survey.
Benjamin EJ, Virani SS, Callaway CW et al (on behalf of the American Heart Association Council on Epidemiology and Prevention Statistics Committee and Stroke Statistics Subcommittee). Heart disease and stroke statistics—2018 update: a report from the American Heart Association [published correction appears in Circulation. 2018;137:e493]. Circulation. 2018;137:e67—e492
Statistics Canada, Leading causes of death, total population, by age group, https://www150.statcan.gc.ca/t1/tbl1/en/tv.action?pid=1310039401
Most people think of pre-diabetes as ‘warning sign’ that they are at risk for developing type 2 diabetes, but it is actually the final stage before diagnosis. By the time a person is prediabetic their blood glucose results (also called “blood sugar”) are in the abnormal range on routine tests such as a fasting blood glucose test (FBS) and glycated hemoglobin (HbA1C). They also may already have increased high blood pressure, abnormal cholesterol, and be at increased risk of cardiovascular disease, including heart attack and stroke as well as chronic kidney disease. By assessing a person’s fasting blood glucose and fasting insulin at the same time then using a simple calculation we can accurately estimate the degree of a person’s insulin resistance and β-cell function before they become pre-diabetic — enabling them to make dietary interventions to prevent that from occurring, lower the likelihood of them progressing to type 2 diabetes
It is now known that abnormalities with the hormone insulin — including insulin resistance and hyperinsulinemia appear more than 20 years before a diagnosis of Type 2 Diabetes[1], so prevention of type 2 diabetes needs to begin when blood sugar results still appear normal.
Before getting into the technical details of insulin resistance and hyperinsulinemia, I want to explain these concepts in terms that everyone can understand.
Measuring Glucose and Insulin Together
Most people know that a car’s speedometer indicates how fast the car is going. The tachometer indicates how many times per minute the engine is rotating. If a car is doing 180 km / hour (110 miles per hour) on the highway, one would expect the engine to be working hard. But if a car was only doing 70 km / hour (44 miles per hour), one wouldn’t expect the engine to be working that hard, right?
The problem is that blood sugar may be within normal range because the pancreas is overworking to keep it low! The β-cell of the pancreas are being overworked but no one notices because they aren’t looking for it.
Even when people have a 2 hour Oral Glucose Test with added insulin assessors (explained below), blood glucose results may come back normal because the person is healthy. The problem is that blood glucose results may appear normal because the pancreas is working way too hard to keep it that way! That is, using the car example, the tachometer is working very hard, but the car is hardly moving!
Normal blood sugar values with abnormal insulin values = overworked pancreas – original illustration by Joy Y. Kiddie MSc, RD (special thanks to Dr. Eric Sodicoff for the idea)
Let’s look at this scenario in terms of blood test results;
Let’s say we have a person that has fasted overnight and their fasting blood glucose in the morning is normal at 4.9 mmol/L (88 mg/dl), but their fasting insulin is much higher than the ideal 14.0 – 42.0 pmol/L (2-6 uU/ml) — in this case, say it is 132.6 pmol/L (19.1 uU/ml).
This would be like the car being started but in “park” in the driveway and the engine turning at 3,000 RPM! The pancreas is working way too hard to maintain blood sugar and the person hasn’t even eaten yet!
Say we now give this person 75 g of pure glucose to drink and check what happens to their blood sugar at 30 minutes and/or one hour afterwards.
What we expect a healthy person’s blood sugar to do is to go up in response to taking in the glucose, for the pancreas to release the appropriate amount of insulin which results in the blood sugar going back down to at- or slightly below where it started from. This is the normal, healthy response.
On a graph it would look like this;
Normal Glucose Response with 75 g of glucose
But in the case of the person whose blood sugar is normal at fasting (i.e. 4.9 mmol/L (88 mg/dl)) but their fasting insulin is much higher than ideal (i.e. 132.6 pmol/L (19.1 uU/ml) instead of 14.0 – 42.0 pmol/L (2-6 uU/ml)), their car is in “park” but the engine is already turning fast!
When this person drinks the 75 g of glucose, their pancreas goes into “high rev” and releases a huge amount of insulin—which not only keeps the blood sugar from going up normally in response to taking in glucose, it may result in the blood sugar actually dropping slightly below the fasting level (from 4.9 mmol/L / 88 mg/dl to 4.8 mmol/L / 86 mg/dl). This is not a healthy response but is characteristic of hyperinsulinemia (too much circulating insulin even when the person is fasting).
This glucose and insulin response would look as follows;
If this person had only had a standard 2 hour Glucose Tolerance Test, they would be told everything is “fine” because their fasting blood glucose was normal at 4.9 mmol/L / 88 mg/dl and at 2 hours their blood glucose came right back down to normal (4.9 mmol/l / 88 mg/dl)!
Using the car analogy, their “tachometer” (pancreas that produces insulin) is working way too hard in order to keep blood sugar low. Burnout of the pancreatic β-cells is what results in type 2 diabetes (T2D) but without assessing simultaneous glucose AND insulin at fasting, either 30 minutes or 1 hour, and at 2 hours, the fact this person’s pancreas is working way too hard to keep glucose low would be totally missed.
By the time a person is diagnosed with T2D, they have lost approximately half of their β-cell mass, so preventing the β-cell’s of the pancreas from being overworked is how to delay or prevent becoming type 2 diabetic!
Four Stages of Type 2 Diabetes – why assessing β-cell function is important
There are four stages in the progression of type 2 diabetes, with Insulin Resistance (IR) and hyperinsulinemia being the stage BEFORE pre-diabetes [2].
Stage 1: Insulin Resistance (including hyperinsulinemia)
Stage 2: Pre-diabetes
Stage 3: Type 2 Diabetes
Stage 4: Metabolic and Vascular Complications
Four Stages of Type 2 Diabetes – original illustration by Joy Y. Kiddie MSc, RD
Insulin resistance and hyperinsulinemia together are essentially “pre-pre-diabetes“, therefore stopping progression of the disease at this point reduces the risk associated with high blood pressure, abnormal cholesterol, heart attack and stroke, as well as chronic kidney disease.
Insulin resistance is where the cells of the body ignore signals from the hormone insulin which tell it to move glucose from broken down from digested food — from the blood and into the cells. When someone is insulin resistant, blood glucose stays higher than it should be, for longer than it should be, which is called hyperglycemia. When there are insufficient receptors on muscle cells to move glucose out of the blood after eating, this is called insulin resistance. It isn’t known whether insulin resistance comes first or hyperinsulinemia (high circulating levels of insulin) does. It is believed that it may be different depending on the person[3].
Assessing Insulin Resistance and β-cell Function
Homeostatic Model Assessment (HOMA-IR) estimates the degree of insulin resistance (IR), β-cell function (the cells of the pancreas that produce insulin) and insulin sensitivity (%S) and is determined from the results simultaneous fasting blood glucose test and a fasting insulin test.
Alternatively, HOMA-IR can be determined from a fasting blood glucose test and a fasting C-peptide test [3]. C-peptide is released in proportion to insulin, so it can be used to estimate insulin. Individual results are best compared to local population cut off values for HOMA1-IR [4] (1985) or the updated HOMA2-IR [5] (1998) .
HOMA1-IR is defined as [fasting insulin (µU/mL)í— fasting glucose (mmol/L)]/22.5 [4] and HOMA2-IR is calculated using an online HOMA2 calculator released by the Diabetes Trials Unit, University of Oxford available at http://www.dtu.ox.ac.uk/homacalculator/index.php (updated January 8, 2013).
The original HOMA1-IR equation proposed by Matthews in 1985 [4] was widely used due to its simplicity, however it was not always reliable because it did not consider the variations in the glucose resistance of peripheral tissue and liver, or increases in the insulin secretion curve for blood glucose concentrations above 10 mmol/L (180 mg/dL) or the effect of circulating levels of pro-insulin. [6]. The updated HOMA2-IR computer model [5] has been used since 1998 and corrects for these.
Cut-off for insulin resistance using the original Matthews values (1985) [4] for HOMA-IR ≥ 2.7
Insulin sensitive is considered less than 1.0
Healthy is considered 0.5-1.4
Above 1.8 is early insulin resistance
Above 2.7 is considered significant insulin resistance
Cuff-off values for insulin resistance using the HOMA2-IR calculator (1998) [5] is HOMA2-IR ≥ 1.8. Three population based studies found the same or very close cut-offs applied, including a 2009 Brazilian study [7] which found HOMA2-IR ≥ 1.8, a 2014 Venezuelan study [8] which found HOMA2-IR ≥ 2.0 and a 2014 Iranian study [9] which found HOMA2-IR ≥ 1.8.
Use of HOMA-IR to Assess Insulin Resistance and β-cell Function in the Individual
HOMA-IR has been used to assess Insulin Resistance (IR) and β-cell function as a one-off measures in >150 epidemiological studies of subjects of various ethnic origins, with varying degrees of glucose tolerance [10].
In the Mexico City Study which used single glucose-insulin pairs (not the mean of three samples at 5-min intervals) [11], β-cell function and Insulin Resistance were assessed using HOMA-IR in ~1500 Mexicans with normal or impaired glucose tolerance (IGT) (27). Subjects were followed up for 3.5 years for the incidence of diabetes and to examine any possible relationship with baseline β-cell function and IR. At 3.5 years, ~4.5% of subjects with normal glucose tolerance at baseline and ~23.5% with impaired glucose tolerance at baseline had progressed to type 2 diabetes. That is,the development of diabetes was associated with higher HOMA-IR at baseline.
The use of HOMA-IR on an individual basis enables clinicians to quantify both the degree of insulin sensitivity and β-cell function on assessment — before the person makes any dietary changes. Once the individual understands the significance of their HOMA-IR results, it can provide significant motivation for them to make dietary changes to slow– or prevent the progression toward abnormal glucose tolerance, or type 2 diabetes. When HOMA-IR is repeated 6 months into dietary changes, it provides significant feedback to the individual regarding the effectiveness of of dietary changes, and the motivation to continue.
“HOMA-IR can be used to track changes in insulin sensitivity and β-cell function longitudinally in individuals. The model can also be used in individuals to indicate whether reduced insulin sensitivity or β-cell failure predominates.[10]
Measuring Hyperinsulemia
Detection of hyperinsulinemia (high circulating levels of insulin) can occur using an Oral Glucose Sensitivity Index (OGIS) where available, or with a 2-hr Oral Glucose Tolerance Test (2-hr OGTT) with simultaneous assessors of insulin. These are tests where a fasting person drinks a known amount of glucose (usually 75 g or 100 g of glucose) and their blood sugar and insulin values are measured before the test starts (baseline, while fasting) and at 2 hours. An additional assessor of blood glucose and insulin can be requested at 1 hour which is very helpful for detecting abnormalities that would missed if only assessing at fasting and at 2 hours. In the OGIS, both blood glucose and blood insulin levels are measured at baseline (fasting), at 120 minutes and at 180 minutes[3].
Final thoughts…
As mentioned at the start of this article, abnormalities in insulin, including insulin resistance and/or hyperinsulinemia begin to occur as much as 20 years before a diagnosis of type 2 diabetes — while blood sugar results are still normal. That is when we need to diagnose abnormalities!
If we simply monitor fasting blood glucose, we will miss that someone’s pancreas may be overworking.
Even if we monitor fasting blood glucose and glycated hemoglobin (HbA1C), we can miss that someone’s pancreas is overworking by constantly producing too much insulin.
Furthermore, even if a standard 2 hour Glucose Tolerance Test is run and the person’s fasting blood glucose and 2 hour glucose level after a load is measured, we still can miss that someone’s pancreas is being pushed way too hard if those values appear normal at baseline and at the end of the test.
By running a 2 hour Glucose Tolerance Test with simultaneous glucose and insulin at baseline (fasting), 30 minutes or 1 hour, and at 2 hours we can observe the pancreas being pushed way too hard and implement dietary changes to avoid further β-cell damage or β-cell death.
In British Columbia, the cost of a standard 2 hour Oral Glucose Tolerance Test is $11.82 before tax and $13.36 with HST.
Each additional glucose assessment is $3.48 before tax and $3.93 after tax.
Each insulin assessment costs $32.82 before tax and $37.09 after tax, so a 2 hour Oral Glucose Tolerance Test with additional glucose assessor at 1 hour and 3 insulin assessors at fasting, 1 hour and 2 hour costs as follows;
2 hour Oral Glucose Tolerance (fasting, 2 hours) = $ 13.36 with HST
additional glucose at 1 hour = $ 3.93 with HST
3 insulin assessors at fasting, 1 hour, 2 hours = $111.27 with HST
TOTAL = $128.56 with HST
When there are clinical reasons to suspect that a person may be insulin resistant and/or hyperinsulinemic and assessment of simultaneous glucose and insulin function can provide sufficient motivation for individuals to implement dietary changes that can prevent progression to type 2 diabetes, is this testing not worth <$130?
NOTE (March 9, 2021): Some family medicine doctors won’t order tests to assess insulin along with glucose in order to “save healthcare system dollars” — but instead will send their patient to an endocrinologist which costs the system ~$300 before any tests are run. Why? In parts of Canada, if audited, family medicine physicians have to re-pay for preventative tests (which are deemed “unnecessary”). Self-paying for these tests is an option to consider.
If you would like to know about the services that I offer, please click on the Services tab to learn more and if you have questions related to these, please send me a note using the Contact Me form located on the tab above and I will reply as I am able.
LEGAL NOTICE: The contents of this blog, including text, images and cited statistics as well as all other material contained here (the ”content”) are for information purposes only. The content is not intended to be a substitute for professional advice, medical diagnosis and/or treatment and is not suitable for self-administration without the knowledge of your physician and regular monitoring by your physician. Do not disregard medical advice and always consult your physician with any questions you may have regarding a medical condition or before implementing anything you have read or heard in our content.
References
Sagesaka H, S.Y., Someya Y, et al, Type 2 Diabetes: When Does It Start? Journal of the Endocrine Society, 2018. 2(5): p. 476-484.
Mechanick JI, G.A., Grunberger G, et al, Dysglycemia-Based Chronic Disease: an American Association of Clinical Endocrinologists Position Paper. Endocrine Practice, 2018. 24(11): p. 995-1011.
Crofts, C., Understanding and Diagnosing Hyperinsulinemia. 2015, AUT University: Auckland, New Zealand. p. 205.
Matthews, D. R; Hosker, J. P; Rudenski, A. S; Naylor, B. A; Treacher, D. F; Turner, R. C; “•Homeostasis model assessment: insulin resistance and β-cell function from fasting plasma glucose and insulin concentrations in man”–; Diabetologia; July, 1985; Volume 28, Number 7: Pp 412-419
Levy JC, Matthews DR, Hermans MP. Correct homeostasis model assessment (HOMA) evaluation uses the computer program. Diabetes Care. 1998;21:2191—2192
Song YS, Hwang Y-C, Ahn H-Y, Comparison of the Usefulness of the Updated Homeostasis Model Assessment (HOMA2) with the Original HOMA1 in the Prediction of Type 2 Diabetes Mellitus in Koreans, Diabetes Metab J. 2016 Aug; 40(4): 318—325
Geloneze B, Vasques AC, Stabe CF et al, HOMA1-IR and HOMA2-IR indexes in identifying insulin resistance and metabolic syndrome: Brazilian Metabolic Syndrome Study (BRAMS), Arq Bras Endocrinol Metabol. 2009 Mar;53(2):281-7
Bermíºdez V, Rojas J, Martínez MS et al, Epidemiologic Behavior and Estimation of an Optimal Cut-Off Point for Homeostasis Model Assessment-2 Insulin Resistance: A Report from a Venezuelan Population, Int Sch Res Notices. 2014 Oct 29;2014:616271
Tohidi M, Ghasemi A, Hadaegh F, Age- and sex-specific reference values for fasting serum insulin levels and insulin resistance/sensitivity indices in healthy Iranian adults: Tehran Lipid and Glucose Study, Clin Biochem. 2014 Apr;47(6):432-8
Wallace TM, Levy JC, Matthews DR, Use and Abuse of HOMA Modeling, Diabetes Care 2004 Jun; 27(6): 1487-1495. https://doi.org/10.2337/diacare.27.6.1487
Haffner SM, Kennedy E, Gonzalez C, Stern MP, Miettinen H: A prospective analysis of the HOMA model: the Mexico City Diabetes Study. Diabetes Care19:1138—1141, 1996
Much of the time in podcast interviews and in articles, I highlight the particular challenges that women face, especially when it comes to losing fat without losing muscle, but women aren’t my only clients. I also help healthy middle aged— and older men who want to lose weight and gain muscle, and young men who want to gain muscle and shed excess fat, as well as those who are metabolically unwell and who have much weight to lose. The amount of protein, fat and carbohydrates that is best for each of these groups of people will depend on multiple individual factors; including their age, activity level and whether they are insulin sensitive or insulin resistant and whether they are taking any medications.
Much to the frustration of their women friends, men — whether young, middle aged or older often lose weight fairly easily and it often doesn’t matter whether they add protein or fat, provided they cut their carb intake. If men want to lose body fat however, adding lots of extra dietary fat doesn’t make much sense. Generally women need to be more diligent with respect to how much added fat is in their diet and find reaching their goal easier when focusing on good sources of leaner protein— especially when they are peri- or post-menopausal, when the tendency to lose muscle mass along with body fat is a concern.
One common theme amongst my male clients is that regardless of age, they often want to build muscle along with reducing their body fat but don’t necessarily have lots of time to dedicate to going to the gym. What I’ve noticed in practice is that this often occurs quite naturally provided their muscles are challenged regularly. It doesn’t necessarily need to be engaging in ‘resistance training’ or ‘weight strengthening’ but can be as mundane as engaging in tasks under a weight-bearing load. I’ve seen quite a number of men of all ages who have been able build muscle while losing excess body fat simply by the work that they do in labour jobs, as well as those that spend their leisure time being modestly active in activities such as camping and hunting.
This post documents the progress of one healthy young man in his mid-twenties who initially wanted to follow a low carb lifestyle in order to lose a bit of excess body fat, and who hoped to ‘tone up’ in the process. With his permission, I’ll share what he’s been able to accomplish by changing nothing other than what he ate.
Note: Individual results following this or any dietary plan differ. This article simply documents what one person accomplished and how.
Two years ago, a young man who I’ll call “Nathan” was slightly overweight, with a BMI (body mass index) of 25.6. His height was 5 foot 6 inches-and-a bit-tall and he weighed 160 pounds. He wasn’t what anyone would have described as “overweight”, in fact, he was unremarkably average for his age. Nathan worked as a carpenter, so while he was used to engaging in regular weight-bearing activity it was not what one would think of as extremely demanding.
When I first assessed Nathan, his waist was 37 – 3/4 inches when measured halfway between his lowest rib and the top of his hip bone, his hips were 41 – 1/2 inches and he wore size 32 pants.
The photo on the left is a photo that is fairly close to what he looked liked 23 months ago.
Nathan’s diet was healthy by conventional standards — breakfast was a bowl of whole grain cereal with 2% milk, a cup of coffee with 2% milk and a piece of fruit. Lunch was usually a sandwich or a sandwich and a half made on whole-grain bread which consisted of anything from lean cold cuts or cheese and lettuce, to peanut butter, sliced banana and a drizzle of honey. At lunch, he would usually eat a piece of fruit. Dinner was usually some kind of lean protein with rice or potato or a plate of pasta with sauce, or perogies and sausage, along with some type of salad and usually a cooked vegetable, too. He rarely ate “junk food” — having an aversion to it from having worked at a fast-food restaurant during high school, but tended to enjoy ‘treats’ such as ice cream, a chocolate bar, or a slice or two of pumpkin pie a few times per week. Before bed he would usually have a large glass of chocolate milk, made with 2% milk and some chocolate syrup. There was nothing particularly remarkable about his dietary intake except perhaps that it was incredibly ‘average’, even healthier than most.
Except for being slightly overweight and a little insulin resistant, Nathan was in good health. He wanted to lean out and maybe put on a bit of muscle and while he intended to work out with free weights at home, that never ended up occurring as he worked full time and began attending school two night per week, and studying occupied much of his spare time.
I started Nathan on a moderate low-carb diet and over the first few months we lowered his carbohydrates down to around 50 gm per day, which is usually a ketogenic level for men.
He never counted ‘macros’ (grams of protein, carbs and fat) but rather focused on building his meal around good quality lean protein, the fat that came naturally with his protein source, and plenty of non-starchy vegetables. I encouraged him to eat enough so that at the end of the meal he felt satisfied, but not “stuffed”. When it came to added fat, I explained that if he liked the skin on chicken when it was fresh off the barbecue to go ahead and enjoy it, but if he didn’t really like it if the chicken was was cooked in the oven or on top of the stove, then to eat it without the skin and explained something similar when it came to meat; remove the excess fat trim or ‘fat cap’ before grilling a steak, but then enjoy the steak with the fat that came with it. Nathan rarely added cream, butter or oil at the table, but would be very generous with adding a good quality olive oil on salad. He often topped his salad with pumpkin seeds and a healthy handful of Parmesan curls, and when available a few berries.
Breakfast was almost always some form of eggs (almost always 3) and several slices of cooked breakfast meat or an omelette with fresh veggies and cheese — something he never seemed to tire of. If after his egg and meat breakfast, he was still hungry, he would open a few cans of tuna or salmon and mix them up with a good quality avocado oil mayonnaise and eat that too. He liked a big breakfast because in his work, he wasn’t always able to stop to eat, but when he did, lunch was almost always a reheated container of leftovers from a supper meal which included protein and non-starchy vegetable. Dinner was usually 6 oz or more of some kind of meat, fish or poultry along with non-starchy vegetables (cooked and/or raw) and the occasional serving of whole-food carbohydrate in the form of cooked yam, winter squash or a 1/2 cup of berries on top of a mixed green salad. When freshly barbecued burgers were on the menu for dinner, Nathan admitted to eating 3 or 4 of those, wrapped in a lettuce leaf “bun” and topped with a slice of fresh tomato and dill pickle, along with a big side salad, as described above. If he could, he’d forego the salad and eat just burgers wrapped in lettuce and stuffed with pickle (and skip the tomato). His food wasn’t complicated, but it was real, whole food with the simplest of preparation. Nathan was encourage to eat until he was satiated and to avoid snacking between meals or after dinner, with the exception of an ounce or two of 72% dark chocolate immediately after dinner. Admittedly, he often at more than an ounce or two of dark chocolate on the weekend and sometimes indulged in some “low carb” ice cream.
Even though he had a scale at home, Nathan literally never weighed himself. He bought smaller sized pants and shirts after about 6 months, when adding more holes to his belt wasn’t enough. He kept doing the same amount of physical activity as he did before (mostly at his job) but noted how much easier those tasks became and how he could carry more without effort and without getting more tired. After almost 2 years of adopting a low carbohydrate lifestyle, Nathan asked me for a “weigh in” and to have me take measurements, which provided some very interested data. Most of the weight loss occurred in the first 6 months, but according to Nathan the muscle changes occurred gradually in the months following. With his permission, I am sharing those here.
In 23 months of doing nothing different but eating low carb (mostly higher lean animal protein with moderate fat), this was Nathan’s progress;
Weight lost: 22 pounds
Waist (inches): -6.5 inches
Hips (inches): -5.5 inches
Body Fat: from 15.7% to 7.7%
Nathan is not the type person who is interested in posting photos of himself without a shirt, but he certainly could do so with pride. He is now muscular with a defined chest and abdominal muscles, with little discernible fat. His BMI is 22.1, and for his height his muscle to fat ratio is excellent. Nathan didn’t deliberately “work out” in any way— only continued in his trade as a carpenter, while eating low carb, higher protein and the fat that came naturally with his protein source. I’ve observed other male clients to have made impressive progress in weight loss and muscle gain when combining a low carb diet with resistance training, but what I found quite remarkable with Nathan was the change in his body composition given the only thing he changed was how he was eating!
If you would like to learn more about how I can help you or a family member achieve and maintain a healthy body weight while building and/or toning muscle, please send me a note using the Contact Me form located on the tab above.
LEGAL NOTICE: The contents of this blog, including text, images and cited statistics as well as all other material contained here (the ”content”) are for information purposes only. The content is not intended to be a substitute for professional advice, medical diagnosis and/or treatment and is not suitable for self-administration without the knowledge of your physician and regular monitoring by your physician. Do not disregard medical advice and always consult your physician with any questions you may have regarding a medical condition or before implementing anything you have read or heard in our content.
Last week I was interviewed by Dr. Siobhan Key, an MD that specializes in obesity medicine who founded a weight management group called Weight Solutions for Physicians that provides weight management coaching to fellow physicians. She is certified by the American Board of Obesity Medicine, and is a member of the Obesity Medicine Association (OMA), the Doctors of BC and the Canadian Medical Association.
Siobhan struggled with her own weight in the past and understands the specific challenges that physicians face being on-call as well as having busy practice and home lives.
In this interview I provide tips for people seeking to lose weight on a low carbohydrate diet, as well as practical ideas for getting whole food meals for people that lack the time to cook.
I hope you enjoy this interview and be sure to visit iTunes to leave a review.
If you would like to know more about the low carbohydrate and ketogenic services I offer, please click on the Services tab and if you have questions related to those, please feel free to send me a note using the Contact Me form located on the tab above.
LEGAL NOTICE: The contents of this blog, including text, images and cited statistics as well as all other material contained here (the ”content”) are for information purposes only. The content is not intended to be a substitute for professional advice, medical diagnosis and/or treatment and is not suitable for self-administration without the knowledge of your physician and regular monitoring by your physician. Do not disregard medical advice and always consult your physician with any questions you may have regarding a medical condition or before implementing anything you have read or heard in our content.
This morning, Dr. Joe Schwarcz, Professor of Chemistry from McGill University and popular radio show host released a follow-up to last week’s opinion article and video that was published in the Montreal Gazette on the cardiovascular risks of a keto diet; this one on the known benefits of low-carb keto diets.
Schwarcz begins by fondly reminiscing about going to the circus with his mother when he was about 7 or 8 years old and the memories of the snack that she packed for him of crusty Hungarian bread, slathered with butter and topped with green bell pepper. He said that he’s loved it ever since, but “now we question such snacks. Why? Because of the carbohydrate content of the bread”.
“I’ve been looking into this for quite a while. There is really a plethora of papers and information that floods us about the keto diets; the very low carbohydrate diets”.
To his credit, Dr. Schwarcz acknowledged (possibly as a result of my written response to his article of last week in the Montreal Gazette) that there isn’t just one “keto diet” (singular) but several very low carbohydrate diets (plural) .
Schwarcz reiterates;
“I would have thought that by having all of that fat in the diet that risk levels for certain cardiovascular factors would go up, but really there isn’t really that much alteration in these factors”.
Low-Carb “Keto” Diets and Diabetes
Transitioning from the lack of cardiovascular risks associated with low-carb keto diets, Schwarcz adds;
“When it comes to Diabetes the information is really overwhelming to the benefit of these low carb diets. There are people — Type 2 Diabetes sufferers, who have been able to give up their medication by following a stringent, low carbohydrate diet.”
Schwarcz dismisses anecdotal reports of people’s “brain fog” resolving and possible benefits for cancer, Parkinson’s disease and Alzheimer’s disease as not being scientifically based but is unequivocal about the known benefits;
“What we do know is that weight loss can be very significant on a low carbohydrate diet and as I said — surprisingly, without any significant risk factors.”
Schwarcz continues;
“On the other hand, the longest terms studies that I’ve seen which were really properly controlled have only been about six months, and that really isn’t long enough.”
NOTE: In this case, Dr. Schwarcz is referring only to randomized, controlled double blind studies — excluding the data from long term studies of other types.
“We also know from dietary studies that after about a year, it doesn’t much matter what diet you’re on when it comes to weight loss — whether it’s low fat, whether it’s low carb, the results tend to be the same as long as you’re cutting out some calories.”
NOTE: While this may be true, what Schwarcz neglects to mention is that the major difference is that in a calorie-restricted low-fat diet, people are deliberately restricting food intake, often feeling hungry — whereas in a low carbohydrate diet, people naturally feel less hungry due to the satiety (hunger-reducing effect of protein and fat) which results in them eating less. In one case people are purposely restricting calories in the the other case, they don’t feel as hungry so they naturally eat less.
Schwarcz reiterates;
“However, for people who are afflicted with Diabetes, I think there is no question that the very low carb diets are worth trying.”
Towards the end of the video Dr. Schwarcz reflects on his childhood snack of crusty Hungarian bread, slathered with butter and topped with a quarter of a green bell pepper and admits that he looks askew at this snack.
“I admit that I’ve been eating less bread — I haven’t cut it out because I don’t think I need to do that, but I’m eating less.”
Schwarcz adds that for those who are gravitating towards a low carbohydrate diet, they can opt instead to eat bell pepper with a dollop of hummus with tahini (ground sesame seeds) or raw broccoli dipped in a bit of hummus.
“It tastes good! I think it is possible to cut down on the bread!”
Since Dr. Schwarcz is presumably not Diabetic and has all the nostalgia of memories of the circus as a child, he concludes the video by happily biting into a slice of crusty Hungarian bread that’s been slathered with butter and topped with a quarter of a green bell pepper…for nostalgia reasons, of course!
Bon appetit, Dr. Schwarcz!
If you would like to know more about the low carb and ketogenic services I offer, please click on the Services tab, and if you have questions related to those, please feel free to send me a note using the Contact Me form located on the tab above.
LEGAL NOTICE: The contents of this blog, including text, images and cited statistics as well as all other material contained here (the ”content”) are for information purposes only. The content is not intended to be a substitute for professional advice, medical diagnosis and/or treatment and is not suitable for self-administration without the knowledge of your physician and regular monitoring by your physician. Do not disregard medical advice and always consult your physician with any questions you may have regarding a medical condition or before implementing anything you have read or heard in our content.
INTRODUCTION: It is not uncommon for people to post their “before” pictures after they’ve reached their goal weight to show how much they’ve accomplished, but why on earth did I post pictures of myself when I was still obese and metabolically unwell? That’s a good question.
There’s a saying that “it is not the healthy who need a physician, but the sick” and while people will consult with Dietitian for many different reasons, those who are significantly overweight find it very difficult to take that first step when it is weight loss they’re seeking. Why?
People feel ashamed of being overweight or obese.
Oftentimes, overweight people feel that they are assumed to be undisciplined or lazy — that their condition is their own fault. They have heard over and over again that;
“If only they would eat less and move more they wouldn’t be so fat!”
or
“If only they ate ‘real food’ instead of ‘junk food’ they would be so much slimmer!”
Really?
If it were that simple, why would 1 in 4 Canadians (and 1 in 3 Americans) be obese?
Because it’s not that simple.
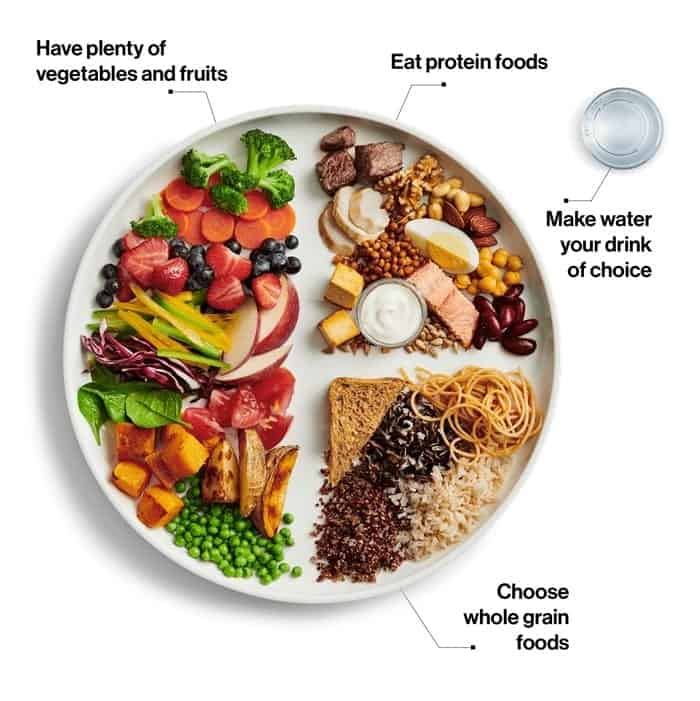
It’s been my experience that many overweight people and obese people often eat what has traditionally been thought of as a “healthy diet”; plenty of fruit and vegetables, low fat dairy products and only brown bread, rice and pasta and they feel frustrated and ashamed of being what is perceived as “a failure”.
Some have told me that sometimes their own healthcare providers have given them the impression that they must be being untruthful about what they’ve been eating because surely if they were eating the way they say, they would have been losing weight. In other words, they are not believed, or in stronger words, they are thought to be lying or at least incapable of accurately assessing how much they are ‘really’ eating.
Why would an overweight or obese person seek help in losing weight from a healthcare professional that views them as undisciplined, lazy or unrealistic about what they are eating?
They don’t.
Often people will try various diets that they read about online because no one will see them try and more importantly no one will see when they give up, feeling once again that they are ‘failures’.
I don’t think that overweight and obese people are failures. I believe many are doing what they’ve been told is the “right thing” but for different reasons. it is not working for them. My role as a Dietitian is to help people understand what isn’t working and to enable them to be successful — without judgement.
It is for just such people that I posted my “fat pictures” online before I started to lose weight!
I wanted people to see me as no different and certainly no better than they are, because I’m not. Sure, I have an undergraduate and graduate degree in nutrition, but I don’t get any “free passes” when it comes to losing weight and turning around my own metabolic health. I needed to do it just like everybody else.
I’ve lived each step of my weight loss and metabolic health recovery journey in public (logged under “A Dietitian’s Journey”) because I wanted people to experience in “real time” my frustrations and my victories. I wanted people to see that the path is not linear; that there are twists and turns and stalls, but yes it is possible to be successful. It just takes time and some dedicated work to get well and achieve a healthy body weight.
I look at it this way;
If it took me 20 years to become metabolically unhealthy and obese, what’s a couple of years to become metabolically healthy and normal weight?
Everyone’s weight loss and health restoration journey will be different.
There are no “magic bullets” or “super diets”— but there are different dietary and lifestyle options that can be pursued for success.
I can help.
If you would like to learn more about how I can help you or a family member achieve and maintain a healthy body weight and metabolic health, please send me a note using the Contact Me form located on the tab above.
To our good health!
Joy
NOTE: This post is classified under “A Dietitian’s Journey” and is my personal account of my own health and weight loss journey that began on March 5, 2017. Science Made Simple articles are referenced nutrition articles, and can be found here.
LEGAL NOTICE: The contents of this blog, including text, images and cited statistics as well as all other material contained here (the ”content”) are for information purposes only. The content is not intended to be a substitute for professional advice, medical diagnosis and/or treatment and is not suitable for self-administration without the knowledge of your physician and regular monitoring by your physician. Do not disregard medical advice and always consult your physician with any questions you may have regarding a medical condition or before implementing anything you have read or heard in our content.
This recipe is posted as a courtesy to those following a variety of low-carb diets (not necessarily Meal Plans designed by me). This recipe may or may not be appropriate for you.
Most have made “fathead pizza” — with it’s decadent cheese-rich crust and have tried their hand at it’s more virtuous cousin, “cauliflower pizza”, yet still wish there was such a thing as an authentic yeast-raised crust made with low carb-friendly ‘flour’. Now there is!
Don’t get me wrong. I really enjoy Crisp Keto Pizza, which is my yeasty adaptation of the familiar fathead dough, but I really find dough made from cheese just too rich. My Crispy Cauliflower Pizza is also very good, but I longed for regular pizza crust made from a low-carb friendly ‘flour’ that had a wonderful yeasty smell as it’s rising and baking and that had the taste and texture of real pizza.
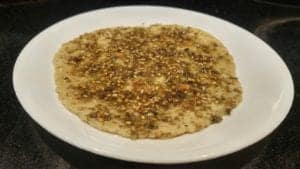
This is real yeast-raised thin-crust pizza with the taste and texture I’d been missing!
Individual Yeast Raised Low Carb Pizza
Ingredients
1 -1/3 cup almond flour
1 1/2 tsp kosher salt
1 tsp baking powder
1 tbsp traditional yeast
1/8 tsp sugar (required to feed the yeast)
6 tbsp psyllium husk powder*
4 egg whites
½ cup lukewarm water
Instructions
*Place the whole psyllium husk in a clean, dry coffee grinder and pulse several times until it’s a fine powder. This is important as using regular psyllium husk will result in the wrong texture.
Place the lukewarm water in a Pyrex measuring cup, add the little bit of sugar and sprinkle the yeast on top and let it ‘proof’ (multiply and foam) for 10 minutes.
3. In the bowl of a food processor, add the almond flour, powdered psyllium powder, baking powder and salt and pulse until well mixed.
4. Add the egg whites and then add the foamed yeast mixture and pulse the food processor until the dough begins to come together, then pulse the food processor a few more times until it forms a ball on the blade.
5. Remove the dough from the food processor and then knead it a few times until it forms a smooth ball. Place the dough on a clean work surface, cover it with a cotton tea towel and let it rest and rise for 15-20 minutes minutes before beginning to make the pizza. It should look slightly puffy and risen.
6. Preheat a stick proof skillet to a medium-high heat and cut the ball of dough in half and then each half in 1/4 so that there are eight sections.
7. Roll each section into a 1″ ball.
8. Lining a tortilla press with a piece of heavy plastic**, place one of the 1″ balls (it will continue to rise, so may be slightly larger at this point!) in the press and press well until it is about 5″ round, but not too thin.
**If you don’t have a tortilla press, it can be rolled out between sheets of heavy plastic or parchment paper until each piece of dough is 5-inches in diameter.
**Note: I cut open a large freezer weight zipper-style bag to use in the tortilla press when pressing the dough. By peeling one side open, it makes it easy to peel off the other side before transferring the dough to the preheated skillet
9. Immediately transfer the pressed dough onto the preheated non-stick skillet and bake for ~2-3 minutes then flip it over using a spatula and cook until “just” cooked (maybe another 10-15 seconds, maximum.
10. Set aside each of the pre-baked pizza crusts on a cooling rack.
11. Preheat oven to 400 degrees F. Have the top rack of the oven in the middle (not too close to the broiler element).
12. Dress and assemble your pizza to taste. I used homemade pizza sauce, grated mozzarella cheese, sliced turkey pepperoni and anchovy fillets (yes, I like them!) but toppings can be according to your imagination and what you have on hand.
13. When all the pizzas are assembled, change the setting on the stove to “broil” and place the two baking pans with the dressed pizzas in the oven and allow to broil until bubbly. Keep an eye on them because they can go from perfect to burnt in no time.
14. Remove the baking pans and place on cooling racks for a few minutes, then serve.
15. Serve and enjoy!
Macros (per plain crust)
Energy: 255 kcals Protein: 12.5 g Total Carbs: 22.4 g – Fiber: 11.7 g = Net Carbs: 10.8 g* Fat: 3.3 g
LEGAL NOTICE: The contents of this blog, including text, images and cited statistics as well as all other material contained here (the ”content”) are for information purposes only. The content is not intended to be a substitute for professional advice, medical diagnosis and/or treatment and is not suitable for self-administration without the knowledge of your physician and regular monitoring by your physician. Do not disregard medical advice and always consult your physician with any questions you may have regarding a medical condition or before implementing anything you have read or heard in our content.
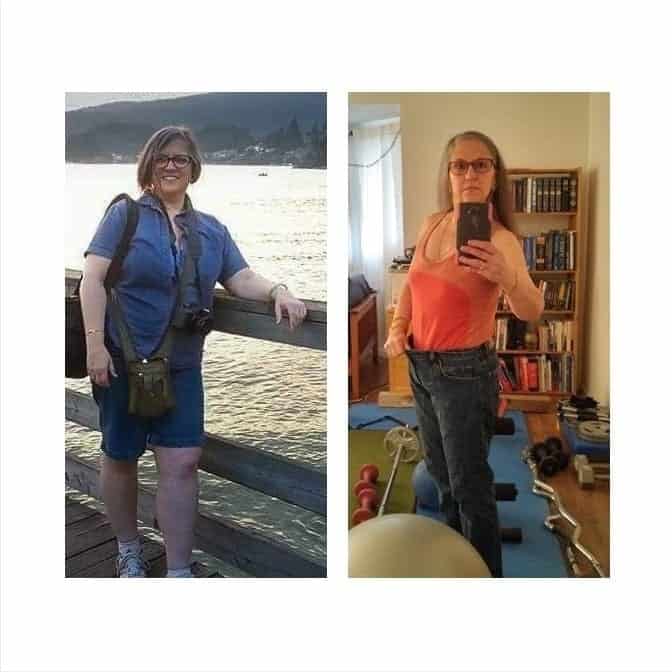
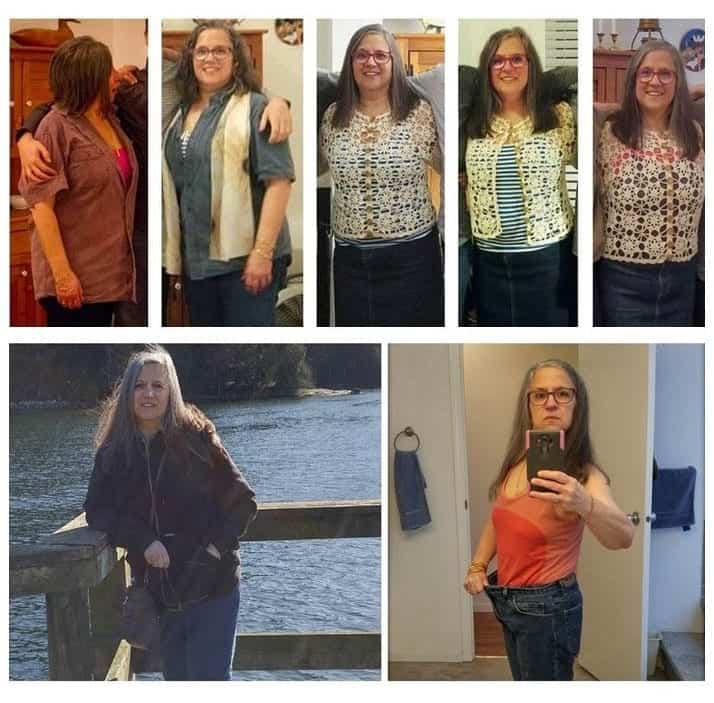
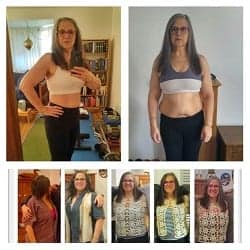
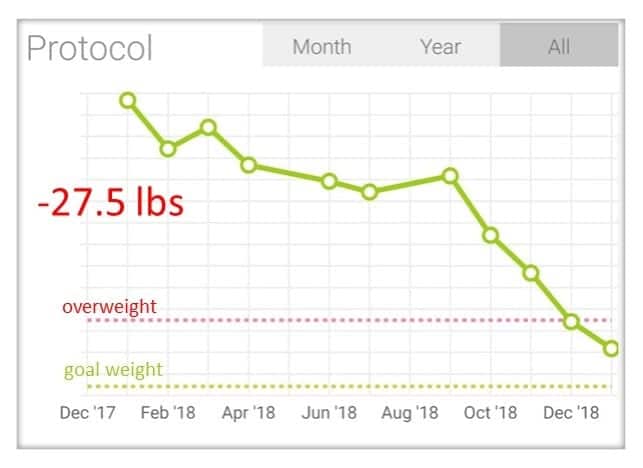
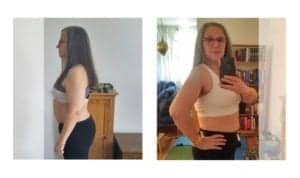
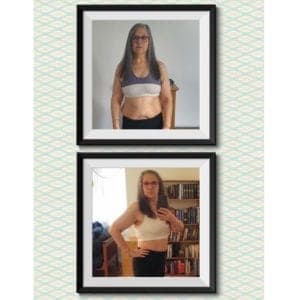
Today, a photo memory popped up on Facebook from a year ago which was a composite photo from the 2 1/2 years previous to that along with an updated photo at the bottom from that day, February 12 2018. At first I thought I hadn’t changed much from a year ago until I added a “bathroom selfie” that I took on Sunday, beside it. Without a doubt, there has continued to be significant progress. This post is about my weight loss and non-scale progress to date.
My weight loss progress to date
All of the photos in the composite were taken with the same cell phone, so while they aren’t great shots they document my journey to date — A Dietitian’s Journey.
The first photo from the left at the top, with me in the plum shirt was taken April 2015, around the time a retired-physician friend came to talk to me about the therapeutic use of a low carbohydrate diet for reducing the symptoms of Type 2 Diabetes and for weight loss.
The second photo. where I am wearing a ivory silk scarf was taken in September 2015, shortly after I began eating a liberal lower carb diet of ~130 g carbohydrate per day.
The third photo in the middle was taken exactly a year after the second one, in September 2016. While it’s clear I had lost weight, the crocheted cardigan I was wearing was still quite stretched.
The fourth photo at the top was taken in April 2017, only a month after I had begun following a low carbohydrate lifestyle on March 5, 2017 — which in three weeks from today will be two complete years. I happened to be wearing the same outfit as I had the previous September because at that weight I had no interest in buying new clothes and didn’t go out much. Even after only a month of eating low carb, my face, neck and abdomen were beginning to show signs of progress.
In the fifth photo taken September 2017, I deliberately wore the same cardigan and skirt that I had randomly ended up wearing in the previous two photos — with the identical camisole in a different colour, underneath. What can’t be seen easily unless one looks at the very bottom of the crocheted cardigan, is the space between it and me that was previously filled with my belly fat. At this point there was a space where fat used to be! I still had ~ 25 more pounds to lose to reach a waist circumference that was 1/2 my height but I knew this was entirely achievable and maintainable.
The photo on the left at the bottom was taken exactly a year ago today, February 12, 2018. That’s why it popped up in “memories” on Facebook. When I first saw it, I thought looked pretty much the way I do now until I decided to put the bathroom selfie from Sunday beside it. Admittedly, the 20 additional pounds I have lost in the last year “shows”.
I am 2 pounds from my ‘goal weight’ which I am pretty sure I will reach by three weeks from now, on my 2-year anniversary of beginning my journey.
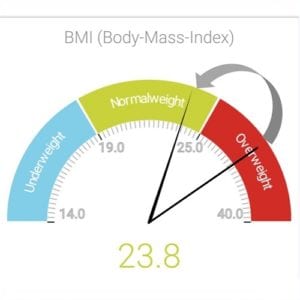
I am in remission of Type 2 Diabetes and have an ideal waist-to-height ratio. My lab tests reflect my progress as much as as the reflection in the mirror and best of all, I feel great. I shoveled snow for an hour yesterday and since we had a second snow storm, I did it all over again this morning — without getting out of breath or even sweaty! Two years ago, I could barely walk around the track at Town Center without being totally out of breath! Check out this video to see what I looked and sounded like when I started! There have been huge changes.
This “journey” has never been about losing weight for vanity’s sake; but about reclaiming my health from chronic illness (Type 2 Diabetes and hypertension) that was brought about by eating what most would see as a very “healthy diet” but that was way too high in carbohydrates for someone as metabolically unwell as I was.
As I’ve written about in previous journal entries, I had two girlfriends my age drop dead within 3 months of each other from similar health conditions as I had and when I took my blood pressure and blood sugar on March 5 2017, I knew that if I didn’t change my lifestyle, I could literally be next. I changed my lifestyle two years ago because my life literally depended on it.
When I look in the mirror each day I am reminded that two of my girlfriends no longer have the opportunity that I do; to do things differently. I am fortunate and blessed and don’t take my reclaimed health for granted.
If you have questions about how a low carbohydrate approach may be helpful for you to achieve weight loss, or put your own high blood sugars or Type 2 Diabetes into remission, then please send me a note using the Contact Me form located on the tab above.
For more information about the hourly consultations and packages I offer, please check under the Services tab, or in the Shop.
To our good health!
Joy
NOTE: This post is classified under “A Dietitian’s Journey” and is my personal account of my own health and weight loss journey that began on March 5, 2017. Science Made Simple articles are referenced nutrition articles, and can be found here.
LEGAL NOTICE: The contents of this blog, including text, images and cited statistics as well as all other material contained here (the ”content”) are for information purposes only. The content is not intended to be a substitute for professional advice, medical diagnosis and/or treatment and is not suitable for self-administration without the knowledge of your physician and regular monitoring by your physician. Do not disregard medical advice and always consult your physician with any questions you may have regarding a medical condition or before implementing anything you have read or heard in our content.
This morning, the English language newspaper, the Montreal Gazette published a special article written by Dr. Joe Schwarcz, Professor of chemistry from McGill University titled “The Right Chemistry: Keto diets work, but is there a catch?”, that had an accompanying video.
The article began;
“There is little doubt that cutting way back on carbs results in weight loss. But how does all that fat impact cardiovascular risk factors?”
This is a very good question, however it is incorrectly based on the assumption that a “keto diet” is necessarily very high in fat, especially saturated fat, something which is not necessarily the case.
Dr. Schwarcz stated in the article in the Montreal Gazette that on a “keto diet” there is no bread, pasta, cereal, potatoes, carrots, rice, fruit or beer but that one can;
“gorge on fish, butter, eggs, high-fat cheese, whipped cream, coconut oil and meat to your heart’s delight.”
“There is no one ”keto diet”, but many variations of ketogenic diets that are used for different therapeutic purposes.
Some therapeutic ketogenic diets are used in the treatment of epilepsy and seizure disorder and are extremely high in fat. Other types of therapeutic ketogenic diets are used in the treatment of various forms of cancer (those that feed on glucose), such as brain cancer. There are ketogenic diets that are used in the treatment of Polycystic Ovarian Syndrome (PCOS), as well as for weight loss and for increasing insulin sensitivity in those with Type 2 Diabetes and insulin resistance.
Even among those using a nutritional ketogenic diet for weight loss and to increase insulin sensitivity, there is no one ”keto diet”.
There are ketogenic diets with a higher percentage of fat than protein, with a higher percentage of protein than fat and mixed approaches which may have different ratios of protein to fat — depending on whether the individual is in a weight loss phase or a weight maintenance phase.
There are as many permutations and combinations as there are people following a keto diet for these reasons.
What makes a diet ketogenic (or keto) is that the amount of carbohydrate relative to the amount of protein and fat results in theutilization of fat as a primary fuel source rather than carbohydrate. “
Assuming that the specific type of “keto diet” that Dr. Schwarcz is referring to is one where one;
(2) indulges in foods high in fat, such as fish, butter, eggs, high-fat cheese, whipped cream, coconut oil and meat,
it is a very appropriate question to ask as to what effect does this type of keto diet have on cardiovascular risk factors.
Note: Most keto diets used for weight loss allow fruit as berries, such as raspberries, strawberries, blueberries, blackberries as well as those fruit that we often think of as vegetables, including tomato, avocado, cucumbers, lemon and lime. Dr. Schwarcz raised a concern in the video that not eating fruit limits one’s access to the important antioxidants in fruit, which for the most part is incorrect.
The article states that;
“There is little doubt that cutting way back on carbs results in weight loss. The question is, why?
The body’s main source of energy is glucose, generally supplied by starches and sugars [i.e. carbs] in the diet. If consumption of these carbohydrates is drastically reduced, below about 50 grams a day, energy has to be derived from an alternate source. At first, the 65 or so grams of glucose the body needs per day are produced from amino acids, sourced from proteins. But this process itself has a high energy requirement, and furthermore, the body is not keen on using up proteins that are needed to maintain muscle integrity. Fortunately, there is a backup system that can swing into action.
The liver begins to convert fats into ”ketone bodies,” namely beta-hydroxybutyrate, acetoacetate and acetone. These are then shuttled into the mitochondria, the cells’ little energy factories, where they are used as fuel. At this point the body is said to be in ”ketosis,” with excess ketones being excreted in the urine.”
Great explanation!
The article raises a few excellent points;
The article states that the “usual argument” for the more efficient weight loss associated with extremely low carb diets as compared to low fat diets is that (1) low carb diets produce a metabolic advantage because a lot of calories are needed to convert proteins to glucose. The article adds that not everyone agrees with this premise and states that others suggest that (2) ketone bodies have either a direct appetite suppressant effect or that they (3) alter levels of the respective appetite stimulating and inhibiting hormones, ghrelin and leptin. Lastly, the article states that some argue that (4) ketogenic diets lead to a lower calorie intake which the article’s author believes is “due to the greater satiety effect of protein”.
“No long-term studies of keto diets”
Correctly the article states that;
“There are numerous studies published over the last 20 years that have compared low-fat diets to low-carb diets with the overall conclusion that the low-carb diets are more effective in terms of weight loss, at least in the short term.
…but incorrectly adds;
“Unfortunately, there are no long-term studies of keto diets.”
While there have been 3 long-term clinical trials (2 years) published over the past 10 years involving low carb diets, unfortunately as documented in my earlier article, none of these involved research groups that actually ate a low carbohydrate diet. There is, however the recent two-year data from the Virta Health’s study that was published this past December 2018 which demonstrated the long term safety of a ketogenic diet and that participants on average;
(1) lost 12.4 kg (28 pounds) in two years; most of which was achieved in the first year maintained with only a slight increase of 2.3 kg (5 pounds) in the second year.
In addition to the weight loss, participants in the Virta Health study;
(2) significantly lowered medication use for Type 2 Diabetes (read more here)
(3) lowered glycated hemoglobin (HbA1C) by a full percentage point at two years (7.7% to 6.7%)
(4) lowered fasting blood glucose from 9.1 mmol/L (164 mg/dl) at the start of the study to 7.4 mmol/l (134 mg/dl ) at two years.
High Fat Keto Diet and Cardiovascular Risk Factors
The article concludes with the initial question as to how a diet “high in fat, such as fish, butter, eggs, high-fat cheese, whipped cream, coconut oil and meat” impacts markers of cardiovascular risk.
“As one would expect, LDL, the ”bad cholesterol,” does go up, although the increase is mostly in the ”large particle” sub fraction that is deemed to be less risky.
Triglycerides, a significant risk factor, actually decrease on a very-low-carbohydrate diet, as does the body’s own production of cholesterol.
Levels of HDL, the ”good cholesterol,” increase.
That is, over the short term, markers of cardiovascular risk doesn’t change to any degree.
What about over the long term?
Unfortunately, the article concludes with;
“the problem is that there are no studies of people who have followed a keto diet long enough to note whatever effect such a diet may have on heart disease.”
(1) LDL cholesterol of the intervention group at the start of the study averaged 2.68 mmol/L (103.5 mg/dl) and at two years was slightly higher as expected, to 2.96 mmol/L (114.5 mg/dl), however this level after 2 years was almost identical to what it was at 1 year; 2.95 mmol/L(114 mg/dl). That is, LDL (mostly the large particle sub-fraction) increased as expected the first year but didn’t continue to rise.
(2) At baseline, HDL cholesterol (“good cholesterol”) of the intervention group averaged 1.11 mmol/L (41.8 mg/dl) and after two years was stable at the same level it had risen to at 1 year, namely 1.28 mmol/L (49.5 mg/dl).
(3) At baseline, triglycerides of the intervention group averaged 2.23 mmol/L (197.2 mg/dl) and at two years was down to 1.73 mmol/L (153.3 mg/dl ), only up slightly for the one year average of 1.68 mmol/L (148.9 mg/dl).
Final Thoughts…
While Dr. Schwarcz seemed to be unaware of the publication of the two-year Virta Health study data in December 2018 that demonstrates both long-term safety and efficacy of a ketogenic diet for weight loss and improvement in metabolic health (including markers of cardiovascular risk), the Montreal Gazette article and accompanying video does indicate that a very high fat ketogenic diet does not adversely impact markers of cardiovascular risk.
If you would like to know more about the low carb and ketogenic services I offer, please click on the Services tab, and if you have questions related to those, please feel free to send me a note using the Contact Me form located on the tab above.
To your good health!
Joy
UPDATE (February 15, 2019): a review of Dr. Schwarcz’ follow up to this article is located here.
LEGAL NOTICE: The contents of this blog, including text, images and cited statistics as well as all other material contained here (the ”content”) are for information purposes only. The content is not intended to be a substitute for professional advice, medical diagnosis and/or treatment and is not suitable for self-administration without the knowledge of your physician and regular monitoring by your physician. Do not disregard medical advice and always consult your physician with any questions you may have regarding a medical condition or before implementing anything you have read or heard in our content.
This recipe is posted as a courtesy to those following a variety of low-carb diets (not necessarily Meal Plans designed by me). This recipe may or may not be appropriate for you.
Low Carb Mediterranean-Style Flatbread
Ingredients
1 -1/3 cup almond flour
1 1/2 tsp kosher salt
1 tsp baking powder
6 tbsp psyllium husk powder*
4 egg whites
½ cup hot water
Instructions
*Place the whole psyllium husk in a clean, dry coffee grinder and pulse several times until it’s a fine powder. This is important as using regular psyllium husk will result in the wrong texture.
In the bowl of a food processor, add the almond flour, powdered psyllium powder, baking powder and salt and pulse until well mixed.
Add the egg whites and hot water and pulse the food processor until the dough forms a mass, then pulse the food processor a few more times until it forms a ball on the blade.
Remove the dough from the food processor and then knead it a few times until it forms a smooth ball. Place the dough in a clean plastic bag and let it rest for a full 15 minutes before beginning to make the flat bread.
Preheat a stick proof skillet to a medium-high heat.
6. Cut the ball of dough in half and then each half in 1/4 so that there are eight 1″ balls.
7. Lining a tortilla press with a piece of heavy plastic**, place one of the 1″ balls in the press and press well until it is the thickness of a standard corn tortilla. Be careful not to press it too thin or some will stick to the plastic when you try to get it off. **If you don’t have a tortilla press, it can be rolled out between sheets of heavy plastic or parchment paper until each piece of dough is 5-inches in diameter.
**Note: I cut open a large freezer weight zipper-style bag to use in the tortilla press when pressing the dough. By peeling one side open, it makes it easy to peel off the other side before transferring the dough to the preheated skillet
8. Immediately transfer the pressed dough onto the preheated non-stick skillet and bake for ~2-3 minutes then flip it over using a spatula and cook until “just” cooked (maybe another 10-15 seconds, maximum.
9. Place on a baking rack for a few minutes to cool (if saving for later). Can be stored in a heavy duty zipper bag and refrigerated for use later.
Special thanks to Viken Basmadjian of Montreal for the recipe.
For Za’atar bread
Brush the top of each baked flatbread with a good quality extra virgin olive oil and sprinkle with a mixture of za’atar (ground thyme, sumac, salt and whole sesame seeds – that sometimes has added marjoram and oregano) and and a little extra sumac(lemony tasting ground berry of a shrub that grows in the Mediterranean and parts of the Middle East) and warm gently before eating.
Macros (per plain flatbread)
Energy: 255 kcals Protein: 12.5 g Total Carbs: 22.4 g – Fiber: 11.7 g = Net Carbs: 10.8 g Fat: 3.3 g
LEGAL NOTICE: The contents of this blog, including text, images and cited statistics as well as all other material contained here (the ”content”) are for information purposes only. The content is not intended to be a substitute for professional advice, medical diagnosis and/or treatment and is not suitable for self-administration without the knowledge of your physician and regular monitoring by your physician. Do not disregard medical advice and always consult your physician with any questions you may have regarding a medical condition or before implementing anything you have read or heard in our content.
This recipe is posted as a courtesy to those following a variety of low-carb and ketogenic diets (not necessarily Meal Plans designed by me). This recipe may or may not be appropriate for you.
Keto Corn-Style Tortillas
INGREDIENTS
1 cup almond flour
3 Tbsp coconut flour
1teaspoons xanthan gum
1/4 cup powdered* psyllium husk
1Tbspbaking powder
1/4teaspoon salt
2teaspoonsapple cider vinegar
1egg
1 Tbspwater
INSTRUCTIONS
*Place 1/4 cup of whole psyllium husk in a clean, dry coffee grinder and pulse several times until it’s a fine powder.
In the bowl of a food processor, add the almond flour, coconut flour, xanthan gum, powdered psyllium husk, baking powder and salt and pulse until well mixed.
Add the egg, apple cider vinegar and water and pulse the food processor until the dough forms a mass, then pulse the food processor a few more times until it forms a ball on the blade.
Remove the dough from the food processor and then knead it as you would regular masa harina dough (the corn flour dough used to make regular corn tortillas) until it forms a smooth ball. Place the dough in a clean plastic bag and let it rest for a full 15 minutes before beginning to make tortillas.
Preheat a stick proof skillet to a medium-high heat.
6. Cut the ball of dough in half and then each half in 1/4 so that there are eight 1″ balls. Lining a tortilla press with a piece of heavy plastic**, place one of the 1″ balls in the press and press well until it is the thickness of a standard corn tortilla. Be careful not to press it too thin or it will break when you try to get it off the plastic). If you don’t have a tortilla press, it can be rolled out between sheets of heavy plastic* until each is 5-inches in diameter.
**Note: I cut open a large freezer weight zipper-style bag to use in the tortilla press when pressing the dough. By peeling one side open, it makes it easy to peel off the other side before transferring the dough to the preheated skillet
7. Immediately transfer the pressed dough onto the preheated non-stick skillet and bake for 20 – 30 seconds (it will have the characteristic char marks!) then flip it over using a spatula and cook until “just” cooked (maybe another 10-15 seconds, maximum. It is very important not to overcook these or they will not be pliable and will crack when folded. Place on a baking rack for a few minutes to cool, if saving for later or keep them warm wrapped in kitchen cloth until serving.
Can be wrapped in a heavy duty zipper plastic bag and refrigerated or frozen for future use.
Macros (per tortilla)
Energy: 119.2 kcals Protein: 4.1 g Net Carbs: 3.8 g Fat: 8.1 g
LEGAL NOTICE: The contents of this blog, including text, images and cited statistics as well as all other material contained here (the ”content”) are for information purposes only. The content is not intended to be a substitute for professional advice, medical diagnosis and/or treatment and is not suitable for self-administration without the knowledge of your physician and regular monitoring by your physician. Do not disregard medical advice and always consult your physician with any questions you may have regarding a medical condition or before implementing anything you have read or heard in our content.
INTRODUCTION: In a recent article titled Carbohydrates are not Evil I referred to myself as a “nutritional centrist” and in this post I’ll elaborate on what I mean by this. This post is more of an editorial than a standard ‘Science Made Simple’ article. References can be found in the previous articles by using the search feature.
Much of the discussion about nutrition these days on social media seems to take an “all-or-nothing” stance.
As in politics, there are those that tend towards a “left-wing” (liberal) position and others who tend towards a “right-wing” (conservative) position; some who are libertarian (let people decide for themselves) and others who are very authoritarian (dictate what they believe is best).
When it comes to nutrition, I am a centrist.
Defining Nutrition Centrism
In this article, I am using the term “centrism” to include a very wide range of nutritional positions apart from any at extreme ends of the spectrum. I believe that a wide range of nutritional centrists positions are supported by current, evidence-based science.
Veganism and Carnivory – two ends of the spectrum
In the food world there are vegans on one hand and carnivores on the other. One eats only plant-based food with nothing coming from animals (no eggs, milk or cheese) and the other eats only animal flesh food (no fruit, vegetables or dairy). These can be looked at as the nutritional equivalents to ” left wing” and “right wing” political positions. While I respect people’s individual right to choose veganism or carnivory as a lifestyle, for health reasons, or on the basis of ethical or religious beliefs, in my understanding there are significant nutritional challenges to both ends of the spectrum.
Nutritional centrists – vegetarians, pescatarians and omnivores
Somewhere between veganism and carnivory are vegetarians
(who eat mostly plant-based foods but will also eat eggs, milk and cheese because no animal is killed or harmed in the making of these) and those who are omnivores (that will eat food from a wide variety of plant and animal sources). Somewhere in the middle of these two are pescatarians who are like vegetarians but who will also eat fish (perhaps because they are not mammals, and sometimes only when they are wild species i.e. not man raised).
From my perspective, people who chose any of these lifestyles fall somewhere in the “nutritional centrist” position. I find it easy to support people following any of these lifestyle or ethical choices because it is possible to design a diet that ensures adequate nutritional intake of a wide range of macro- and micro-nutrients from the foods they choose to eat.
Whole-food-plant-based
Those who follow a “whole-food plant-based diet” can be either vegan or vegetarian so in my understanding, whole-food plant-based vegetarians fall somewhere in the “nutritional centrist” position, whereas whole-food plant-based vegans are vegans with an approach that falls at one end of the spectrum.
Low Carb High Fat and Ketogenic diets – a centrist approach
As I’ve mentioned in numerous previous articles, there are several different types of “low carb” and “ketogenic” diets.
For example, if a client comes to me with a dietary prescription from a physician for a specific type of ketogenic diet to support a specific medical or metabolic condition that is a very different scenario than someone who wants me to help them with “quick weight loss” using a “keto diet”.
As a “nutritional centrist” my approach to supporting people in following a low carbohydrate lifestyle for weight loss is to start at a moderately-low level of carbohydrates (130 g carbohydrate per day) and lower the amount of carbohydrate as needed to achieve clinical outcomes. If individuals are insulin sensitive, this level of carbohydrate intake often works very well, especially at first when people were formerly eating ~300+ g of carbohydrate per day. For those who are insulin resistant or have Type 2 Diabetes, I start at a moderately-low level of carbohydrate intake and with self-monitoring of blood sugar and follow-up and oversight from their doctor with respect to any medications taken, will gradually lower carbohydrate intake as needed to achieve the desired clinical outcome(s).
It is not a “one-sized-fits-all” approach. As documented in several previous articles, people’s glycemic (blood sugar) response to carbohydrate varies significantly, even among those who are insulin sensitive and also in those with Type 2 Diabetes, so determining individual blood sugar response to carbohydrate is the best way to determine which types and amounts of carbohydrate people respond best to. I don’t believe it is appropriate or necessary for everyone to follow a “keto diet”.
Nutritional Centrism with respect to added fat
Amongst those that teach and support a “low carb” lifestyle, there are those that promote lots of added fat from a wide variety of sources. These are people that believe in adding coconut oil and butter to beverages, butter to top meat and vegetables and using whipping cream copiously. From the beginning this is not an approach I have taken. In light of the recent scientific evidence (such as the large-scale PURE epidemiological study and others), I do not believe that moderate saturated fat intake is harmful to cardiovascular health. At the same time, I see no reason that if added fat is helpful in a particular person’s diet, that fats such as cold-expressed olive and avocado oil as well as nut and seed oils such as macadamia, walnut and almond oil aren’t suitable options.
I don’t see the need for extremes with regards to added fat. I encourage people for whom the recommendation is appropriate to add enough good quality healthy fat to make the vegetables or salad taste interesting enough that they will want to eat a fair amount of them and enjoy them. After all, eating isn’t only about getting enough nutrients, but enjoying the foods that are eaten.
Fat that comes with protein
Unless there is a medical or metabolic condition involved which precludes it, I encourage people to eat the fat that comes naturally with their protein source if they enjoy doing so.
I encourage folks to trim excess external fat off a fatty cut of steak, but if they enjoy chewing on the bone on a rib steak to ‘go for it’. The yolk in an egg or the fat in cheese is not harmful when eaten in moderate amounts so unless there are strong risk factors, I don’t believe people need to avoid or limit these foods.
While the new Canada Food guide recommends limiting foods with saturated fat based on the fact that dietary saturated fat raises total-LDL cholesterol, as I’ve documented in several previous articles I don’t believe when considering all the recent evidence that there is compelling reason to advise all people to limit foods containing cheese or to select plant-based foods over foods that contain saturated fat.
As mentioned in a few recent articles, Canada Food Guide is directed towards a healthy population in order to help them stay metabolically well and I believe that the whole-food approach of the new Guide which avoids refined grains, fruit juice and processed foods is a good evidence-based approach to accomplishing this, and one I support in my practice.
My concern as covered recently is that as many as 88% of Americans are already metabolically unwell (with presumably a slightly lower percentage in Canada due to our slightly lower obesity statistics) so in those that already have indications of insulin resistance (which is a large percentage of my client base), I do recommend a whole-foods approach but with a lower percentage of carbohydrate intake. In my understanding, this is a “nutritional centrist” approach which is supported by the American Diabetes Association and the European Association for the Study of Diabetes who both support the use of a low carbohydrate diet as Medical Nutrition Therapy in the management of Type 2 Diabetes and for weight loss.
Supporting lifestyle choices
Veganism, like carnivory is a lifestyle choice that is sometimes made for religious or ethical reasons and sometimes for health reasons. Regardless of the reason for the choice, these are lifestyles that need to be respected and supported by healthcare professionals who are qualified to do so.
As a “nutritional centrist” I can help healthy individuals follow the new Canada Food Guide and provide meals for their family along those lines if they so choose, as well as to support those who are already metabolically unhealthy using everything from a Mediterranean diet, a whole-food plant-based approach or a low carbohydrate or ketogenic diet. There is no “one-sized-fits-all” diet for any of these approaches and each should be tailored to individual needs.
No Conspiracy Theories
Conspiracy theories abound in many areas from religion to politics and there are plenty in the nutrition arena, as well. As a “nutritional centrist“, I don’t believe that “big-pharma” and “big-food” are behind everything, but at the same time I am also not naive enough to think that industries and special interests groups don’t attempt to influence the marketplace or government funding or policies by the types of research they fund, or by other means. I give scientists and researchers the benefit of the doubt that their intentions are in the interest of good science and the public interest, even though on occasion it is found out otherwise.
No Conspiracy Theories
My writing about topics such the funding of the Harvard studies by the sugar industry does not mean that I believe the scientists involved deliberately wrote biased reports. The articles were written to document the fact that researchers were funded by the sugar industry to write articles about why saturated fat was the underlying issue with respect to cardiovascular disease. Likewise, the recently translated French language newspaper report that shed light on why the government (e.g. Agriculture Canada or a political party’s leadership) may have been motivated to encourage the highlighting of legumes does not mean anything inappropriate occurred. In my understanding, conspiracy theories are not compatible with a “nutritional centrist” position.
I would encourage my readers to give scientists and researchers the benefit of the doubt when it comes to their intentions; unless there is very credible and verifiable reasons to believe otherwise.
Libertarian versus Authoritarian Approach – a centrist approach
A libertarian approach to dietary choice supports each person’s individual’s right to choose the most suitable dietary approach for themselves whereas an authoritarian approach essentially tells a person what is best for them.
As a “nutritional centrist“, I am frequently in the scientific literature, reading and reviewing the latest studies and evaluating these in light of what is already known about nutrition. My motivation in writing articles that put these studies into “plain English” is that so ordinary people can evaluate these in light of what they know and choose what they feel is best for them. From my perspective, the current available quality research on the subject is the “authority” but by no means should this be used in an authoritarian way to tell a person what is best for them. My position as a “nutritional centrist” is that people should be presented with the range of available evidenced-based options and the supporting science behind those options, but in accordance with a libertarian approach, the choice is theirs to make.
I hope that as a result of reading this article, you have a fuller understanding of what I believe and why and that I support a range of evidence-based dietary approaches including those who want to follow the Canada Food Guide, a Mediterranean approach, a whole-food vegetarian plant-based approach or a low carbohydrate approach and that include moderate amounts of healthy fats of all types. There certainly isn’t a “one-sized-fits-all” dietary approach suitable for everyone so from my perspective, the issue is which one may be best suited to help you achieve your health and nutrition goals, within your personal food preferences.
If you would like to know more about the services I offer, please click on the Services tab and if you have questions related to those, please feel free to send me a note using the Contact Me form located on the tab above.
To your good health!
Joy
Feedback and question from Dr. Andrew Samis, MD, PhD – shared with prior permission
UPDATE: February 1, 2019 13:20
Dr. Andrew Samis, MD, PhD, a surgeon and critical care specialist from Kingston, Ontario asked a very interesting question on Twitter, in response to this article;
“Could the same eating strategy be healthy for one person, and make a second metabolically unhealthy?”
This was my response;
“Yes, I believe there is ample evidence that the same eating strategy could be healthy for one person and make a second person metabolically unhealthy. Monitoring metabolic markers enables us to catch this early and make adjustments, as necessary.“
LEGAL NOTICE: The contents of this blog, including text, images and cited statistics as well as all other material contained here (the ”content”) are for information purposes only. The content is not intended to be a substitute for professional advice, medical diagnosis and/or treatment and is not suitable for self-administration without the knowledge of your physician and regular monitoring by your physician. Do not disregard medical advice and always consult your physician with any questions you may have regarding a medical condition or before implementing anything you have read or heard in our content.
DISCLAIMER: (February 1, 2019) The views expressed in the translated editorial are solely the opinions of the Journal de Montréal and its editors.
Today, the French language populist newspaper Le Journal de Montreal published an article that states that it is “no coincidence” that Health Canada featured dried beans so prominently in the new Canada Food Guide; ‘certainly they are good for health’, but there is also an ‘obvious economic benefit and benefit to local agricultural interests'[1].
The pea arguments
[translation] “This is not well known, but Canada is the major supplier of legumes (pulses) on the planet. Between 35% and 40% of world production comes from here,essentially from the prairie provinces. Quebec is participating by growing dry beans.”
Economic and Local Interest
The article states that in addition to the health benefits there are two reasons why legumes (pulses) feature so prominently in the new Canada Food Guide;
I – Economic interests – the first “because”
The Journal de Montreal article states that one of the additional reasons legumes (pulses) were highlighted in the new Canada Food Guide was because Agriculture Canada had forecast a 20% decrease in production of legumes during 2019[1]. The reason for this decrease production is outlined below.
II – benefit to local agriculture – the second “because”
The article also states that growing legumes benefits local agricultural interests[1] because;
“legumes contain bacteria that allow them to transfer nitrogen from the air to the ground and this nitrogen is needed for growth of vegetables.”
This means that by growing legumes one season, the soil becomes enriched with nitrogen which helps the growing of other food crops the following growing season.
BACKGROUND TO THE FIRST “because”
Last March, the CBC reported that India, a top importer of Canadian chickpeas and lentils imposed a huge tariff on legumes which resulted in Canadian producers facing duties of 33% on lentils and 50% on desi chickpeas. The type that Canada produces are kabuli chickpeas, which have a slightly lower tariff of 40% [2]. These tariffs resulted in a decreased demand for Canadian legumes (pulses), as well as a price decline.
CBC also reported [3] that India’s imposed tariffs on pulses has sent “a huge ripple effect through the whole industry” as dried beans are a 1.1 billion dollar industry in Saskatchewan alone and India is it’s biggest customer[3].
“Farmers are calling on Prime Minister Justin Trudeau for help to make sure that business continues and to consider the importance of agriculture in Canada”[3].
New Canada Food Guide – free of influence?
The article in Le Journal de Montreal raises the question as to how much of the prominent inclusion of legumes (pulses) in the new Canada Food Guide has to do with their reported health benefits and how much may have been driven by industry or lobby groups influence on various levels of government due to decreased demand and resulting falling production.
Figure 2 Adapted Framework for Developing Dietary Guidance – Evidence Review Cycle Model for Canadian Dietary Guidance, from Colapinto et al 2016
UPDATE:(February 3, 2019): While it is evident from the CBC report[3] above that the pulse industry was exerting pressure on various levels of the Federal government to address decreased demand for its product, decreased legume production would have been factored into the design of the new Canada Food Guide as both (1) the role of legumes and plant-based dietary patterns on health and (2) food availability of legumes in light of decreased production would have necessarily been evaluated i.e. two of the four of the direct influences involved Dietary Guidance design. [see “Evidence Review for Dietary Guidance: Summary of results and implications for Canada’s Food Guide, 2015” – available here) which on page 2 refers to the longer document “Colapinto CK, Ellis A, Faloon-Drew K, Lowell H Developing an evidence review cycle model for Canadian dietary guidance. Journal of Nutrition Education and Behavior. 2016;48:77-83)” that has Figure 2, below. This figure indicates that Food Availability of the Food Supply is one of the four direct influences in the development of Dietary Guidance. While decreased legume production (i.e. food availability) would have been factored into the decision for Canadians to include more legumes in their diet for health benefits on the new Canada Food Guide, I can find no evidence that legume’s benefit to agriculture was ever evaluated. Some thoughts… I think it is important to know what is said in the populist press about important issues such as this because a large segment of the population relies on such sources, as well as the internet for their news. Often times such stories are based on truth but leave what isn’t said up to the audience (readers or listeners). Knowing the facts behind the story enables us to tease out conjecture from fact.
If you would like to learn more about what I do and how I can help, please have a look at the Services tab to learn more about the hourly consultations and packages that I offer. If you have questions about my services, please send me a note using the Contact Me form located on the tab above and I will reply as soon as I can.To your good health!
LEGAL NOTICE: The contents of this blog, including text, images and cited statistics as well as all other material contained here (the ”content”) are for information purposes only. The content is not intended to be a substitute for professional advice, medical diagnosis and/or treatment and is not suitable for self-administration without the knowledge of your physician and regular monitoring by your physician. Do not disregard medical advice and always consult your physician with any questions you may have regarding a medical condition or before implementing anything you have read or heard in our content.
Much of the discussion about nutrition these days on social media seems to take an “all-or-nothing” stance on carbohydrates. On one hand there are those who promote a plant-based diet that necessarily comes with a large amount of carbohydrate as grains, legumes (pulses) such as beans and lentils as well as carbohydrate-containing vegetables and fruit, and on the other hand there are those who eschew anything with the remotest amount of carbohydrate.
In politics, there are left-leaning ‘liberals’ and right-leaning ‘conservatives’, as well as those that hold a moderate position called “centrists”.
I am a centrist when it comes to my position regarding carbohydrates. In this article, I will elaborate on the following;
Carbs are not evil or single-handedly responsible for the obesity epidemic or metabolic diseases. If that were the case, then the traditional diets of much of Asia and West Africa would have resulted in obesity and diabetes and they did not. It is the degree of processing of the carbohydrate-based foods that impacts the blood glucose and blood insulin response of carbohydrate-containing foods.
Carbohydrate-based foods combined with fat in the same food ‘hijack’ the reward center of our brains (striatum), resulting in over-consumption.
Carbohydrates are not essential macronutrients.
Part 1 – Degree of Processing
Processing carbohydrate even in simple ways such as cooking or grinding means that more of the carbohydrate is available to the body to be digested. As pointed out in an earlier article which I will refer to throughout this section, when grains are cooked they become much more digestible — meaning that more of the nutrients in the grain is available to be absorbed. In the case of potatoes, there is double or triple the amount of energy (calories) available to the body when they are cooked versus when they are raw.
Mechanical processing, such pounding, grinding or pureeing are also forms of food processing which have an effect on how many nutrients are available to be digested. The nutrients available to the body when food is eaten raw and whole versus raw and pounded is significant.
Glucose Response – based on the amount of food processing
Mechanical processing of a food doesn’t change the amount of carbohydrate that is in it. That is, when 60 g of whole apple are compared with 60 g of pureed apple or 60 g of juiced apple, there are the same amount of carbohydrates in each and the Glycemic Index of these are similar, however when these foods are eaten the blood glucose response 90 minutes later is significantly different. As outlined in the earlier article, in healthy individuals, blood glucose level goes very high with the juiced apple and in response to the release of insulin, blood glucose then goes very low, below baseline. The response that we see with the juiced apple in healthy individuals is typical of what is seen with other forms of ultra-processed carbohydrates.
This is why it is preferable for metabolically healthy people to eat carbohydrate-based foods as whole, unprocessed foods with a minimum of disruption to the cell structure.
Insulin Response with Mechanical Processing
When healthy individuals eat grain-based meals, the plasma insulin response is inversely related to the particle size of the grain. That is whole, unprocessed grain releases less insulin than the same amount of cracked grain, which is still less than the same amount of course flour. The highest amount of insulin is released in response to eating the same amount of fine flour.
This increased insulin response of eating grains that are highly processed can drive chronic hyperinsulinemia (chronically high levels of insulin) that eventually results in insulin resistance; the beginning of the metabolic disease process.
It is for this reason that for metabolically healthy individuals, eating whole, unrefined grains is recommended.
Effect or Lack of Effect of Fiber
It is the lack of disruption to the cell structure of the grain that limits the insulin response and not the fiber content that makes the difference.
As mentioned in the earlier article (link above), studies have been done with bread where the fiber was added back in (such as in so-called “whole wheat bread” which is essentially white bread with added bran) and the insulin response was the same as with white bread, so it is not the amount of fiber in the grain that makes the difference, but the lack of disruption to the grain structure itself. I find it helpful to think of it in terms of ‘the fiber that counts is that which is part of the whole, undisrupted grain’. (Note: it is for this reason that I only factor “net carbs” for food whose fiber is in this undisrupted form. For all other products where fiber is added, I don’t deduct the fiber).
The disruption of the structure of the grain also has an adverse effect on GIP response (an incretin hormone released from the K-cells high up in the intestine that triggers the release of insulin). Bread made with flour (as opposed to whole, intact grains) results in a much larger and earlier plasma GIP response, which in turn results in a higher and earlier insulin response, than bread made with whole kernel grains, such as artisanal rye or wheat breads.
In metabolically healthy individuals, the eating of whole, intact minimally processed carbohydrate-containing food is preferable, as opposed to eating processed carbohydrate-containing foods (be it grains or fruit) with significant disruption to the cell structure.
Part II – Carbohydrate and Fat Combined
In nature, there are very few foods in the human diet that contain a combination of both carbohydrate and fat in substantial quantities. Human breast milk is one of those few natural foods, along with some nuts and seeds. When humans began drinking the milk of other mammals such as goats, sheep and cows, milk became one of those foods.
Also as outlined in a previous article foods with both fat and carbs together result in much more dopamine being released from the reward-center of our brain, called the striatum. Dopamine is the same neurotransmitter that is released during sex and that is involved in the addictive ”runner’s high” familiar to athletes so this is a very powerful neurotransmitter.
It is believed that there are separate areas of the brain that evaluate carb-based foods and fat-based foods but when carbs and fat appear in the same food together, this results in what the researchers called a ”supra-additive effect”. That is, both areas of the brain get activated at the same time, resulting in much more dopamine being released from the striatum and a much bigger feeling of ”reward” being produced. This combination of carbs and fat in the same food is why we find foods such as French fries, donuts and potato chips irresistible and this powerful reward-system is why we’ll choose French fries over baked potato and why we have no difficulty wolfing back a few donuts, even when we’ve just eaten a meal.
This ”supra-additive effect” on the pleasure center of our brain along with the fact that more insulin is released when both carbs and fat are eaten together helps explain the roots of the current obesity epidemic and the metabolic diseases such as Type 2 Diabetes that go along with it. The high rates of obesity seen more recently in places like China (as covered in this article) are due to the adoption of Western eating habits (refined, processed foods) that are notoriously high in both carbohydrates and fat.
When foods that are rich sources of carbohydrate are eaten it is best that foods that are also rich sources of fat are not eaten at the same time in order to avoid this supra-additive effect.
I do not believe that carbohydrate-based foods in and by themselves in metabolically healthy individuals are the underlying cause of obesity and metabolic disease. I believe that it is the (1) consumption of carbohydrate-based foods that have undergone some kind of food processing (grinding, milling, pureeing, etc) that has disrupted their cell structure and (2) the consumption of foods that combine both carbohydrate and fat in the same food that have driven both.
Part III – Carbohydrates are Not Essential Macronutrients
With all the arguing about eating more carbs or less carbs, it needs to be emphasized that carbohydrates are not essential nutrients. Yes, the body needs a certain amount of glucose for the brain, but the body can make this glucose from protein and fat through a process called gluconeogenesis.
This is not simply my opinion, but is stated by the Dietary Reference Intakes for Energy, Carbohydrate, Fiber, Fat, Fatty Acids, Cholesterol, Protein and Amino Acids (2005) on page 275;
”The lower limit of dietary carbohydrate compatible with life apparently is zero, provided that adequate amounts of protein and fat are consumed.
That is, there is no essential need for dietary carbohydrate provided there are adequate amounts of protein and fat provided in the diet.
The Recommended Dietary Allowance (RDA) for carbohydrate is set at 130 g / carbohydrate per day based on the average minimum amount of glucose utilized by the brain— however the body can manufacture this glucose from protein or fat. A well-designed low carbohydrate diet provides sufficient amounts of fat and protein such that the body can manufacture the glucose it needs.
Carbohydrate – to eat or not to eat
For Healthy Individuals
For those who are healthy and metabolically flexible, consumption of whole, unprocessed carbohydrate-containing foods such as whole grains, tubers, starchy vegetables such as peas, squash and corn and whole fruit are of no concern. Due to the ‘supra-additive’ effect of fats with carbohydrate, I recommend that when eating carbohydrate-based foods, to avoid foods that are a rich source of fat.
For Metabolically Unhealthy Individuals
As mentioned in the two previous articles related to the new Canada Food Guide (here and here), 88% of Americans are already metabolically unwell, with presumably a large percentage of Canadians as well.
That is, only 12% have metabolic health defined as;
Waist Circumference: < 102 cm (40 inches) for men and 88 cm (34.5 inches) in women
Systolic Blood Pressure: < 120 mmHG
Diastolic Blood Pressure: < 80 mmHG
Glucose: < 5.5 mmol/L (100 mg/dL)
HbA1c: < 5.7%
Triglycerides: < 1.7 mmol/l (< 150 mg/dL)
HDL cholesterol: ≥ 1.00 mmol/L (≥40 mg/dL) in men and ≥ 1.30 mmol/L (50 mg/dl) in women
For the large majority who are metabolically unhealthy, knowing which carbohydrate-based food raise one’s blood glucose levels is important. Even if lab tests show one’s fasting blood glucose is still normal, blood glucose levels after eating carbohydrate may be quite abnormal, and even more significantly insulin levels may be as well. You can read more about that here. As mentioned previously in this article, these high insulin levels are what drives metabolic disease by driving insulin resistance.
Eating a low carbohydrate diet can be very helpful to lower blood glucose response and lower chronically high levels of insulin. Which carbohydrates can be tolerated and in what quantities varies considerably between people, but is easy to determine and I help people do this.
For those that already have Type 2 Diabetes, reducing carbohydrate intake for a considerable length of time will enable them to reduce their overall blood glucose and insulin response, which will help them reverse the symptoms of Diabetes as well as other metabolic diseases that often go along with it, such as high blood pressure and high triglycerides. In time, some carbohydrates may be able to be eaten again however the amount and type will vary between individuals.
Final Thoughts…
Carbohydrates aren’t “evil”. In and by themselves, they don’t result in obesity or metabolic disease. It is the amount of food processing that carbohydrate-containing foods have undergone that results in cell-wall disruption that will determine how much of a glucose- or insulin-response they will cause. In metabolically healthy people, eating minimally processed whole grains, starchy vegetables and fruit without a source of fat is fine.
For those who are metabolically unhealthy, especially those who have a measurably abnormal glucose- or insulin-response, the amount of carbohydrate that can be tolerated is individual and will need to be determined.
For those who have Type 2 Diabetes and follow a low carbohydrate diet to reduce the symptoms of high blood sugar or metabolic diseases that often go along with it, eating the amount of tolerated carbohydrates as minimally processed ones, without a source of fat is also best.
There is no “one size fits all” diet that is suitable for everyone.
For metabolically healthy individuals, following the new Canada Food Guide and selecting carbohydrate sources using the above principles can provide people with a healthy diet. For those that are already metabolically unhealthy, I can help design a Meal Plan that will meet your energy and nutrient needs and that provides the amount of carbohydrate that you can tolerate. If you would like more information, please send me a note using the Contact Me form, above and I’ll be happy to reply soon.
LEGAL NOTICE: The contents of this blog, including text, images and cited statistics as well as all other material contained here (the ”content”) are for information purposes only. The content is not intended to be a substitute for professional advice, medical diagnosis and/or treatment and is not suitable for self-administration without the knowledge of your physician and regular monitoring by your physician. Do not disregard medical advice and always consult your physician with any questions you may have regarding a medical condition or before implementing anything you have read or heard in our content.
There has been some discussion on Twitter that the macronutrient estimated in the previous article of an average ~325-350 g of carbohydrate per day based on a 2000 kcal per day diet for the new Canada Food Guide was “too high”, so in the interest of determining whether it was accurate, I’ve evaluated the carbohydrate content of the illustrated plate.
Actual Number, Standard Cup Measure and Scale of Reference
Since no portion sizes are provided with the new guide, both scale of reference or when available, the actual number of items was used.
The actual number of chickpeas, kidney beans, nuts and seeds were used and determine in terms of the portions of a standard cup measure.
For items such as vegetables and fruit, actual portions were measured using a standard set of stainless steel measuring cups.
For any remaining quantities, since a quarter of an egg is featured on the illustration of a healthy plate and a large sized egg is the standard on which nutrient analysis is based and this is of a known size, I used the 1/4 of a large egg as the scale of reference for other items,when the actual number was not available.
Carbohydrate Content of the Protein Group
The protein group contributed~37 g of carbohydrate to the sample plate.
Carbohydrate content of the protein group on the sample plate
Carbohydrate Content of the Whole Grains Group
The whole grains group contributed more than~58 g of carbohydrate to the sample plate.
Carbohydrate content of the whole grains group on the sample plate
Carbohydrate Content of the Vegetable and Fruit Group
The vegetable and fruit group contributed more than~53 g of carbohydrate to the sample plate.
Carbohydrate content of the vegetable and fruit group on the sample plate
The sample plate used as an illustration for the new Canada Food Guide has close to 150 g of carbohydrate on it— and this is for only one meal. The carbohydrate content of lunch and dinner (the two generally mixed meals of the day) already totals as much as 300 g of carbohydrate — and there’s still breakfast to add! Whether it’s a couple of whole grain toast (30 g carbs), 2 tbsp unsweetened nut butter (6 g carbs) or some whole grain cereal (30 g carbs) and 1/2 cup of low fat unsweetened yogurt (6 gm carbs), there’s another 42 g of carbs (plus the carbs for the milk or nut or soy milk to pour on the cereal); bringing the average for the three meals alone to 337+ g of carbs which is exactly what it was estimated as in the previous article — as between 325 – 350 g carbohydrate per day.
And this is just for 3 MEALS.
What about snacks?
Yes, snacks are mentioned TWICE on the first page under the link for “eating habits” in the section on “how to make a meal plan and stick to it”;
Recommendations for meals and snacks
Assuming a person eats a “healthy whole grain” muffin without any dried fruit in it for coffee break in the morning (~50 g of carbs) and a single piece of fruit like an apple or orange mid-afternoon (15 g of carbs), these add another 65 g of carbohydrate to this day, bringing the average total to over 400 g of carbohydrate for one day.
UPDATE (January 26, 2019) Given the sample plate is there to demonstrate proportions, not portions — looking at the grain group alone, the proportion of grain is 1/4 of the dietary intake. Based on a 2000 kcal/day diet, that’s 500 calories per day / ~125 g of carbohydrate from the grain group alone. Add in the carbohydrate from the largely plant-based protein group, that’s another ~100 g carbohydrate per day, on average. Since half the plate should be vegetables and fruit and both starchy vegetables such as squash, yam, potato, peas and corn contain 15 g of carbohydrate per half cup, as does the same amount as fruit, it is reasonable to assume that on average, half of the vegetable servings will be comprised of a mixture of starchy vegetables — along with the fruit servings and the other quarter of the plate of non-starchy vegetables. That is, 1/4 of the vegetable and fruit side of the plate will be carbohydrate-containing, adding another ~125 g of carbohydrate per day to the diet. Of course, there will be days where people will eat lower carbohydrate grains like quinoa and lower carbohydrate plant-based protein such as tofu, but equally there will be days where vegetable servings are starchy ones such as peas and corn along with plant-based proteins that are higher in carbohydrate, such as legumes like kidney beans. So, the numbers above are averages. Whether one uses the portions on sample plate as a basis for estimating the carbohydrate content or uses the proportion of the diet that is carbohydrate, the results fall in the same range of an average of 325 – 350 g carbohydrate per day, based on only 3 meals (without snacks).
Real Life Meals
Despite there being no “portion sizes” in the new Canada Food Guide, some insist that a “serving of pasta is 1/2 cup” because that is what is illustrated on the sample plate. Okay, let’s go with that for the sake of argument.
If a person ate twice that amount of pasta (instead of also eating some wild rice or rice or bread, for example), this is what the size of that portion would look like (of course it would be “whole grain”):
1 cup of cooked pasta – size of a tennis ball
I’ve been in private practice a long time and in my experience only children and women who are portion restricting eat pasta in amount the size of a tennis ball. More than 90% of my clients report eating servings of pasta that are significantly larger than that. In fact, the usual ‘smaller-sized’ servings are about acup and a half when eaten along with salad or a cooked vegetable (bigger if eaten alone). What does a cup and a half of pasta look like? It looks like this;
1 1/2 cups of whole grain pasta
…and this amount of pasta without sauce has 45 g of carbohydrate in it — which is still less than the 53 g of carbs illustrated in the Canada Food Guide sample plate.
Naturally, no one is expected to eat exactly like the “sample meal”, but whether one eats their “whole grains” as all brown rice, wild rice, Bulgar wheat or something else, 1/4 of the plate all have the same amount of carbohydrate per 1/2 cup serving as pasta.
Add to the pasta the vegetables and fruits above on the sample plate (or corresponding assortment of a mix of starchy, non-starchy vegetables and fruit) and that adds up to 100 g of carbohydrate …and we still haven’t added any protein into the meal, yet.
Add another 37 g of carbohydrate for an assortment of legumes, nuts and seeds as well as a bit of meat and “low fat” cheese for the pasta sauce (because after all, we are encouraged to eat animal protein “less often”) and that totals more than 135 g of carbs for just this one “real life” meal. Eat a meal like the one in the sample illustrations, it adds up to 150 g of carbs!
The question I’ve been asked is if it is “healthy whole grain”, then what’s the concern?
For metabolically healthy adults, none. For metabolically healthy adults, the new Canada Food Guide is a huge improvement from it’s predecessor! It eliminates refined carbs, sugary drinks including fruit juice and encourages eating whole foods, cooked at home as much as possible.
The problem is, most adults are not metabolically healthy.
Majority of Adults Metabolically Unhealthy
As mentioned in the previous article research indicates that as many as 88% of Americans[1] are already metabolically unwell, with presumably a large percentage of Canadians as well. That is, only 12% of the adult population would be considered metabolically healthy [1]”.
Metabolic Health is defined as [1];
Waist Circumference: < 102 cm (40 inches) for men and 88 cm (34.5 inches) in women
Systolic Blood Pressure: < 120 mmHG
Diastolic Blood Pressure: < 80 mmHG
Glucose: < 5.5 mmol/L (100 mg/dL)
HbA1c: < 5.7%
Triglycerides: < 1.7 mmol/l (< 150 mg/dL)
HDL cholesterol: ≥ 1.00 mmol/L (≥40 mg/dL) in men and ≥ 1.30 mmol/L (50 mg/dl) in women
Given the slightly lower rates of obesity in Canada (1 in 4) as in the United States (1 in 3), presumably there is a slightly lower percentage of Canadians who are metabolically unhealthy. For the sake of argument, let’s assume that there are TWICE as many metabolically healthy adults in Canada, which would mean that only slightly over 75% of adults are metabolically unhealthy. Since Canada’s Food Guide is intended for a healthy population in order to reduce the risk of overweight and obesity as well as chronic diseases manifest as the markers above, that means that the new Canada Food Guide — as beautiful as it is, is only appropriate for ~1/4 of the adult population.
For the other 75% of adults that are presumably metabolically unwell, a diet that provides 342 g of carbohydrate per day for meals alone (based on a 2000 kcal per day diet) and as much as 400 g of carbohydrate per day with 2 “healthy” snacks is not going to address the large percentage of adults who are already demonstrating symptoms of being carbohydrate intolerant.
Carbohydrate Intolerance
As outlined in detail in a previous article, based on a large-scale 2016 study that looked at the blood glucose response and circulating insulin responses from 7800 adults during a 5-hour Oral Glucose Tolerance Test, 53% had normal glucose tolerance at 2 hours but of these people, 75% had abnormal blood sugar results between 30 minutes and 60 minutes demonstrating that they were already hyperinsulinemic, although it went undetected on standard assessors that only look at glucose and insulin responses at baseline (fasting) and at 2 hours.
These people are already exhibiting symptoms of not tolerating a normal carbohydrate load of 100 g.
How does it make sense to encourage adults that already have abnormal glucose response to eat 150 g of carbohydrate per meal when these people already have an impaired first-phase insulin response? How will eating “whole grains” and the “added fiber from plant-based proteins” improve their first-phase insulin response (which likely results from dysfunction in the release of the incretin hormone GIP (Glucose-dependent Insulinotropic Polypeptide) from the K-cells?
For these people, continuing to eat a diet high in carbohydrate, irrespective of the amount of fiber or the glycemic load will not restore their insulin response, and in time is likely to make it worse. This is my concern.
Canada Food Guide is for a healthy population to avoid the risk of chronic disease and based on these statistics most adults are not metabolically healthy.
Final Thoughts…
For the ~1/4 of adults that are metabolically healthy, I think the new Canada Food Guide is beautiful and focuses on real, whole food, preparing food at home, avoiding refined grains and avoiding high sugar beverages such as fruit juice (formerly seen as “healthy”).
For the high percentage of adults that are already metabolically unwell and who already demonstrate abnormal glucose responses, I don’t see that advising them to eat a diet that is between 325-350 g of carbohydrate per day (meals without snacks) helps them to avoid the progression to Type 2 Diabetes.
If you are part of the majority of Canadians that are already struggling with overweight and/or being metabolically unwell and would like to know more about how I may be able to help you achieve a healthy body weight and restore metabolic markers then please send me a note using the Contact Me form, on the tab above.
Araíºjo J, Cai J, Stevens J. Prevalence of Optimal Metabolic Health in American Adults: National Health and Nutrition Examination Survey 2009—2016. Metabolic Syndrome and Related Disorders Vol 20, No. 20, pg 1-7, DOI: 10.1089/met.2018.0105
Crofts, C., et al., Identifying hyperinsulinaemia in the absence of impaired glucose tolerance: An examination of the Kraft database. Diabetes Res Clin Pract, 2016. 118: p. 50-7.
LEGAL NOTICE: The contents of this blog, including text, images and cited statistics as well as all other material contained here (the ”content”) are for information purposes only. The content is not intended to be a substitute for professional advice, medical diagnosis and/or treatment and is not suitable for self-administration without the knowledge of your physician and regular monitoring by your physician. Do not disregard medical advice and always consult your physician with any questions you may have regarding a medical condition or before implementing anything you have read or heard in our content.
The new Canada Food Guide was officially released in Montreal today, January 22, 2019 and the suite of Food Guide resources includes;
Canada’s Dietary Guidelines for Health Professionals and Policy Makers
Food Guide Snapshot
Resources such as actionable advice, videos and recipes
Evidence including the Evidence Review for Dietary Guidance 2015 and the Food, Nutrients and Health: Interim Evidence Update 2018
Canada Food Guide “plate”
Canada Food Guide – directed towards healthy Canadians
According to Eating Well with Canada’s Food Guide – A Resource for Educators and Communicators the goal of Canada’s Food Guide is to ‘define and promote healthy eating for Canadians’ and to ‘translate the science of nutrition and health into a healthy eating pattern’. By definition, Canada’s Food Guide is directed towards a healthy Canadian population so they can meet their nutrient needs and reduce their risk of obesity and chronic diseases.
“By following Canada’s Food Guide, Canadians will be able to meet their nutrient needs and reduce their risk of obesity and chronic diseases such as type 2 diabetes, heart disease, certain types of cancer and osteoporosis.”
The New Canada Food Guide – no more rainbow
The familiar “rainbow” visual has been replaced with clear, simple photography illustrating food choices. In response to feedback from focus groups that the draft of the Guide focused too much on “how to eat” but didn’t provide adequate direction on “what to eat”, the final version clearly illustrates the proportion of vegetables and fruit, grains and protein foods to eat on a plate.
Animal-based proteins included beef, poultry, fish, egg and yogurt. Noticeably absent from animal-based proteins was cheese.
Plant-based proteins included legumes and pulses (beans and lentils), nuts and seeds and tofu.
Whole Grains
Whole Grains Food Group
The Whole Grain group is visually exemplified by whole grain bread, pasta, rice, wild rice, and quinoa and the link that relates to “whole grain foods” contains the following information;
Whole grain foods are good for you
Whole grain foods have important nutrients such as: fiber, vitamins and minerals
Whole grain foods are a healthier choice than refined grains because whole grain foods include all parts of the grain. Refined grains have some parts of the grain removed during processing.
Whole grain foods have more fibre than refined grains. Eating foods higher in fibre can help lower your risk of stroke, colon cancer, heart disease and type 2 diabetes
Make sure your choices are actually whole grain. Whole wheat and multi-grain foods may not be whole grain. Some foods may look like they are whole grain because of their colour, but they may not be. Read the ingredient list and choose foods that have the word ”whole grain” followed by the name of the grain as one of the first ingredients like; whole grain oats, whole grain wheat. Whole wheat foods are not whole grain, but can still be a healthy choice as they contain fibre.
Use the nutrition facts table to compare the amount of fibre between products. Look at the % daily value to choose those with more fibre.
Vegetables and Fruit
Vegetable and Fruit Food Group
The new Guide illustrated that 1/2 the plate should be comprised of vegetables and fruit and the plate showed mostly non-starchy vegetables as broccoli, carrot, shredded peppers, cabbage, spinach and tomato, with a small amount of starchy vegetables as potato, yam and peas.
Fruit as blueberries, strawberry and apple was illustrated as a small proportion of the overall.
Beverage of Choice – water
The place setting showed a glass of water with the words “make water your drink of choice”; which indicates that fruit juice and pop (soft drinks) are not included as part of a recommended diet, but what about milk?
It is good that water is promoted as the beverage of choice, but why does the Guide doesn’t also illustrate a small glass of milk? The absence of milk in the new Guide seems odd.
Note: with both cheese and milk being limited in this new food guide, adequate calcium intake may be of concern; especially since vegetables that are high in calcium will have that calcium made unavailable to the body due to the high amounts of phytates, oxylates and lectins that are contained in the grains, nuts and seeds that are also in the diet.
Make it a habit to eat a variety of healthy foods each day.
Eat plenty of vegetables and fruits, whole grain foods and protein foods. Choose protein foods that come from plants more often.
Choose foods with healthy fats instead of saturated fat
Limit highly processed foods. If you choose these foods, eat them less often and in small amounts.
Prepare meals and snacks using ingredients that have little to no added sodium, sugars or saturated fat
Choose healthier menu options when eating out
Make water your drink of choice
Replace sugary drinks with water
Use food labels
Be aware that food marketing can influence your choices
Healthy eating is more than the foods you eat. It is also about where, when, why and how you eat.
Be mindful of your eating habits
Take time to eat
Notice when you are hungry and when you are full
Cook more often
Plan what you eat
Involve others in planning and preparing meals
Enjoy your food
Culture and food tradition can be a part of healthy eating
Eat meal with others
Additional links on the web page include, Recipes, Tips and Resources.
First Impressions of the New Canada Food Guide
Overall, I think the new Canada Food Guide is visually clear, well illustrated and in terms of a communication tool is a huge improvement over its predecessor. It promotes a whole food diet with minimum processing, advises people to limit refined carbohydrates and sugary beverages as well as encourages people to cook their own food. It is neat, clean and appealing to look at and use.
I have two main concerns with respect to the Guide;
(1) the percentage of carbohydrate in the diet given the number of Canadians who are already metabolically unwell
(2) the focus on avoiding saturated fat as presumably a risk to health
Percentage of Carbohydrate in the Diet
At first glance, it would appear that the overall macronutrient distribution of the new Guide is ~10-15% of calories as protein, 15-20% as fat, leaving the remaining 65-75% of calories as carbohydrate (based on estimates by Dr. Dave Harper, visiting scientist at BC Cancer Research Institute, social media post). While no portions are set out in this new Guide, based on the carbohydrate (and protein) content of the legumes and pulses (beans, lentils) and nuts and seeds contained in the Protein food group, as well as their proportion of the food group, and the fact that they are encouraged to be eaten ‘more often’ than meat, the protein estimate seems accurate. As well, the carbohydrate content seems accurate based on the proportion of the Whole Grain group and carbohydrate-containing other foods relative to the proportion of other foods.
While this diet may be fine for those who are metabolically healthy, research indicates that as many as 88% of Americans [1] are already metabolically unwell, with presumably a large percentage of Canadians as well.
That is, only 12% have metabolic health defined as have levels of metabolic markers “consistent with a high level of health and low risk of impending cardiometabolic disease“. Metabolic Health is defined as [1];
Waist Circumference: < 102 cm (40 inches) for men and 88 cm (34.5 inches) in women
Systolic Blood Pressure: < 120 mmHG
Diastolic Blood Pressure: < 80 mmHG
Glucose: < 5.5 mmol/L (100 mg/dL)
HbA1c: < 5.7%
Triglycerides: < 1.7 mmol/l (< 150 mg/dL)
HDL cholesterol: ≥ 1.00 mmol/L (≥40 mg/dL) in men and ≥ 1.30 mmol/L (50 mg/dl) in women
When looking at only 3 of the above 7 factors (waist circumference, blood glucose levels and blood pressure) more than 50% in this study were considered metabolically unhealthy [1]. Given the slightly lower rates of obesity in Canada (1 in 4) as in the United States (1 in 3), presumably there is a slightly lower percentage of Canadians who are metabolically unhealthy, but the similarity of our diets may make that difference insignificant.
This would indicate that for a large percentage of Canadians that are metabolically unwell, a diet that provides provides ~325-375 g of carbohydrate per day (based on a 2000 kcal per day diet) is not going to adequately address the underlying cause. While there is evidence that a high complex carbohydrate diet with very low fat and moderately-low protein intake (called a “whole food plant based” / WFPB diet) will improve weight and some markers of metabolic health, there is also evidence that a WFPB diet doesn’t work as well at improvements in body weight and metabolic markers as a low carbohydrate higher protein and fat (LCHF) diet. This will be addressed in a future article.
The purpose of Canada’s Food Guide is to provide guidance for healthy Canadians so in actuality, this diet may only be appropriate for ~15% of adults.
Saturated Fat
The indication to “choose foods with healthy fats instead of saturated fat” and to “prepare meals and snacks using ingredients that have little to no added sodium, sugars or saturated fat” sends the message that saturated fat is unhealthy.
It is well-known that saturated fat raises LDL-cholesterol however it must be specified which type of LDL-cholesterol increases. There are small, dense LDL cholesterol which easily penetrates the artery wall and which are associated with heart disease [2,3,4,5] and large, fluffy LDL cholesterol which are not [6,7].
The long-standing and apparently ongoing recommendation to limit saturated fat is based on it resulting in an increase in overall LDL-cholesterol and not on evidence that increased saturated fat in the diet results in heart disease.
What do recent studies show?
Eight recent meta-analysis and systemic reviews which reviewed evidence from randomized control trials (RCT) that had been conducted between 2009-2017 did not find an association between saturated fat intake and the risk of heart disease [8-15] and the results of the largest and most global epidemiological study published in December 2017 in The Lancet [16] found that those who ate the largest amount of saturated fats had significantly reduced rates of mortality and that low consumption (6-7% of calories) of saturated fat was associated with increased risk of stroke.
UPDATE: There are 44 randomized controlled trials (RCTs) of drug or dietary interventions to lower total LDL-cholesterol that showed no benefit on death rates. (Reference: DuBroff R. Cholesterol paradox: a correlate does not a surrogate make. Evid Based Med 2017;22(1):15—9.
Canadians are being encouraged to limit foods that are sources of saturated fat. In fact, cheese and milk aren’t even illustrated as foods to regularly include.
Where is the evidence that eating foods with saturated fat is dangerous to health — not simply that it raises overall LDL-cholesterol? I believe that for Canadians to be advised to limit cheese and milk which are excellent sources of protein and dietary calcium and to limit other foods high in saturated fat necessitates more than proxy measurements of higher total LDL-cholesterol.
Dr. Zoe Harcombe a UK based nutrition with a PhD in public health nutrition wrote an article this time last year about saturated fat [17] which is helpful to refer to here.
People have the idea that meat has saturated fat and foods like nuts and olives have unsaturated fats, but Dr. Harcombe points out that;
“All foods that contain fat contain all three fats — saturated, monounsaturated and polyunsaturated — there are no exceptions.”
This article explains may explain why cheese was not included as part of the visual representation of animal-based Protein Foods in the new Guide and why milk was not visually represented because “the only food group that contains more saturated than unsaturated fat is dairy”.
A link off the main page of the new Canada Food Guide explains how to “limit the amount of foods containing saturated fat” such as;
Limit foods that contain saturated fat
“Limit the amount of foods containing saturated fat, such as:
cream
higher fat meats . . . cheeses and foods containing a lot of cheese“
Are Canadians being encouraged to avoid cheese and milk because they are high in saturated fat? Where is the evidence that saturated fat contributes to heart disease?
There is proxy data that saturated fat raises total LDL-cholesterol, but not that saturated fat causes heart disease. In fact, a review of the recently literature finds that it does not (see above).
If saturated fat actually puts one’s health at risk, then Canadians should be warned that olive oil has 7 times the amount of saturated fat as the sirloin steak illustrated below and the mackerel has 1- 1/2 times the saturated fat as the sirloin steak [16] yet the new Guide recommends that Canadian’s choose foods with “healthy fats” such as fatty fish including mackerel and to use “healthy fats” such as olive oil.
from Reference #17
Final thoughts…
In generations past, Canada food Guide helped Canadians make food choices in order to achieve adequate nutrition for themselves and their families, especially in the early years after WWII. With current rates of overweight, obesity, Type 2 Diabetes and other forms of metabolic dysregulation, I wonder how few this beautiful new Guide is appropriate for.
If you would like to learn more about how I can help you or a family member achieve and maintain a healthy body weight and to achieve metabolic health, please send me a note using the Contact Me form located on the tab above.
To our good health!
Joy
In the following post, I validate the average amount of carbohydrate in this new Canada Food Guide.
LEGAL NOTICE: The contents of this blog, including text, images and cited statistics as well as all other material contained here (the ”content”) are for information purposes only. The content is not intended to be a substitute for professional advice, medical diagnosis and/or treatment and is not suitable for self-administration without the knowledge of your physician and regular monitoring by your physician. Do not disregard medical advice and always consult your physician with any questions you may have regarding a medical condition or before implementing anything you have read or heard in our content.
References
Araíºjo J, Cai J, Stevens J. Prevalence of Optimal Metabolic Health in American Adults: National Health and Nutrition Examination Survey 2009—2016. Metabolic Syndrome and Related Disorders Vol 20, No. 20, pg 1-7, DOI: 10.1089/met.2018.0105
Tribble DL, Holl LG, Wood PD, et al. Variations in oxidative susceptibility among six low density lipoprotein subfractions of differing density and particle size. Atherosclerosis 1992;93:189—99
Gardner CD, Fortmann SP, Krauss RM, Association of Small Low-Density Lipoprotein Particles With the Incidence of Coronary Artery Disease in Men and Women, JAMA. 1996;276(11):875-881
Lamarche B, Tchernof A, Moorjani S, et al, Small, Dense Low-Density Lipoprotein Particles as a Predictor of the Risk of Ischemic Heart Disease in Men, Circulation. 1997;95:69-75
Packard C, Caslake M, Shepherd J. The role of small, dense low density lipoprotein (LDL): a new look, Int J of Cardiology, Volume 74, Supplement 1, 30 June 2000, Pages S17-S22
Genest JJ, Blijlevens E, McNamara JR, Low density lipoprotein particle size and coronary artery disease, Arteriosclerosis, Thrombosis, and Vascular Biology. 1992;12:187-195
Siri-Tarino PW, Sun Q, Hu FB, Meta-analysis of prospective cohort studies evaluating the association of saturated fat with cardiovascular disease, The American Journal of Clinical Nutrition, Volume 91, Issue 3, 1 March 2010, Pages 502—509
Skeaff CM, PhD, Professor, Dept. of Human Nutrition, the University of Otago, Miller J. Dietary Fat and Coronary Heart Disease: Summary of Evidence From Prospective Cohort and Randomised Controlled Trials, Annals of Nutrition and Metabolism, 2009;55(1-3):173-201
Hooper L, Summerbell CD, Thompson R, Reduced or modified dietary fat for preventing cardiovascular disease, 2012 Cochrane Database Syst Rev. 2012 May 16;(5)
Chowdhury R, Warnakula S, Kunutsor S et al, Association of Dietary, Circulating, and Supplement Fatty Acids with Coronary Risk: A Systematic Review and Meta-analysis, Ann Intern Med. 2014 Mar 18;160(6):398-406
Schwingshackl L, Hoffmann G Dietary fatty acids in the secondary prevention of coronary heart disease: a systematic review, meta-analysis and meta-regression BMJ Open 2014;4
Hooper L, Martin N, Abdelhamid A et al, Reduction in saturated fat intake for cardiovascular disease, Cochrane Database Syst Rev. 2015 Jun 10;(6)
Harcombe Z, Baker JS, Davies B, Evidence from prospective cohort studies does not support current dietary fat guidelines: a systematic review and meta-analysis, Br J Sports Med. 2017 Dec;51(24):1743-1749
Ramsden CE, Zamora D, Majchrzak-Hong S, et al, Re-evaluation of the traditional diet-heart hypothesis: analysis of recovered data from Minnesota Coronary Experiment (1968-73), BMJ 2016; 353
Hamley S, The effect of replacing saturated fat with mostly n-6 polyunsaturated fat on coronary heart disease: a meta-analysis of randomised controlled trials, Nutrition Journal 2017 16:30
Dehghan M, Mente A, Zhang X et al, The PURE Study — Associations of fats and carbohydrate intake with cardiovascular disease and mortality in 18 countries from five continents (PURE): a prospective cohort study. Lancet. 2017 Nov 4;390(10107):2050-2062
We’ve come to expect that as people age they will gain more fat, loose bone mass and have decreased muscle strength which in time leads to difficulty in them getting around on their own, a greater risk of falls and eventually to physical disability. We commonly see older people with spindly little legs and bony arms and we think of this as normal’. It is common in the United States and Canada, but this is not ‘normal’.
Sarcopenia is the visible loss of muscle mass and strength that has become associated with aging here, but what we see as ‘common’ here in North America is not ‘normal’ in other parts of the world where seniors in many parts of Asia and Africa are often active well into their older years and don’t have the spindly legs and bony arms of those here.
Here in North America, we celebrate ‘active’ seniors by posting photos of them in the media sitting in chairs and lifting light weights — when people their age in other parts of the world continue to raise crops, tend their grandchildren and cook meals for their extended family, even gathering fuel and water to do so.
The physical deterioration that we associate with aging here doesn’t develop suddenly, but takes place over an extended period of time and is brought on by poor dietary and lifestyle practices in early middle age — including less than optimal protein intake and insufficient weight bearing activity from being inactive.
Protein Requirement in Older Adults
The Recommended Dietary Allowance (RDA) for protein is set at 0.8 g protein/kg per day is not the ideal amount that people should take in, but the minimum quantity of protein that needs to be eaten each day to prevent deficiency. Protein researchers propose that while sufficient to prevent deficiency, this amount is insufficient to promote optimal health as people age[1].
There have been several position statements issued by those that work with an aging population indicating that protein intake between 1.0 and 1.5 g protein / kg per day may provide optimal health benefits during aging [2,3]. For an normal-sized older woman of my size, that requires ~65-95 g of high quality bioavailable protein per day and for a lean older man of ~185 lbs (85 kg) that would require between 85 – 125 g of high quality bio-available protein per day
High bioavailability proteins are optimal to preserve the lean muscle tissue and function in aging adults and animal-based proteins such as meat and poultry are not biologically equivalent to plant-based proteins such as beans and lentils in terms of the essential amino acids they provide.
Animal-based protein have high bioavailability and are unequaled by any plant-based proteins. Bioavailability has to do with how much of the nutrients in a given food are available for usage by the human body and in the case of protein, bioavailability has to do with the type and relative amounts of amino acids present in a protein. Animal proteins (1) contain all of the essential amino acids in sufficient quantities.
Anti-nutrients such as phytates, oxylates and lectins are present in plant-based protein sources and interfere with the bioavailability of various micronutrients.
The recommendations above for older adults to eat 1.0 — 1.5 g protein / kg per day distributed evening over three meals would be on average ~30-40g of animal-based protein at each meal to provide for optimal muscle protein synthesis to prevent sarcopenia as people age. In an aging population, this maintenance of muscle mass as people age is critical to consider.
The Eat-Lancet Diet
Dr. Zoe Harcombe, a UK based nutrition with a PhD in public health nutrition analyzed the “Healthy Reference Diet” from Table 1 of the Eat-Lancet report using the USDA (United States Department of Agriculture) all-food database and found that in terms of macronutrients, it had only 90g Protein per day (14% of daily calories) which is below the 100g – 120 g per day that is consider optimal for older adults to maintain their lean muscle mass and as importantly, most of that protein is as low bioavailable plant-based proteins.
The Eat-Lancet Diet recommends only;
1 egg per week
1/2 an ounce of meat per day (equivalent to a thin slice of shaved meat)
an ounce of fish or chicken per day (equivalent to 1 sardine)
and 1 glass of milk
This is not an optimal diet to prevent sarcopenia in adults as they age.
A diet that puts seniors at significant risk of muscle wasting contributes to the loss of quality of life, significant costs to the healthcare system, as well significant cost and stress to individual families that need to care for immobile seniors.
This diet may be beneficial for those living with consistent under-nutrition (malnutrition) but this diet is anything but optimal for healthy, independent aging for the seniors of the US and Canada.
As mentioned in the previous article, the EAT-Lancet Diet also provides way too much carbohydrate intake for the 88% of Americans (and presumably a similar percentage of Canadians) who are metabolically unwell.
Final Thoughts…
For reasons mentioned above, the EAT-Lancet diet is not optimal for health for mature adults or older adults and as mentioned in the previous article, has way too high a carbohydrate intake for the vast majority of people who are already metabolically unwell.
If you would like to learn more about eating an optimal diet to support an active, healthy older age, please send me a note using the Contact Me form, above.
LEGAL NOTICE: The contents of this blog, including text, images and cited statistics as well as all other material contained here (the ”content”) are for information purposes only. The content is not intended to be a substitute for professional advice, medical diagnosis and/or treatment and is not suitable for self-administration without the knowledge of your physician and regular monitoring by your physician. Do not disregard medical advice and always consult your physician with any questions you may have regarding a medical condition or before implementing anything you have read or heard in our content.
References
Volpi E, Campbell WW, Dwyer JT, et al. Is the optimal level of protein intake for older adults greater than the recommended dietary allowance? J Gerontol A Biol Sci Med Sci. 2013 Jun;68(6):677-81
Fielding RA, Vellas B, Evans WJ, Bhasin S, et al, Sarcopenia: an undiagnosed condition in older adults. Current consensus definition: prevalence, etiology, and consequences. International working group on sarcopenia. J Am Med Dir Assoc. 2011 May;12(4):249-56
Bauer J1, Biolo G, Cederholm T, Cesari M, et al. Evidence-based recommendations for optimal dietary protein intake in older people: a position paper from the PROT-AGE Study Group. J Am Med Dir Assoc. 2013 Aug;14(8):542-59
A new report released on January 16, 2019 by the EAT-Lancet Commission on Food, Planet and Health sets out what it calls a “healthy and sustainable diet” [1] for the whole world. The EAT-Lancet report proposes what it calls the “Planetary Health Diet”; a largely plant-based diet which aims to address the simultaneous global problems of malnutrition (under-nutrition) and over-nutrition; specifically that “over 820 million people continue to go hungry every day, 150 million children suffer from long-term hunger that impairs their growth and development, and 50 million children are acutely hungry due to insufficient access to food” and that at the same time “over 2 billion adults are overweight and obese”[2]. The “Planetary Health Diet” intends address both under-nutrition and over-nutrition simultaneously by promoting a 2500 kcal per day diet that focuses on high consumption of carbohydrate-based grains, vegetables, fruit, legumes (pulses and lentils) — while significantly limiting meat and dairy. This sounds a lot like the proposed draft of the new Canada Food Guide (which you can read more about here).
The Planetary Health Diet
The Planetary Health Diet – aka the EAT-Lancet Diet [4]Here is the food per day that can be eaten per adult on the “Planetary Health Diet”;
Nuts: 50 g (1 -3/4 ounces) /day
Legumes (pulses, lentils, beans): 75 g (2-1/2 oz) /day
Fish: 28 g (less than an ounce) / day
Eggs: 13 g / day (~ 1 egg per week)
Meat: 14 g (1/2 an ounce) / day / Chicken: 29 g (1 ounce) / day
Carbohydrate: whole grain bread and rice, 232 g carbohydrate per day and 50 g / day of starchy vegetables like potato and yam
Dairy: 250 g (the equivalent of one 8 oz. glass of milk)
Vegetables: 300 g (10.5 ounces) of non-starchy vegetables and 200 g (almost 1/2 a pound) of fruit per day
Other: 31 g of sugar (1 ounce), ~50 g cooking oil
On this diet, you can have twice the amount of sugar than meat or egg, and the same amount of sugar as poultry and fish.
While is is understandable how the above diet may address the problems of under-nutrition in much of the world’s population, what about the effect of such a diet on the average American or Canadian — when 1 in 3 Americans[5] and 1 in 4 Canadians is overweight or obese[6]?
Vast Majority (88%) of Americans are Metabolically Unhealthy
A study published in November 2018 in Metabolic Syndrome and Related Disorders reported that 88% of Americans are already metabolically unhealthy[3]. That is, only 12% have metabolic health defined as have levels of metabolic markers “consistent with a high level of health and low risk of impending cardiometabolic disease“. Metabolic Health is defined as [3];
Waist Circumference: < 102 cm (40 inches) for men and 88 cm (34.5 inches) in women
Systolic Blood Pressure: < 120 mmHG
Diastolic Blood Pressure: < 80 mmHG
Glucose: < 5.5 mmol/L (100 mg/dL)
HbA1c: < 5.7%
Triglycerides: < 1.7 mmol/l (< 150 mg/dL)
HDL cholesterol: ≥ 1.00 mmol/L (≥40 mg/dL) in men and ≥ 1.30 mmol/L (50 mg/dl) in women
When looking at only 3 of the above 7 factors (waist circumference, blood glucose levels and blood pressure) more than <50% of Americans were considered metabolically unhealthy [3]. Given the slightly lower rates of obesity in Canada[6] as in the United States[5], presumably there is a slightly lower percentage of Canadians who are metabolically unhealthy, but the similarity of our diets may make that difference insignificant. As well, it was not only those who were overweight or obese who were metabolically unhealthy;
“Even when WC (waist circumference) was excluded from the definition, only one-third of the normal weight adults enjoyed optimal metabolic health.”
For the 12% of people who are metabolically healthy, a plant-based low glycemic index diet is not problematic, but it’s a concern to recommend to the other 88% to eat that way — especially if they are insulin resistant or have Type 2 Diabetes.
Is the “Planetary Health Diet” an advisable diet for the average American or Canadian adult who is already metabolically unhealthy? To answer this question, let’s look closer at the macronutrient and micronutrient content of this diet. Below is the “healthy reference diet” from page 5 of the report [7], which is based on an average intake of 2500 kcal per day;
Table 1 – Healthy reference diet, with possible ranges, for an intake of 2500 kcal/day (from Food in the Anthropocene: the EAT—Lancet Commission on healthy diets from sustainable food systems)
Nutritional Deficiency of the Eat-Lancet Diet
Dr. Zoe Harcombe a UK based nutrition with a PhD in public health nutrition analyzed the above “Healthy Reference Diet” from Table 1 of the Eat-Lancet report using the USDA (United States Department of Agriculture) all-food database and found that in terms of macronutrients, it had [8]; Protein: 90 g (14% of daily calories) Fat: 100 g (35% of daily calories) Carbohydrate: 329 g (51% of daily calories) Dr. Harcombe also reported that in terms of micronutrients, the diet was deficient in retinol (providing only 17% of the recommended amount), Vitamin D (providing only 5% of the recommended amount), Sodium (providing only 22% of the recommended amount), Potassium (providing only 67% of the recommended amount), Calcium (providing only 55% of the recommended amount), Iron (providing only 88% of the recommended amount, but mostly as much lower bio-available non-heme iron, from plant-based sources), as well as inadequate amounts of Vitamin K (as the most bio-available comes from animal-based sources).
High Carbohydrate Content
The “Planetary Health Diet” contains on average approximately 329 g of carbohydrate per day which is of significant concern — especially in light of the extremely high rates of overweight and obesity in both the United States and Canada, as well as the metabolic diseases that go along with those, including Type 2 Diabetes (T2D), cardiovascular disease, hypertension, and abnormal triglycerides. Since 1977, Canada Food Guide has recommended that Canadians consume 55-60% of daily calories as carbohydrate and the Dietary Goals for the United States recommending that carbohydrates are 55-60% of daily calories and in 2015, Canada Food Guide increased the amount of daily carbohydrate intake to 45-65% of daily calories as carbohydrate. What has happened to the rates of overweight and obesity, as well as diabetes from 1977 until the present? In the early 1970s, only ~8% of men and ~12% of women in Canada were obese and now almost 22% of men and 19% of women are obese. As mentioned above, 1 in 4 in Canada is obese and 1 in 3 in the US is and with those, Type 2 Diabetes as well as the metabolic diseases mentioned above.
Final Thoughts…
The Dietary Guidelines of both Canada and the US have spent the last 40 years promoting a high carbohydrate diet that has provided adults with between 300 g and 400 g of carbohydrate per day (based on a 2500 kcal / day diet). EAT-Lancet’s “Planetary Health Diet” may seem to be good for the planet, and for those facing under-nutrition in many parts of the world, but with 88% of Americans already metabolically unhealthy (and presumably the majority of Canadians as well), this diet which provides 300 g of carbohydrate per day is going to do nothing to address the high rates of overweight and obesity and metabolic disease that is rampant in North America.
If you would like to learn more about a low carbohydrate diet for weight loss or for putting the symptoms of Type 2 Diabetes and associated metabolic diseases into remission, please send me a note using the Contact Me form.
To our good health!
Joy
If you would like to learn why this diet provides inadequate protein for older adults and seniors, please click here.
LEGAL NOTICE: The contents of this blog, including text, images and cited statistics as well as all other material contained here (the ”content”) are for information purposes only. The content is not intended to be a substitute for professional advice, medical diagnosis and/or treatment and is not suitable for self-administration without the knowledge of your physician and regular monitoring by your physician. Do not disregard medical advice and always consult your physician with any questions you may have regarding a medical condition or before implementing anything you have read or heard in our content.
Araíºjo J, Cai J, Stevens J. Prevalence of Optimal Metabolic Health in American Adults: National Health and Nutrition Examination Survey 2009—2016. Metabolic Syndrome and Related Disorders Vol 20, No. 20, pg 1-7, DOI: 10.1089/met.2018.0105
Willet W, Rockstrom J, Loken B, et al, Food in the Anthropocene: the EAT—Lancet Commission on healthy diets from sustainable food systems, The Lancet Commissions, http://dx.doi.org/10.1016/ S0140-6736(18)31788-4
This 1/2 hour video interview was filmed January 4, 2019 for a conference I was appearing at remotely that was held in Charlottetown, Prince Edward Island on January 12, 2019. I thought that it would make an excellent introduction to my background (both educational and clinical) and how and why I came to practice and offer a low carbohydrate dietary approach.
In this video, I am interviewed by pharmacist Angela Doucette and the topics I cover are;
my educational and clinical background and the nature of my Dietetic practice before being exposed to a low carbohydrate dietary approach (focus on Mental Health Nutrition & food sensitivities / food allergies, IBS etc.) i.e. my being obese had no bearing on my Dietetic practice as it was not weight management focused
the impetus to change: visit from a retired MD girlfriend who wanted my opinion about using a low carbohydrate dietary approach to improve the symptoms of Type 2 Diabetes (T2D) and cardiovascular risk factors
First exposure was to blog of Dr. Jason Fung, Canadian nephrologist (kidney specialist), before he published his first book, his assistance in me getting started
my initial reservations regarding some of the approach i.e. safety and efficacy of using long term intermittent fasting, very high saturated fat intake, moderate protein intake (especially in post menopausal women due to predisposition to sarcopenia i.e. muscle deterioration with aging)
how and why I decided to take a slightly different approach; taking components of what I learned from Dr. Fung and others
influence of lectures by Dr. Eric Westman, MD and Dr. Ted Naiman, MD on limiting ‘added fat’ especially during weight-loss phase
influence of Dr. Stephen Phinney MD, PhD and Dr. Jeff Volek RD, PhD in the process of modifying my initial approach
starting to apply knowledge to my own clinical practice gleaned from reading clinical studies and listening to lectures by above and others
took 3 months off to rethink how I was going to implement this knowledge before using it in my practice i.e. changes needed to be evidence-based
success of initial clients long before I implemented the changes in my own life, clients still maintaining weight loss today
transformation to following a low carbohydrate dietary approach myself; March 5, 2017; a crisis in my own metabolic health
reality was brought “home” as a result of the deaths of two girlfriends both of whom also worked in healthcare
how I felt when I was faced with the need to lose a foot off my waist to achieve a healthy waist to hip ratio;
“I don’t have to lose a foot now, I only have to lose 1/2 an inch at a time”
how much weight and inches I’ve lost in 22 months following a low carbohydrate dietary approach
having put my Type 2 Diabetes into remission (not cured)
my MDs reaction to me having lost 50 pounds (was very skeptical at first!), why he referred me recently to an endocrinologist
16:00 an IMPORTANT SECTION on the different types of low carbohydrate and ketogenic diets and some clinical limitations I noticed in those that followed a very high fat diet (not loosing weight, sometimes gaining weight) even though carbohydrate content remained low. Selection of the appropriate macrodistribution is selected based on a person’s age, gender (whether they’re male or female), their stage of life (post partum, breast-feeding, pregnant, older adult), whether they are athletic or sedentary (i.e. desk job). There’s no one-size-fits-all low carb or keto diet.
Dietary Reference Intakes (DRIs) based on needs of those that eat a large percentage of carbohydrate intake, unknown what the difference in biological needs are of those that follow a low carbohydrate dietary approach
role of lab tests in dietary assessment along with a thorough dietary history
need to lower carbohydrate intake to below 130 g per day is not always required
special considerations for those of South Asian background “thin on outside, fat on inside TOFI)
why I create multi-ethnic recipes (i.e. roti)
“There are lots of different ways to do low carb and lots of different ways to do keto, and everyone’s nutrient needs are different; it depends on their age, their gender (whether they’re male or female), their stage of life (post partum, breast-feeding, pregnant), whether they are athletic or sedentary (i.e. desk job). There’s no one-size-fits-all
reflections on the role of therapeutic nutrition with other healthcare disciplines i.e. physicians, pharmacists, nurses, LPNs, physiotherapists, chiropractors, even dentists
role of Canadian Clinicians for Therapeutic Nutrition (CCTN)
You can watch the video interview here:
If you have specific questions about how a low carbohydrate approach may be helpful for you to achieve weight loss, or aiming to put your own high blood sugars into remission, lower blood pressure or triglycerides then please feel free to send me a note using the Contact Me form located on the tab above. For more information about the types of consultations and packages I offer, as well as their prices you can find out more under the Services tab or in the Shop.
LEGAL NOTICE: The contents of this blog, including text, images and cited statistics as well as all other material contained here (the ”content”) are for information purposes only. The content is not intended to be a substitute for professional advice, medical diagnosis and/or treatment and is not suitable for self-administration without the knowledge of your physician and regular monitoring by your physician. Do not disregard medical advice and always consult your physician with any questions you may have regarding a medical condition or before implementing anything you have read or heard in our content.
There are different ways to measure ‘success’ and not all of them involve weight.
Six weeks ago, I wrote about my overall progress in reaching the non-diabetic range for HbA1C after ten years since being diagnosed with Type 2 Diabetes, my improvements in blood pressure and other markers.
A month ago, I wrote about my changes in body measurements over the last 12 months and where the 25 pounds I lost came from.
Two weeks ago ‘success’ was documented with a series of composite of photos from when I was obese until now, along with some other details.
Last week, ‘success’ was comparing a series of videos that I have taken since the beginning of my journey until now.
Just have look at me in the first video (just a little over 1 minute long, link below) and even the first few minutes of the most recent video (a little over 1/2 an hour, link below) back to back!
This first video was taken March 16, 2017, just two weeks after I began my health and weight-loss journey. As significant as my size, listen to how out of breath I was!
This most recent video was filmed a week and a half ago (January 4, 2019) for the Keto-Solutions Bootcamp in Charlottetown, Prince Edward Island. Sure, I’m not walking in this one but trust me, I can do that and so much more now without getting winded!
Weight loss update
Yesterday, my weight dropped to a BMI of 24 (well into the normal weight category) which was pretty exciting given when I started it was around 32 (in the obese category) and as I suspected from the number of times I needed to get up last night, my weight dropped again today. I normally weigh myself only once a week, unless I know my weight has dropped.
Body Mass Index (BMI) changes from January 2018 – January 2019
With the drop in weight over the last few days (even with adjustments for body water fluctuation) and am around 3 1/2 pounds from my goal weight — well actually my third goal weight.
When I first started my journey, I set as a preliminary “goal weight” as the weight I would like to get to, if possible. That was the weight I was a year ago!
Having achieved that, last January I set a new “goal weight” of what I’d like to get to where I thought my waist circumference would be 1/2 my height. Once I reached that weight, I revised my “goal weight” downward — closer to the lowest adult weight that I was where I once looked best. Currently, I am just a little over 3 pounds from that weight.
Below is a graph of what my weight loss progress looks like over the past year (since the beginning of January 2018).
I’ve lost 27.5 more pounds on top of the 24 pounds I lost from March 5, 2017 until January 2018.
Weight loss – January 2018 to January 2019
To date, I’ve lost a total of 51.5 pounds and to be honest I have no idea what my final weight will be!
My focus over the next several months is on achieving optimal health and that is about building additional muscle and continue to lose about 10 pounds of excess fat. It’s hard for me to know what “weight” I will be when I’ve accomplished that, but in the end, I don’t think it matters much.
Building muscle for me is all about health — and of reducing my risk of sarcopenia as I age (you can read more about that here). Continuing to lose the excess fat is all about further reducing any insulin resistance and continuing to lower my HbA1C even lower into the normal range with the goal of achieving full remission from Type 2 Diabetes (you can read more about that here).
At this point in my journey it is about striving for “optimal” rather than some measure of “ideal”.
The way I look at it, optimal is what makes sense for a ‘woman of a certain age’ who is newly in remission from Type 2 Diabetes almost 10 years after being diagnosed. Optimal is based on the exercise I am capable of doing now — after having both knees operated on in the past, as well as a back injury 8 years ago. Given my age, my knees and my back, what is optimal won’t be anywhere near what I was capable at 25 years old when I was doing 10 hours of karate a week! Those days are gone, but what is ahead is whatever I make of it now.
Pushing for the muscle gains now will factor into what what kind of “old age” I will live and losing the rest of the fat may enable me to achieve full remission from Type 2 Diabetes. This is more important than how I look!
And so begins another calendar year in my journey – a journey now focused on achieving optimal, not ideal.
If you’d like to know more about how I can help you accomplish your health and nutrition goals please have a look at the Services tab to learn more about the sessions and packages I offer and feel free to send me a note using the Contact Me form located on the tab above, if you have specific questions about how I can help.
To our good health!
Joy
NOTE: This post is classified under “A Dietitian’s Journey” and is my personal account of my own health and weight loss journey that began on March 5, 2017. Science Made Simple articles are referenced nutrition articles, and can be found here.
LEGAL NOTICE: The contents of this blog, including text, images and cited statistics as well as all other material contained here (the ”content”) are for information purposes only. The content is not intended to be a substitute for professional advice, medical diagnosis and/or treatment and is not suitable for self-administration without the knowledge of your physician and regular monitoring by your physician. Do not disregard medical advice and always consult your physician with any questions you may have regarding a medical condition or before implementing anything you have read or heard in our content.
Tomorrow will be 22 months to the day (March 5, 2017-January 5, 2019) that I realized that I was metabolically very unwell; having a resting blood pressure in the hypertensive emergency category and uncontrolled blood sugar which was topping 13 mmol/L (235 mg/dl) after a meal. As I have said in every podcast and interview that I have done since and have written in several articles, what I should have done at that point was to go straight to my doctor and let him put me on the medications required and then have changed my diet and lifestyle, but I was frightened with the prospect of coming out of denial and decided instead to immediately change how I ate and recover my own health. That was a risky thing to do as my risk of heart attack and stroke was very high and in retrospect it is not what I would have done. It is certainly not something I would recommend anyone else to do! Knowing what I know now, I should have started on medications and then adopted the same dietary and lifestyle changes and as my health improved, had my doctor lower the dosages and then eventually discontinue them. But that as they say is water under the bridge now.
In my first entry in “A Dietitian’s Journey” simply titled “The Beginning” I set the following goals;
I want;
(1) blood sugar in the non-diabetic range
(2) normal blood pressure
(3) normal / ideal cholesterol levels
(4) a waist circumference in the ”at or below” recommended values of the Heart and Stroke Foundation
Will I meet all these goals? Who knows?! But I won’t know if I don’t try and the alternative of a life of medication for blood sugar, blood pressure and eventually cholesterol too does not appeal to me!
March 16, 2017 I posted my second entry titled The Road to Better Health about why I decided to add a walking routine to my dietary changes and this was where I posted my first video.
You have to see this to believe it!
It’s not only how I look but how I sound! Its evident that I am unable to walk at a reasonable pace and talk without being out of breath.
Here is my second video, posted July 25, 2017, just 4 months into eating a low carbohydrate (not ketogenic) diet. As you can see, I had already lost some weight and could talk without being totally winded while walking.
At this point, I had lost 10 pounds, my HbA1C (3 month average blood sugar level) was down from an average of 12 mmol/L to 8.5 mmol/L. My blood pressure which had dropped to ~140/80 mmHg had begun to rise to in the 160/90 mmHg range so I decided to ask my doctor to put my on Ramipril (Altace) until diet and weight loss is sufficient to maintain it at a normal level on its own. My goals at that point were;
I still have at least another 30 pounds to go to get to the ”goal weight” that I set at the beginning of this journey, and am now aiming to lose another 40-45 pounds instead in order to reach my ideal (healthiest) waist to height ratio.
By my one-year anniversary of following a low carbohydrate diet, this is what I had achieved;
So far, I’ve lost;
32 pounds
8 inches off my waist
2 inches off my chest
3 inches off my neck
1 inch off my arms
1/2 inch off my thighs.
I no longer meet the criteria for Type 2 Diabetes
I have blood pressure that ranges between normal and pre-hypertension
I have ideal triglycerides and excellent cholesterol levels.
While I’m still overweight and have approximately another 20 pounds to lose to reach a healthy waist circumference, I am not as desperately unhealthy as I was this time last year.
I am alive, much healthier and committed to continuing this journey.
July 25, 2018, a full year after the previous video above and 16 months into A Dietitian’s Journey, I posted the next video update. By this point I had lowered the amount of carbohydrate in my diet down considerably in order to achieve the metabolic recovery I sought. The difference between the very first video from March 16, 2017 and this one is remarkable; not just in the way I look, but how I sound!
By this date, I had lowered my fasting insulin from when I began where it was 54 pmol/L (7.8 μU/ml) to 33 pmol/L (4.8 μU/ml) which was in the ideal range, between 2-6 μU/ml. My HbA1C had dropped from 7.5% to 6.3% which was finally below the cutoffs for Type 2 Diabetes, which is 6.5%. Using diet alone and without taking any medication, I was finally in partial remission of Type 2 Diabetes.
This brings us to today. Five months have passed since the last video update above and tomorrow will be 22 months since I began A Dietitian’s Journey. I recently achieved my last two health goals of (a) having my waist circumference that is half my height and (b) having lost the last 20 pounds. Yesterday, my doctor took my blood pressure and it was in the normal range (still taking a “baby dose” of Ramipril) and next week I will be having my HbA1C done, which will be the first time since I voluntarily started on Metformin after having reached partial remission from Type 2 Diabetes with diet alone. I chose to do this for several reasons, including my dad’s recent Alzheimer’s diagnosis and it’s relationship to glucose dysregulation, as well as because I was still having difficulty lowering my early morning fasting blood glucose due to my liver’s gluconeogenesis (making glucose) in the wee hours of the morning.
Yesterday I taped a 1/2 hour talk with a Pharmacist colleague in Prince Edward Island who is holding a one-day workshop in Charlottetown on Saturday, January 12th, called Keto Solutions Bootcamp. Since I was unavailable to appear ‘live’ that day, I taped the segment yesterday that will be shown during my scheduled slot.
I gave her my word that I would not post the video until after the workshop but posted a screenshot instead.
UPDATE: January 13, 2019
Here is the link to the video:
Some final thoughts…
I have also demonstrated that even for someone who was overweight and obese for YEARS, it is entirely possible to achieve a healthy body weight eating whole, real food.
I didn’t deprive myself. I ate burgers and pizza, Chinese, Thai, Indian and Canadian food, and even some treats once in a while like batter fried fish and New York Style Cheesecake; all adapted to be low carb (see the recipe section for details).
As I coach my clients to do, I ate if I was hungry but didn’t eat just because it was “time” if I wasn’t. I ate delicious real food with a wide range of diversity in tastes and textures and made sure to get sufficient micronutrients (vitamins and minerals) not just “macros” (protein, fat and carbohydrate). I didn’t have bulletproof coffee once and never ate a “fat bomb”. Yes, there is a lot more to a low carbohydrate diet than bacon, cream and butter!
If you’re curious to learn more, please have a look around my web page. Have a read of some of the articles under the Food for Thought tab. Most are fully referenced and written in my “Science Made Simple” style so that anyone can understand.
If you are interested in knowing more about the packages and hourly consultations that I provide, please click on the Services tab to find out more. Should you decide you want to get started, everything you need is there, including the Intake and Service Option Form to download and complete. If you would like a password protected one to secure the completed information so you can email it to me, please drop me a note and I will be glad to send it to you.
Finally, if you have questions about how I can help you, please send me a note using the Contact Me form on the tab above and I will reply as soon as possible.
My “A Dietitian’s Journey” is my “sample set of one” (n=1) account of what I was able to accomplish, but everyone’s journey is different. Some people take less time than I did to reach their goals and some take more depending on where they start from, but this is about recovering one’s health and achieving a healthy body weight and the way I look it is if it took us years to get to the place of ill-health we begin from, are we not worth the investment to take whatever time it takes to get well? I think so!
Please let me know if I can help you restore your own health or help a loved one.
To your good health!
Joy
NOTE: This post is classified under “A Dietitian’s Journey” and is my personal account of my own health and weight loss journey that began on March 5, 2017. Science Made Simple articles are referenced nutrition articles, and can be found here.
LEGAL NOTICE: The contents of this blog, including text, images and cited statistics as well as all other material contained here (the ”content”) are for information purposes only. The content is not intended to be a substitute for professional advice, medical diagnosis and/or treatment and is not suitable for self-administration without the knowledge of your physician and regular monitoring by your physician. Do not disregard medical advice and always consult your physician with any questions you may have regarding a medical condition or before implementing anything you have read or heard in our content.
NOTE: This article is an editorial but is cross-posted under Science Made Simple to make it easy to find.
Critics of the use of a low carbohydrate diet for weight loss and for putting the symptoms of Type 2 Diabetes into remission will often say that there are no randomized control trials (RCTs) showing that this diet is safe and effectiveness over the long-term, but what they often don’t realize is that there were no randomized controlled studies demonstrating safety and efficacy underlying the recommendation that people consume 45-65% of their daily calories as carbohydrate, while limiting their fat intake. What we do have in both Canada and the US since 1977 (when the Dietary Guidelines in both countries changed) is 40+ years of epidemiological data showing a massive increase in the incidence and prevalence of obesity and Type 2 Diabetes that shows no sign of letting up, and a millions of people that are fed-up of feeling “sick and tired”. Is it simply that people stopped “moving” as much or could it be the diet?
Recently, the therapeutic use of a low carbohydrate diet as a dietary option for reducing blood sugar, use of blood-sugar lowering medications and for weight loss has been recognized by the American Diabetes Association (ADA) in the release their 2019 Standards of Medical Care in Diabetes (you can read more about that here. In addition, in October 2018 the ADA and the European Association for the Study of Diabetes (EASD) released a joint position paper that classifies a low carbohydrate diet as Medical Nutrition Therapy for the treatment of Type 2 Diabetes in adults (more about that here). This means that physicians and healthcare professionals in Europe and the United States can recommend a low carbohydrate diet as one of the treatment options for their patients. This moves a low carbohydrate diet from the realm of popular lifestyle choice to Medical Nutrition Therapy for the purpose of disease management.
You can get a one-page downloadable summary (with references) of both the American Diabetes Association (ADA) 2019 Standards of Medical Care in Diabetes and the ADA and the European Association for the Study of Diabetes (EASD) joint position paper here.
As covered in previous articles, there are ample studies showing that a well-designed low carbohydrate diet is both safe and effective for putting Type 2 Diabetes into remission and for weight loss.
In fact, there was a list compiled by Dr. Sarah Hallberg at the end of January 2018 of studies that involved a low carbohydrate diet which spanned 18 years, 76 publications involving 6,786 subjects, including 32 studies of 6 months or longer and 6 studies of 2 years or longer. Now, it is a year later and there are numerous other studies including very recent two-year data from the Virta Health study which demonstrates that a low carbohydrate diet is not only safe, but effective long term.
But there’s something about real-life, personal (n=1) accounts of ordinary people losing weight and putting their Type 2 Diabetes and other metabolic conditions into remission that people find very compelling.
Diet Doctor, a well-known website dedicated to a low-carb high fat / “keto” approach has a whole section of “success stories”, and a very popular ketogenic Facebook page from Nigeria which promotes a “keto” diet (mostly self-defined) does as well.
What about when the “ordinary people” that lose weight and put their own metabolic disorders into remission also happen to be healthcare professionals? It seems many find this particularly compelling because we know the full range of dietary options and have chosen the method we have after careful consideration.
As many of you know, I was recently the featured guest on the Low Carb MD Podcast which was hosted by Dr. Tro Kalajian and Dr. Brian Lenzkes. As outlined on the article at the link above, both of these doctors struggled with obesity their whole lives and both have lost weight and found improved metabolic health, and are now helping their patients to do the same.
Then there’s me, a Registered Dietitian in private practice who’s lost almost 50 pounds and put my Type 2 Diabetes of 10 years into remission.
The three of us are just ‘two Docs and a Dietitian’ who were sick of being sick, but there are many more healthcare practitioners just like us that have done similarly, including some of the more than 1500 that are part of the Canadian Clinicians for Therapeutic Nutrition (CCTN) Facebook group and members of CCTN.
We are ordinary people who as clinicians are knowledgeable about the therapeutic benefits of following a low carbohydrate diet and who have implemented it in our own lives. Our stories are not scientific case studies, nor are they part of a randomized controlled trials or research of any kind. Our single subject (n=1) anecdotal stories and those of hundreds of thousands of ordinary people from all walks of life are powerful because they stand in sharp contrast to the large percentage of the population that are overweight or obese just like we were, but who keep eating the same way and getting sicker.
We offer people choices.
The choice of turning things around.
The option of getting healthy.
The ability to achieve a healthy body weight and in the process be able to have our doctors reduce or eliminate medications for metabolic diseases.
If you’re tired of being “sick and tired” then I’d encourage you to listen to the podcast above or to have a look through some of the “Science Made Simple” articles on this web page under the Food for Thought tab. There you can learn about the different types of “low carb” and “keto” diets and get a feel for what eating this way is like.
If you would like medical support in the US, be sure to check out Dr. Kalajian and Dr. Lenzkes, other physicians such as Dr. Eric Westman and Dr. Ted Naiman, as well as the Virta Health Clinic, as well as many others who are knowledgeable and experienced to provide you with support in this area. If you are in Canada and are looking for a therapeutic nutrition practitioner, you can search the list on the CCTN website (link above) and if you’d like to know how I can help (either in-person or from where you are via Distance Consultation) then feel free to send me a note using the Contact Me form above and I’ll reply as soon as possible.
LEGAL NOTICE: The contents of this blog, including text, images and cited statistics as well as all other material contained here (the ”content”) are for information purposes only. The content is not intended to be a substitute for professional advice, medical diagnosis and/or treatment and is not suitable for self-administration without the knowledge of your physician and regular monitoring by your physician. Do not disregard medical advice and always consult your physician with any questions you may have regarding a medical condition or before implementing anything you have read or heard in our content.
This morning I went to do my exercises and realized that it’s been 10 months since I took my last photo in gym clothes and decided it was a good time for an update.
During the first year of my “journey”, I didn’t exercise at all except for walking and had set the goal of implementing some weight and resistance training beginning March 5th, 2018 (my one year “anniversary” of adopting a low carb lifestyle). I was inspired by some doctor colleagues in the Canadian Clinicians for Therapeutic Nutrition group and decided to start slow HIT (slow high intensity training) following the method of Dr. Doug McGuff (Body By Science) but in hindsight, given my age and the number of years I had not exercised, I probably should have started by retraining major muscle groups and strengthening my core first. I didn’t and ended up aggravating an old back injury and spent most of the summer going through physiotherapy for that. I was in so much pain that even walking was difficult at first, so exercise outside of daily physio was set aside.
As a result of my back injury, I engaged the help of a terrific kinesiologist, and asked her for exercises to build up my knees and shoulders, as well as my back as I knew these were “weak links”. I faithfully worked on training one of those areas daily, until I ended up injuring one of my knees (also an old injury!) getting out of one of my son’s low-slung car! Sheesh, I felt like I couldn’t ‘win’. Years ago I had each of my knees operated on (torn meniscus in each) after various injuries from years of dance, horseback riding and karate, so my best made plans for exercise this year did not turn out as I intended.
February 2, 2018 – December 30, 2018
Even without doing most of the exercise that I planned to do during this past year, my body shape evolved, as can be seen in these two photos. The one on the left was taken February 2, 2018 and the one on the right, this morning (Dec 30, 2018).
For the last 6 weeks, I have been both resting my knee injury as any amount of weight bearing hurt and only worked to gently build up the supporting muscles in that knee. Last week after much patience and frustration, I was finally able to walk up the stairs without pain (provided I didn’t try to carry anything heavy at the same time)!
Since I didn’t want to overdo it but knew I needed to start moving forward with my exercise commitment, I began by doing a few slow deep-knee bend squats each day; first 5 at a time. The last week, I began adding a set here and there whenever I went upstairs for something (a random excuse which served as a reminder). By the end of this week I was doing 20 – 30 full-knee bend squats per day, 5 at a time. This is HUGE progress! My goal now is to begin exercising regularly WHILE NOT injuring anything by not being adequately focused on my body mechanics!
While my exercise plans this year didn’t turn out as I hoped, in the end I did end up strengthening my core muscles and building up my knees, lower back and shoulders (one of which is still causing me a bit of grief). I am not letting these setbacks deter me — any more than I let past weight loss stalls deter me.
My goal is to get as healthy as I can and that takes me being dedicated to the process regardless of setbacks. Setback happen. They happen to everyone.
Here’s my recap of my progress so far;
In the first year (March 5, 2017 – 2018) I lost a total of 32 pounds and lost 8 inches off my waist. I no longer met the criteria for Type 2 Diabetes (when I began my blood sugar was uncontrolled) and at the end of the first year my blood pressure ranged from between normal and pre-hypertensive (when I began it was dangerously high). At the end of the first year, my triglycerides were ideal and I had excellent cholesterol levels (details here).
This past year, I lost an additional 18.5 pounds and another 4 inches off my waist; making it a foot in total! My waist to height ratio is now below .50 so I am satisfied. I am 1.5 inches from my final goal weight and am trying to decide if I want to lose another 5 pounds or if I want to focus on toning up my muscles, or both. For details on exactly what I lost from my arms, legs, belly etc. you can read more here.
Two and a half years of change — from April 2015 — September 2017
Twenty-two months ago this coming week, I was an obese, metabolically very unwell Dietitian with Type 2 Diabetes, very high blood pressure and abnormal cholesterol.
February 2, 2018 – December 30, 2018
I certainly haven’t “arrived” by any means, but I am a whole lot healthier and feel better than I have in years.
As I tell my clients, its about “progress”, not “perfection”.
I hope my journey has inspired you that losing weight and getting healthy can be done and while it’s not a straight-forward line of progress all the time, and stalls and setbacks do occur, goals that are realistic set CAN be accomplished. Sometimes they just take a little longer than planned.
If you’d like to know more about how I can help you accomplish your health and nutrition goals this coming year, please have a look at the Services I offer and if you have questions, please send me a note using the Contact Me form located on the tab above. If you’d like some help setting some realistic goals for this coming year, please have a look at the special package I put together which is at a special price during the month of January.
Wishing you and yours the very best for a healthy and happy New Year!
Joy
NOTE: This post is classified under “A Dietitian’s Journey” and is my personal account of my own health and weight loss journey that began on March 5, 2017. Science Made Simple articles are referenced nutrition articles, and can be found here.
LEGAL NOTICE: The contents of this blog, including text, images and cited statistics as well as all other material contained here (the ”content”) are for information purposes only. The content is not intended to be a substitute for professional advice, medical diagnosis and/or treatment and is not suitable for self-administration without the knowledge of your physician and regular monitoring by your physician. Do not disregard medical advice and always consult your physician with any questions you may have regarding a medical condition or before implementing anything you have read or heard in our content.

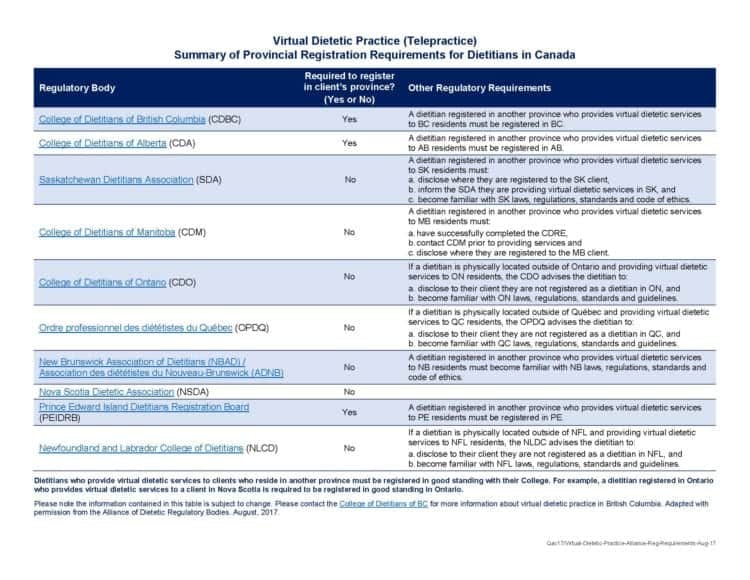


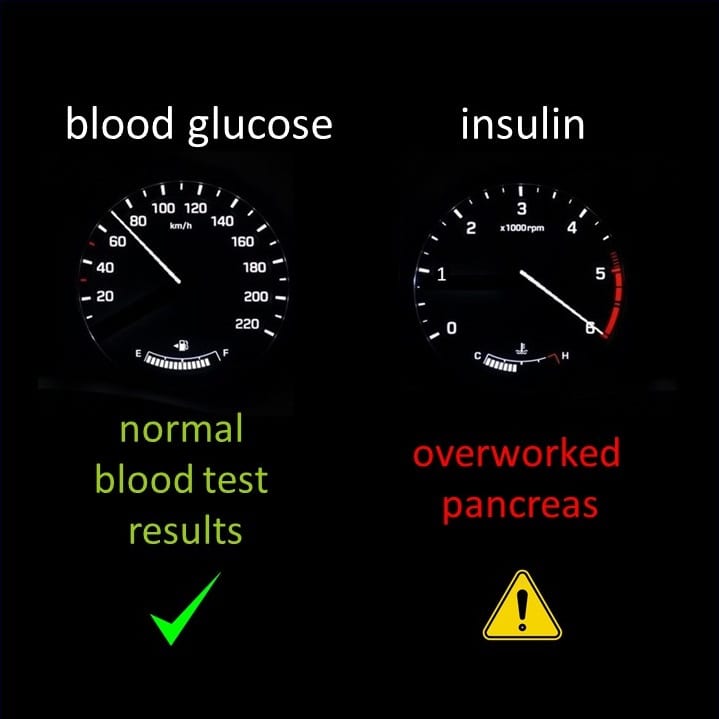
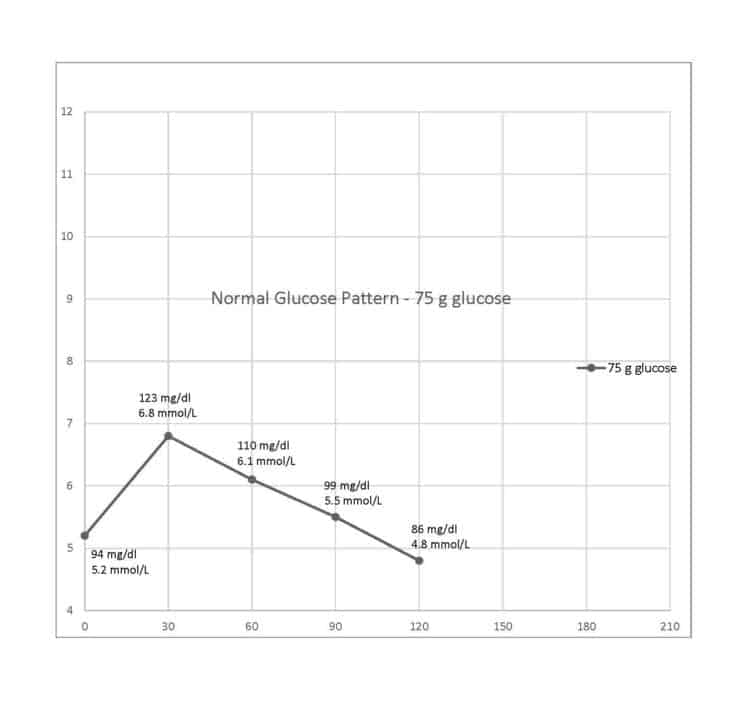
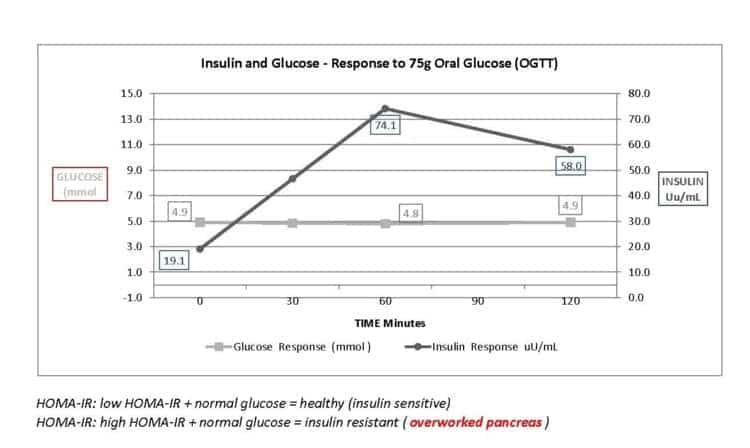
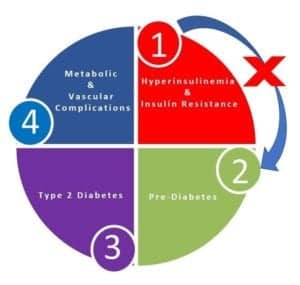
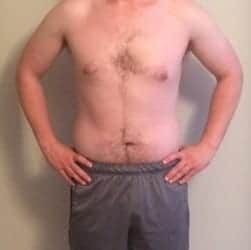 When I first assessed Nathan, his waist was 37 – 3/4 inches when measured halfway between his lowest rib and the top of his hip bone, his hips were 41 – 1/2 inches and he wore size 32 pants.